The Interface
This page is a tour of the Studio window. Later pages cover editing, running analyses, and the AI assistant in depth.
Layout at a glance
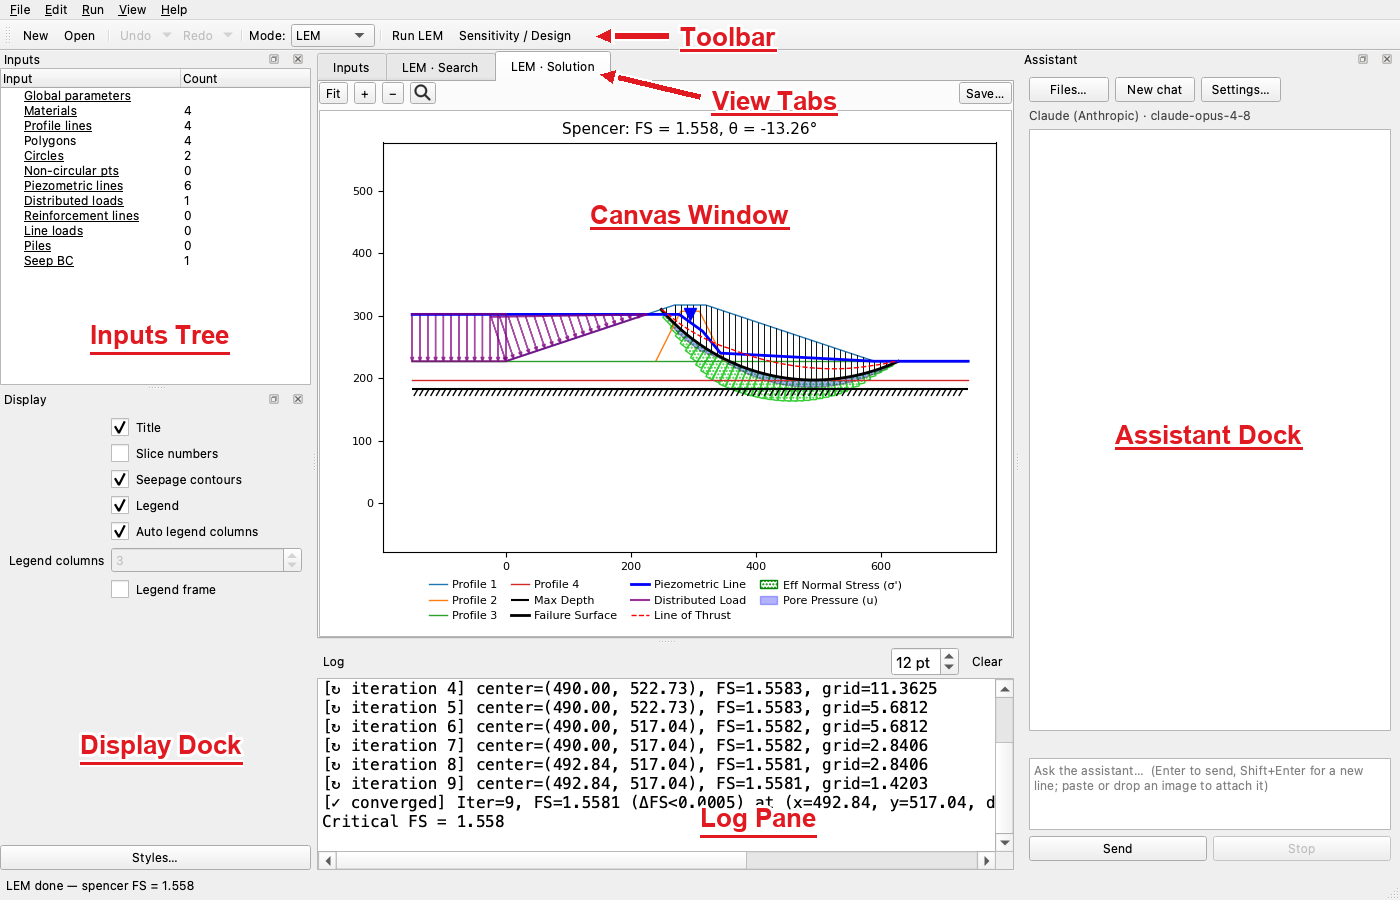
The window is organized around a central canvas with docks on each side:
| Region | Purpose |
|---|---|
| Toolbar (top) | New / Open, Undo / Redo, the analysis-mode selector, Build Mesh, Run, and Parametric. |
| Inputs tree (left, top) | A list of every input category; click one to edit it. |
| Display dock (left, bottom) | Per-view plot options for the active result tab, plus the Styles… button. |
| Canvas + view tabs (center) | The plots. The Inputs tab is always present; result tabs are added as you run analyses. |
| Log pane (bottom) | Live engine output — convergence traces, search progress, warnings. |
| Assistant dock (right) | The AI chat panel. |
Docks can be moved, stacked, floated, or closed; the View menu toggles each one back on.
The canvas
Every view — Inputs and all result tabs — is an image of a Matplotlib figure shown in a zoomable, pannable canvas. Each canvas has a small toolbar:

| Control | Action |
|---|---|
| Fit | Frame the drawing to the window. |
| + / − | Zoom in / out. |
| Zoom to box | A checkable mode — drag a rectangle to zoom into it (otherwise drag pans). |
| Save… | Export the current view as a PNG / PDF / SVG image, or as a DXF (see Export). |
You can also wheel-zoom anchored at the cursor and drag to pan. The whole figure — axes, title, labels, margins — zooms together like an image viewer. Text stays crisp because the figure is re-rendered at a resolution matched to the zoom level rather than scaled as pixels.
Double-click to edit
On the Inputs view, double-clicking a feature opens its editor with the item pre-selected. The Inputs view shows a select (arrow) cursor and a "(double-click on a feature to edit)" hint. See Editing inputs.
Analysis mode (LEM / Seepage / FEM)
A Mode selector in the toolbar switches between the three analysis types:

- LEM — limit-equilibrium slope stability.
- Seepage — finite-element groundwater flow.
- FEM — finite-element slope stability (SSRM).
The mode controls two things:
- What the Inputs view emphasizes — the material table shows the columns relevant to that mode (strength columns for LEM, hydraulic for seepage, elastic for FEM).
- What Run does — the Run button is mode-driven, reading Run LEM…, Run Seep…, or Run FEM…. Build Mesh appears only in Seepage and FEM mode, and Seep/FEM runs stay disabled until a mesh has been built.
The view tabs
The central area is a tab strip. The Inputs tab is always first; running an analysis adds the relevant result tab(s) and switches to them:

| Tab | Shown after | Content |
|---|---|---|
| Inputs | always | The model geometry and inputs. |
| LEM · Search | an automated search | All trial surfaces, the critical surface, and the search path. |
| LEM · Solution | any LEM solve | The critical surface with slices, base stresses, and thrust line. |
| LEM · Reliability | a reliability run | The reliability results, plus the MLV surface in the Solution tab. |
| Mesh | Build Mesh | The finite-element mesh. |
| Seep · Data / Seep · Solution | a seepage run | Mesh + boundary conditions, and the head/flow solution. |
| FEM · Data / FEM · Results | an FEM run | Mesh + BCs + reinforcement, and the deformation / shear-strain results. |
Opening or creating a project clears the result tabs. Editing an input that invalidates a result removes the now-stale tab (see Stale results).
Two boundary-condition sets
For rapid-drawdown seepage, each BC set keeps its own tab pair (Seep · Data 2 / Seep · Solution 2), so you can compare BC 1 and BC 2 side by side.
The Display dock
The Display dock (under the Inputs tree) holds per-view plot options that follow the active result tab — what to show, not how to solve. Examples: material table placement and legend columns on the Inputs view; slice numbers and seep contours on the LEM · Solution view; the variable to plot, contour levels, and flowlines/vectors on the Seep · Solution view; plot type and deformation scale on FEM · Results. Changing an option re-renders the cached result immediately — no re-solve.
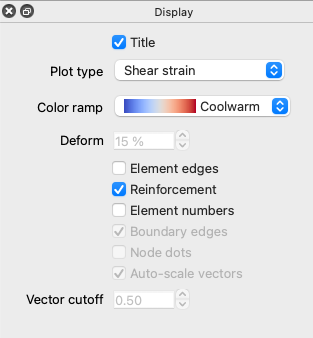
At the bottom of the dock, the Styles… button opens the project-wide Styles dialog for per-feature colors, hatches, and line styles.
Display options vs. styles
Display options are per-view and ephemeral (what a plot shows). Styles are project-global and persistent (how a feature looks — its color, hatch, line style). They live in different places for that reason.
The Log pane
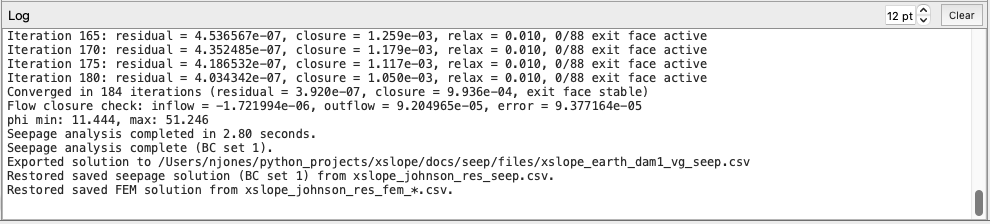
Long-running solves stream their engine output to the Log pane live — Bishop iteration counts, search refinement steps, seepage convergence traces, SSRM factor brackets. A progress bar and a Cancel button appear at the right of the status bar during a run; cancelling aborts cleanly and leaves no partial result tab.