Rocscience Slide2 Verification Corpus
The Rocscience Slide2 verification manual contains 111 slope stability problems drawn from the published literature, each with Slide2's computed factors of safety and (in most cases) independent reference values from the original authors. XSLOPE is being verified against this corpus problem by problem: each built entry links an XSLOPE input file reproducing the problem, reports the comparison, and is locked into the automated regression suite via a test tag. Status values: built (input file + verified results below), covered (equivalent to an existing XSLOPE sample), partial (some data extracted, some still needed), blocked (source data not yet available), planned.
Full bibliographic details for the author-year citations on this page are on the shared References page.
Problems are built from the manual's tabulated data and coordinate-labeled figures; where a problem's geometry exists only as an unlabeled figure, the original source publication is consulted before the problem is marked built — no digitized guesses are used for benchmark inputs.
Roughly a third of these problems are also in the GeoStudio (SLOPE/W) corpus, which solves them with a second commercial program. Shared rows link to it, and it links back. That corpus is worth reading alongside this one for two reasons: SLOPE/W's numbers give an independent third opinion where Slide2 and the original author disagree, and its verification models are public downloads that XSLOPE can import directly — so those problems need no rebuilding from a figure at all.
Completeness. Not every problem can be reproduced, and where one cannot the row records why rather than leaving a blank. The no lock possible rows are final: the measured pore-pressure-grid embankments (VP11–13) print construction-induced excess pressures with no flow field behind them, so no seepage solution can regenerate them, and XSLOPE deliberately takes water only as piezometric lines, ru, or FE seepage. The remaining blocked / partial rows are each tracked against a named gap — a vendor construction the physics does not share (VP110's equivalent fluid pressure support type) or a vendor artifact its published source does not reconstruct (VP46's stage-3 undrained-strength field, which Baker (1993) prints only as a two-dimensional contour map no per-material 1-D strength function reproduces to lock tolerance) — not an open-ended backlog. Everything else is built and regression-locked; the corpus is complete relative to what is independently verifiable.
| # | Problem | Status | XSLOPE file / results |
|---|---|---|---|
| 1 | Slope, homogenous | built | xslope_acads_simple.xlsx. ACADS 1(a): seven-method comparison vs the ACADS consensus 1.00; Bishop 0.985 vs Slide 0.987. Also SLOPE/W §2.1 — same problem in the GeoStudio corpus. |
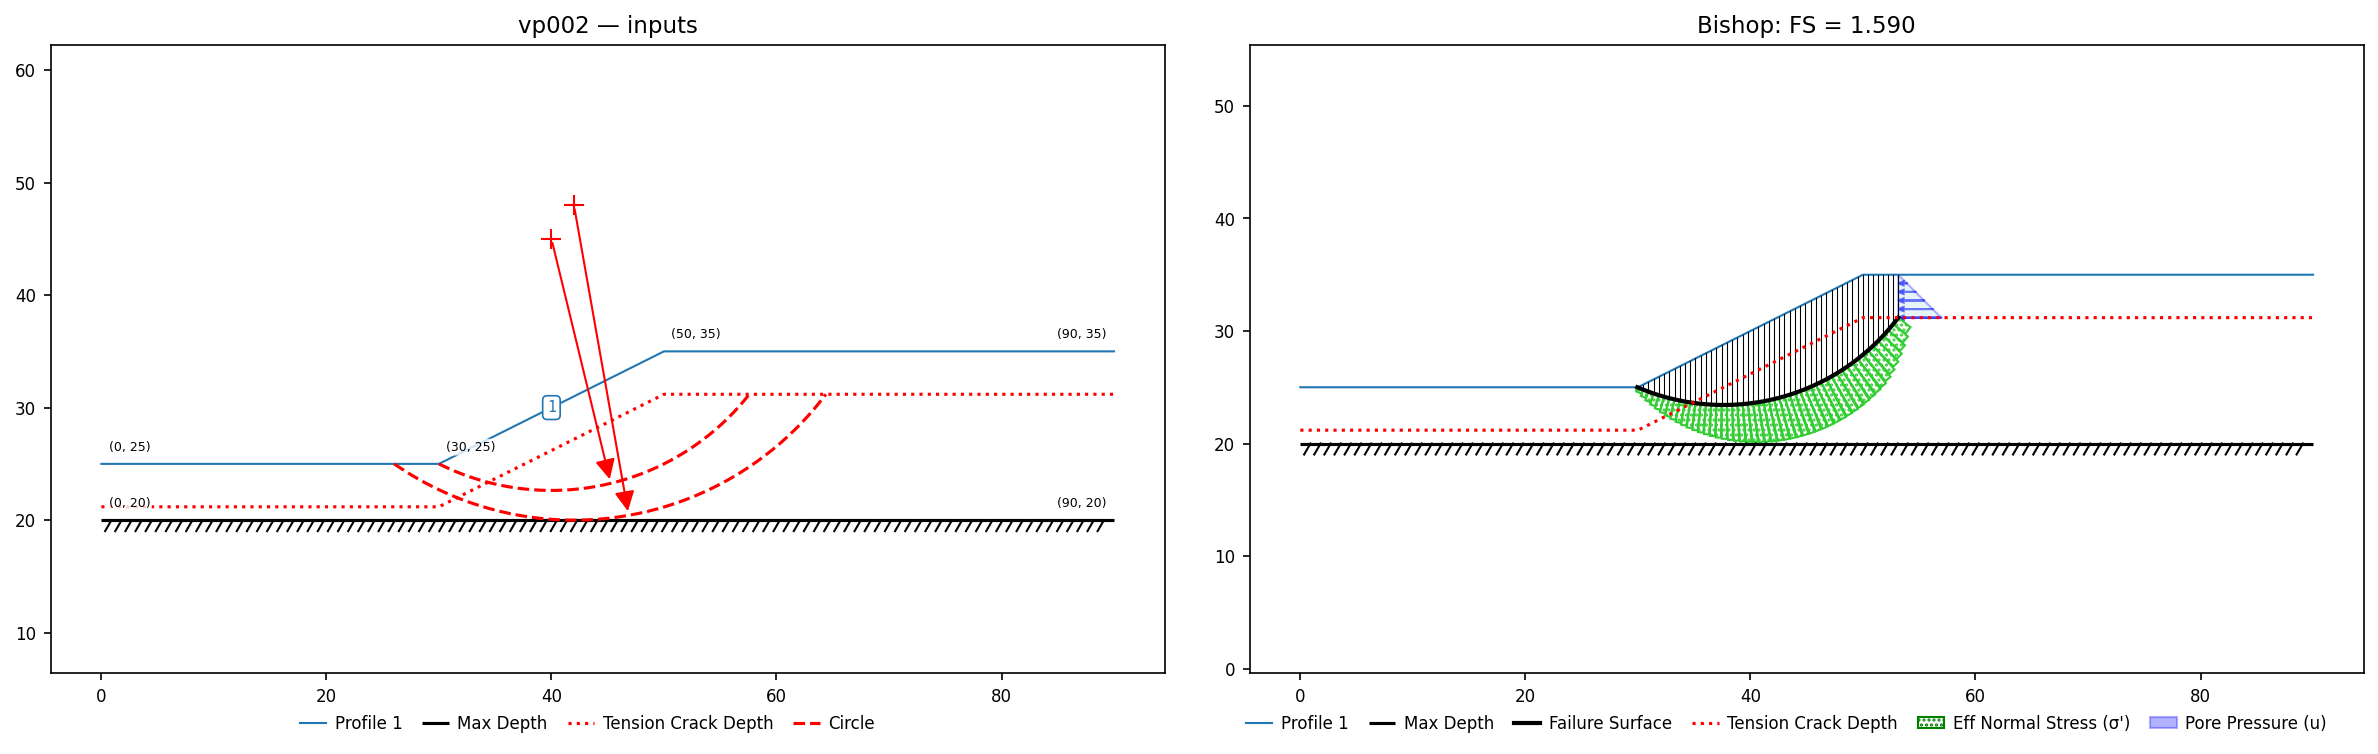
| 2 | Slope, homogenous, tension crack | built | vp002.xlsx. Bishop 1.589 / Spencer 1.585 / Janbu(corr) 1.495 / M-P 1.586 vs Slide 1.596 / 1.592 / 1.489 / 1.592 (±0.4%); Giam reference 1.65. Also SLOPE/W §2.2 — same problem in the GeoStudio corpus. |
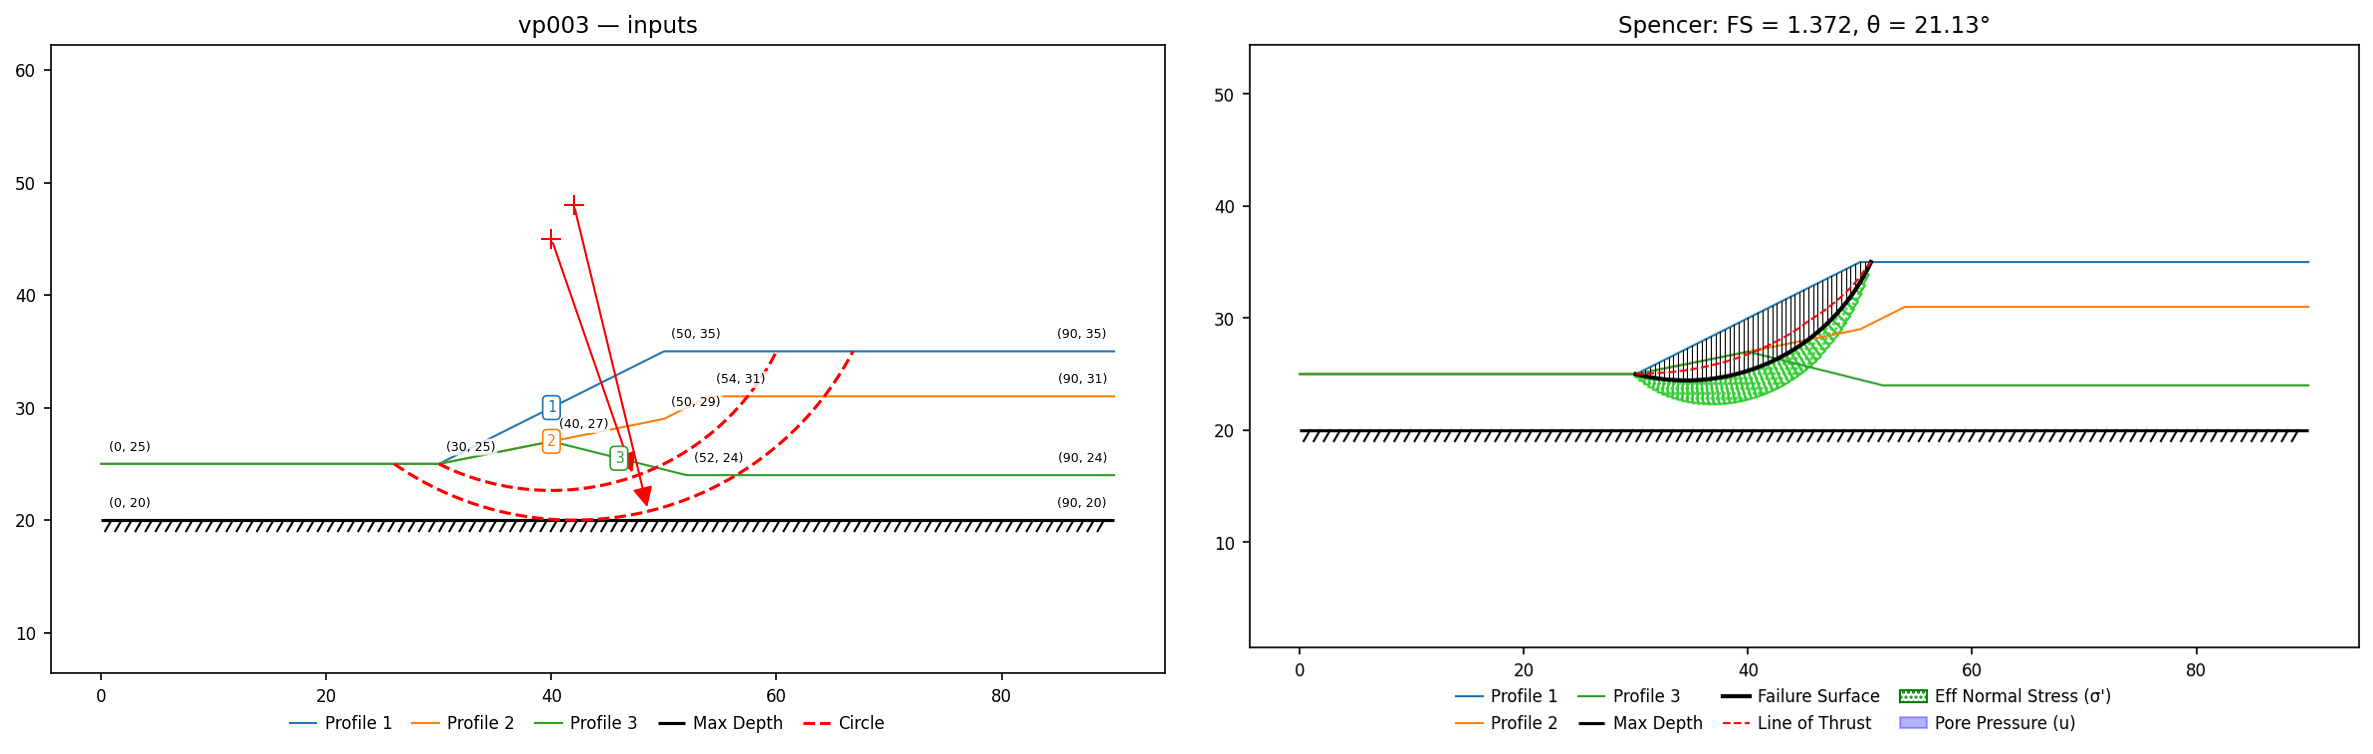
| 3 | Slope, (3) materials | built | vp003.xlsx. ACADS 1(c) non-homogeneous three-layer slope; interface coordinates from the labeled GeoStudio verification-manual figure. Also SLOPE/W §2.3 — same problem in the GeoStudio corpus. |
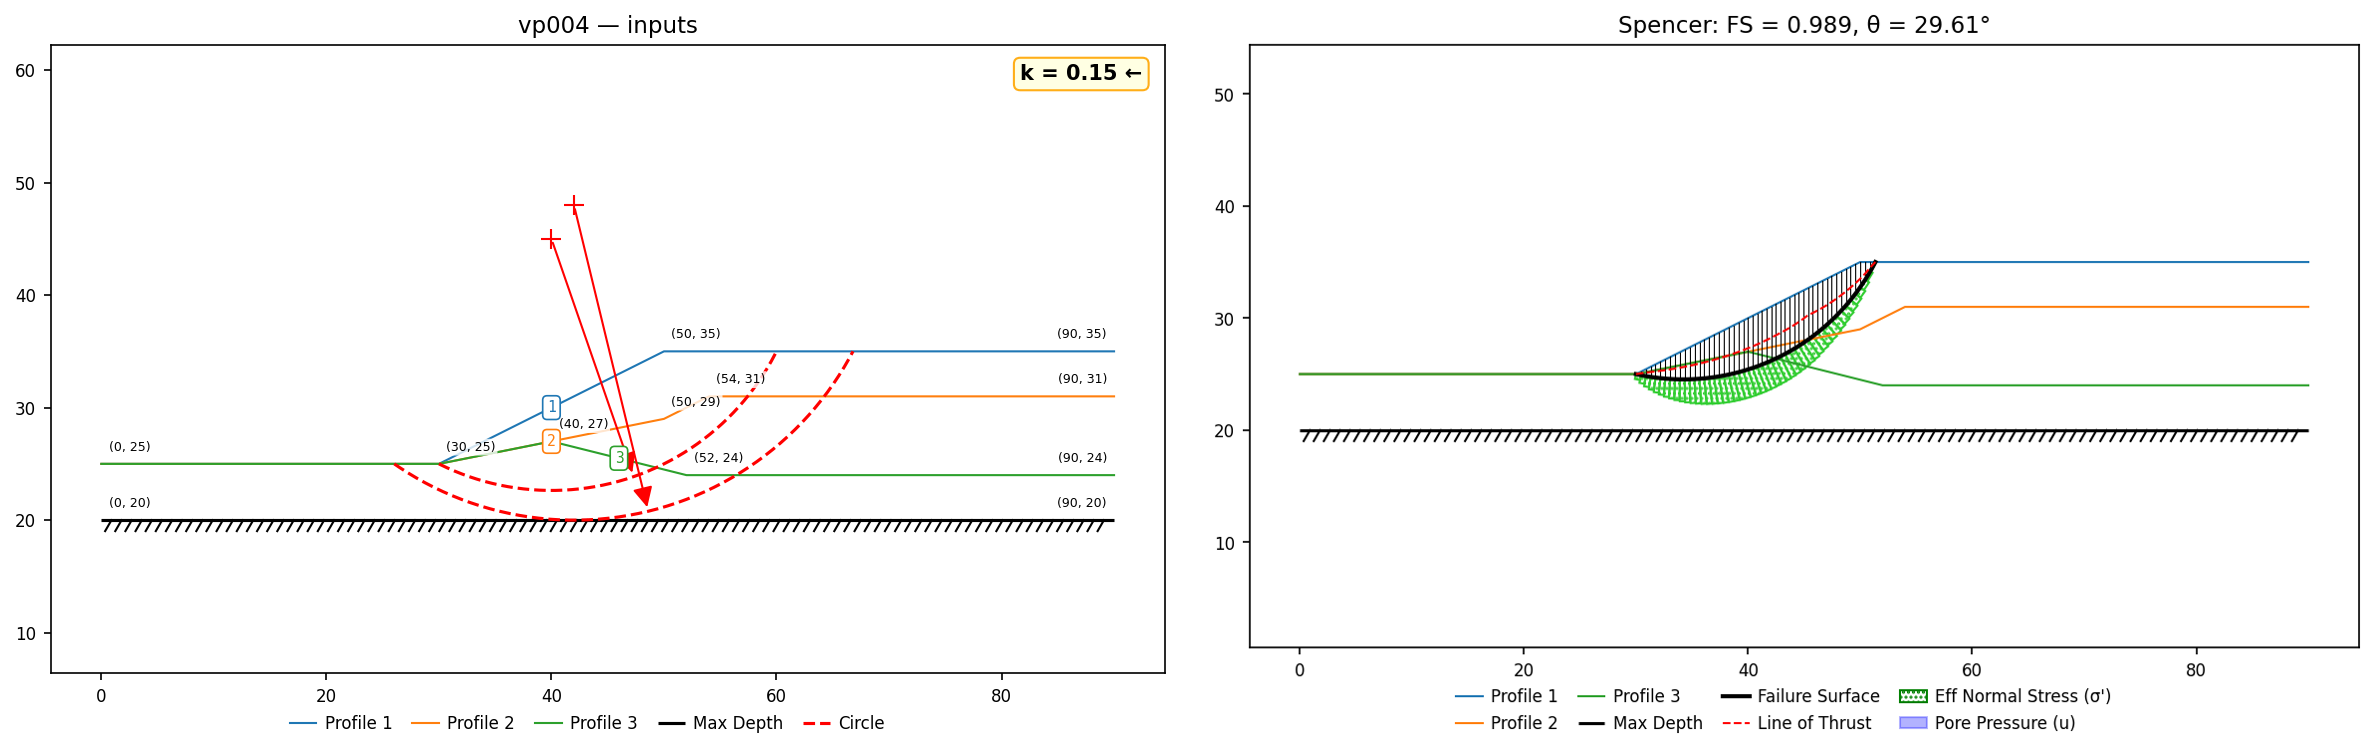
| 4 | Slope, (3) materials, seismic | built | vp004.xlsx. Problem #3 + k=0.15g. Bishop 1.013 / Spencer 0.989 / Janbu(corr) 0.963 / M-P 0.987 vs Slide 1.016 / 0.991 / 0.965 / 0.989 (±0.3%); ACADS reference 1.00. Also SLOPE/W §2.4 — same problem in the GeoStudio corpus. |
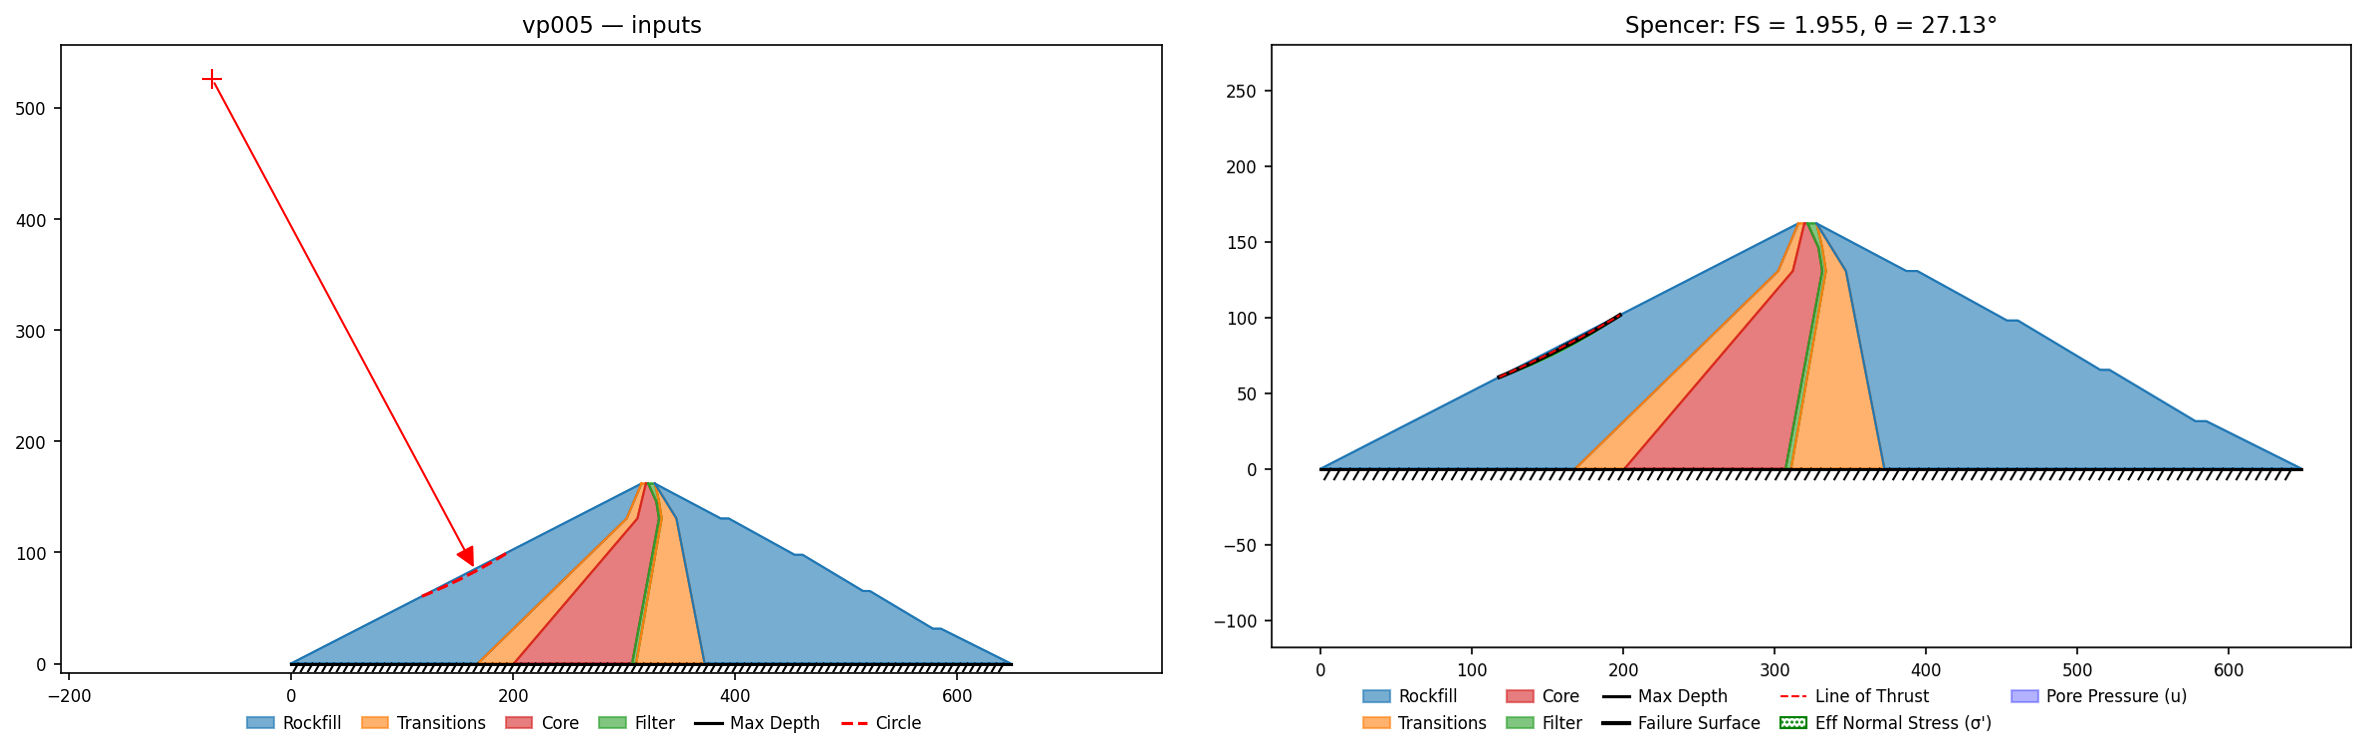
| 5 | Dam, (4) materials | built | vp005.xlsx. ACADS 2(a) Talbingo Dam at end of construction (polygon-zone geometry); the critical mechanism is the infinite-slope limit on the upstream face. Also SLOPE/W §2.5 — same problem in the GeoStudio corpus. |
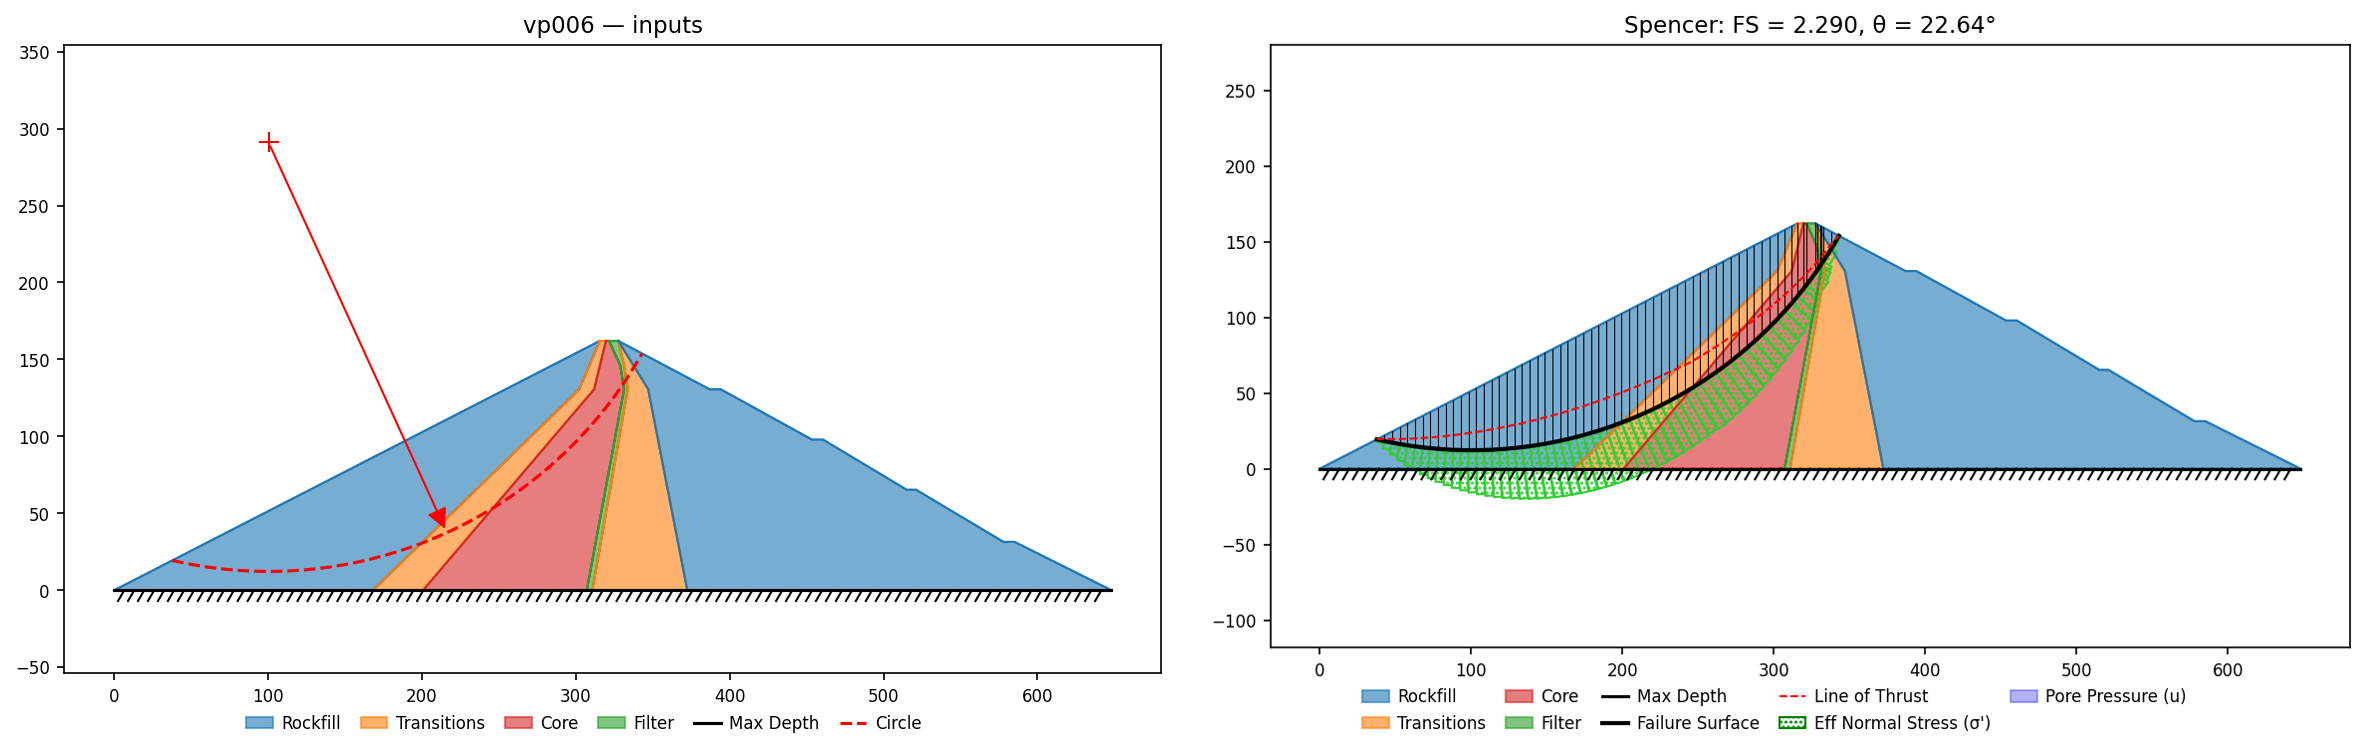
| 6 | Dam, (4) materials, predefined slip surface | built | vp006.xlsx. ACADS 2(b) Talbingo Dam on a specified circle (100.3, 291, R=278.8) through the inclined core. Also SLOPE/W §2.6 — same problem in the GeoStudio corpus. |
| 7 | Slope, (2) materials, weak layer | covered | LEM sample 7 (xslope_acads_weak_layer.xlsx) is this exact problem (ACADS 3(a)). Non-circular search: Spencer 1.258 / M-P 1.248 vs Slide 1.246 / 1.275; Giam reference 1.24-1.27. Also SLOPE/W §2.7 — same problem in the GeoStudio corpus. |
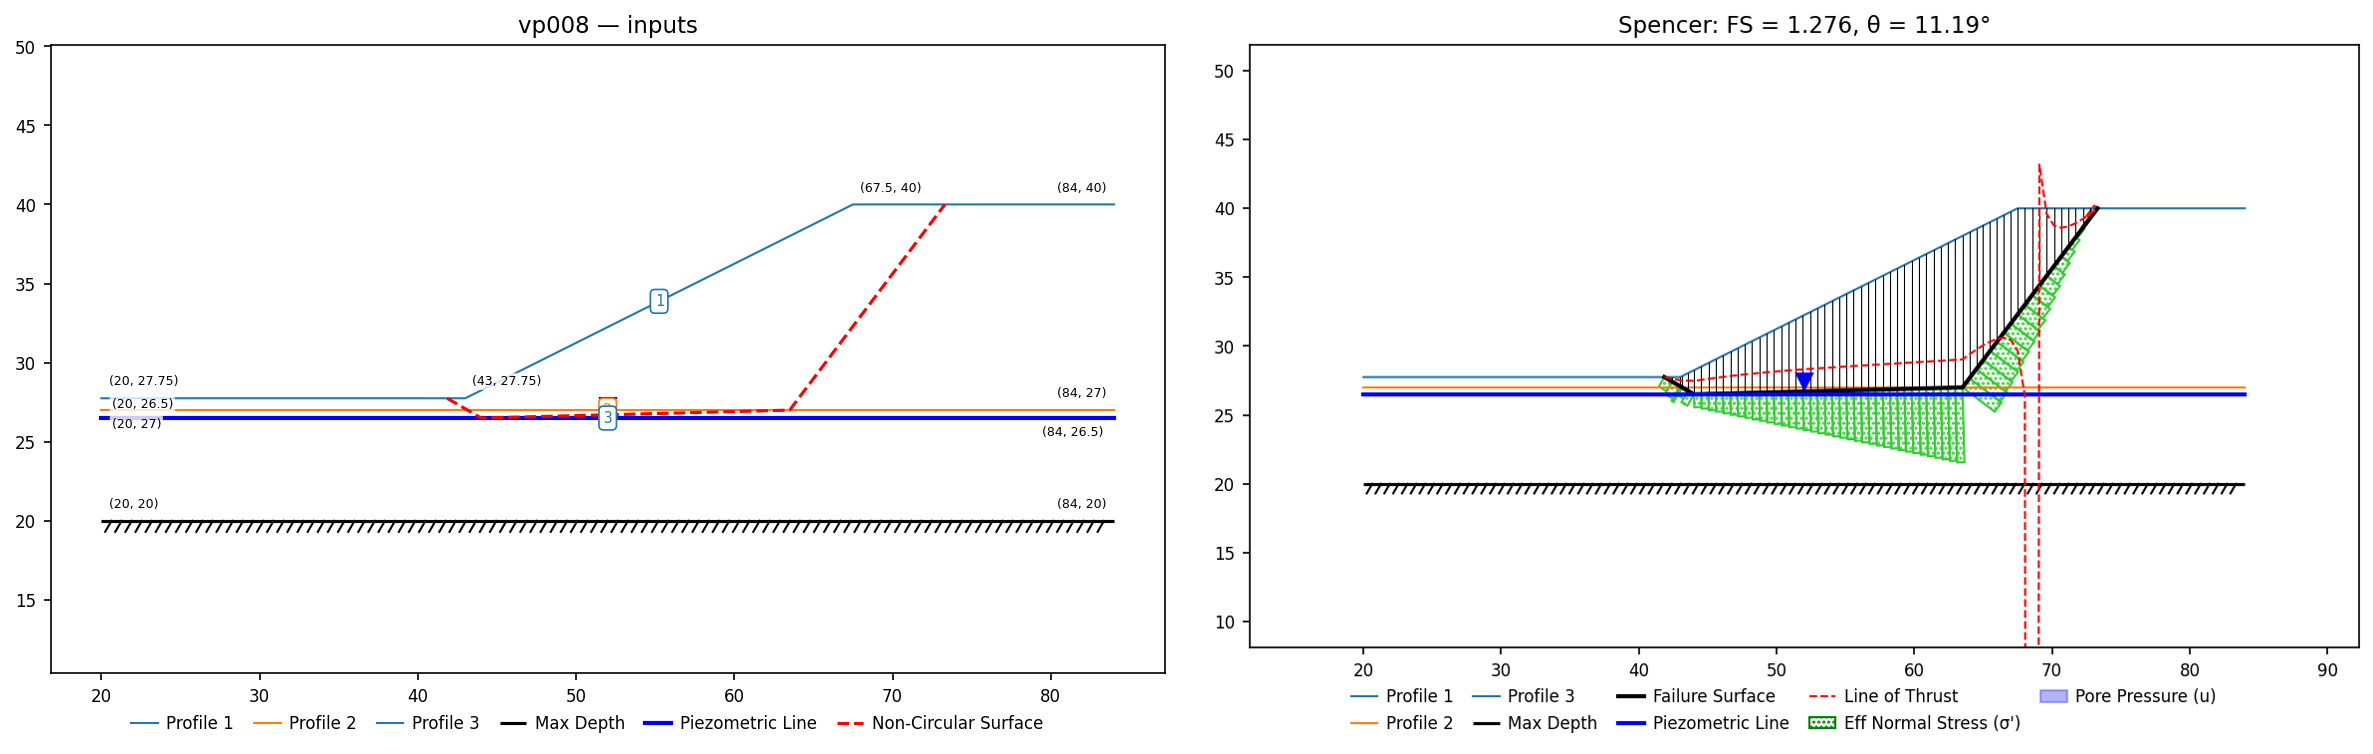
| 8 | Slope, (2) materials, weak layer, predefined slip surface | built | vp008.xlsx. Specified 4-point surface (Table 8.2). Spencer 1.276 / Janbu(corr) 1.294 / M-P 1.260 vs Slide 1.277 / 1.294 / 1.262 (exact to ±0.002); SLOPE/W M-P 1.261; Giam reference 1.34. Also SLOPE/W §2.8 — same problem in the GeoStudio corpus. |
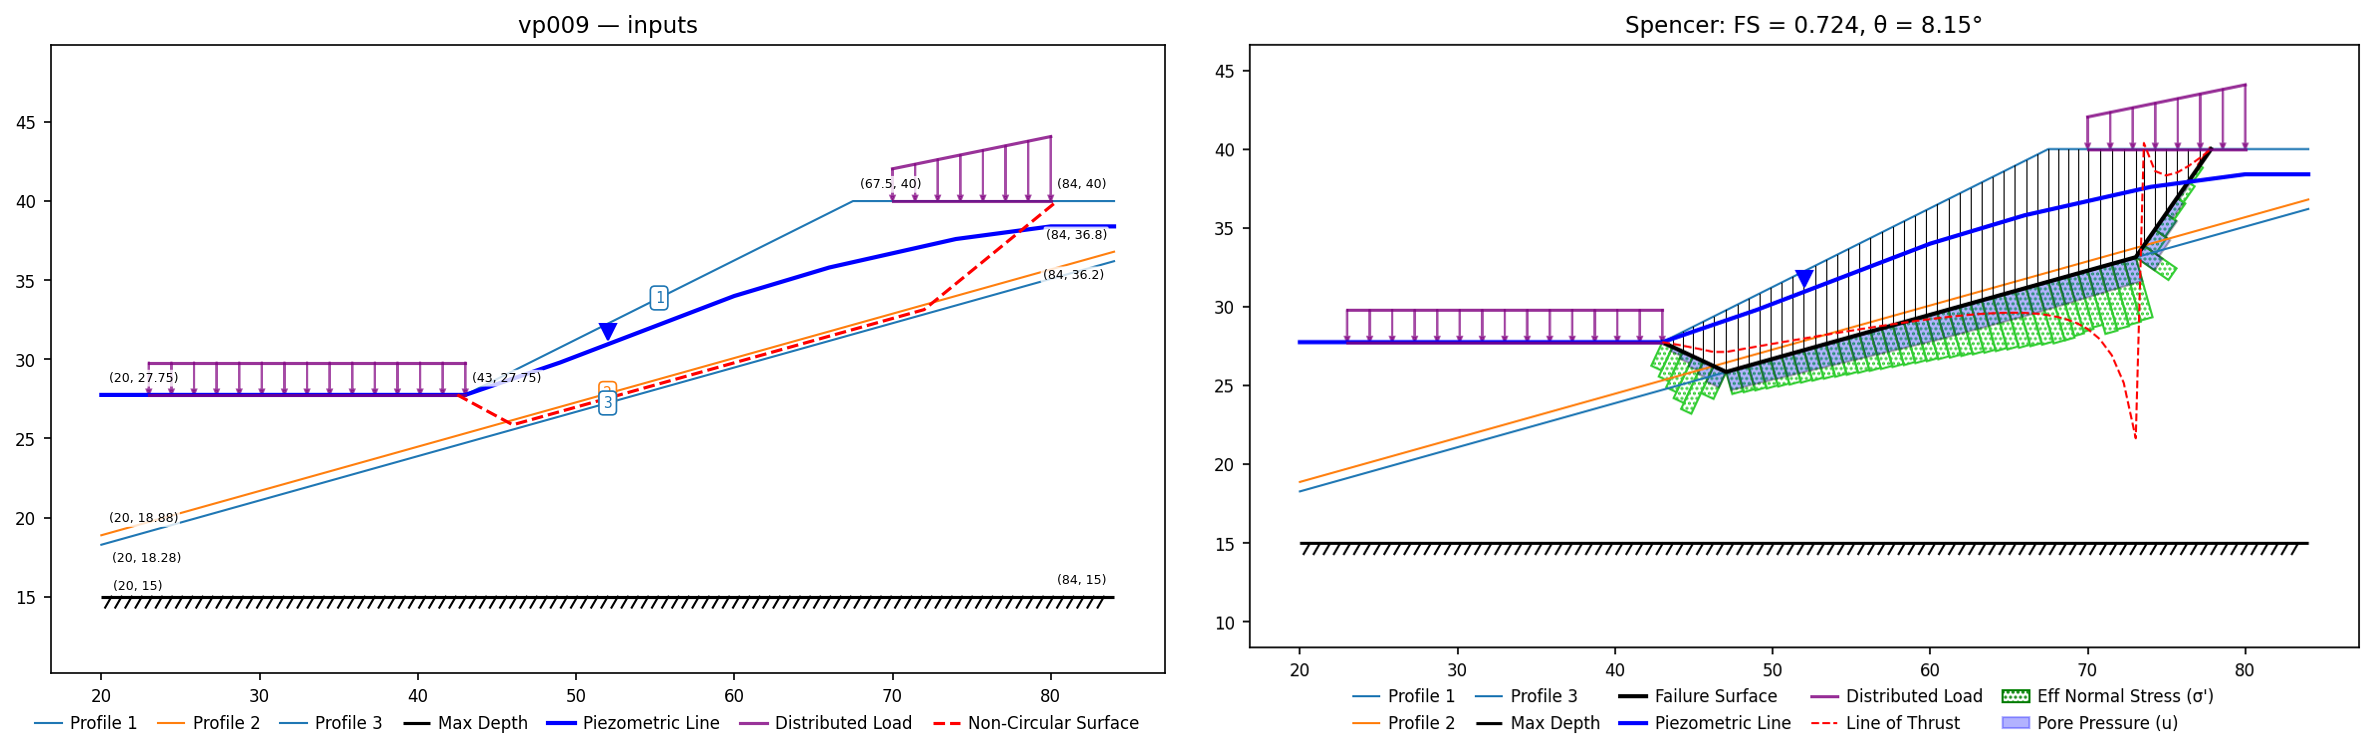
| 9 | Slope, (2) materials, weak layer, water table, distributed load | built | vp009.xlsx. ACADS 4: inclined 0.6 m weak seam (geometry from the labeled GeoStudio figure), 8-point piezometric line, two surcharge strips — a non-circular search-difficulty benchmark with a wide published band. Also SLOPE/W §2.9 — same problem in the GeoStudio corpus. |
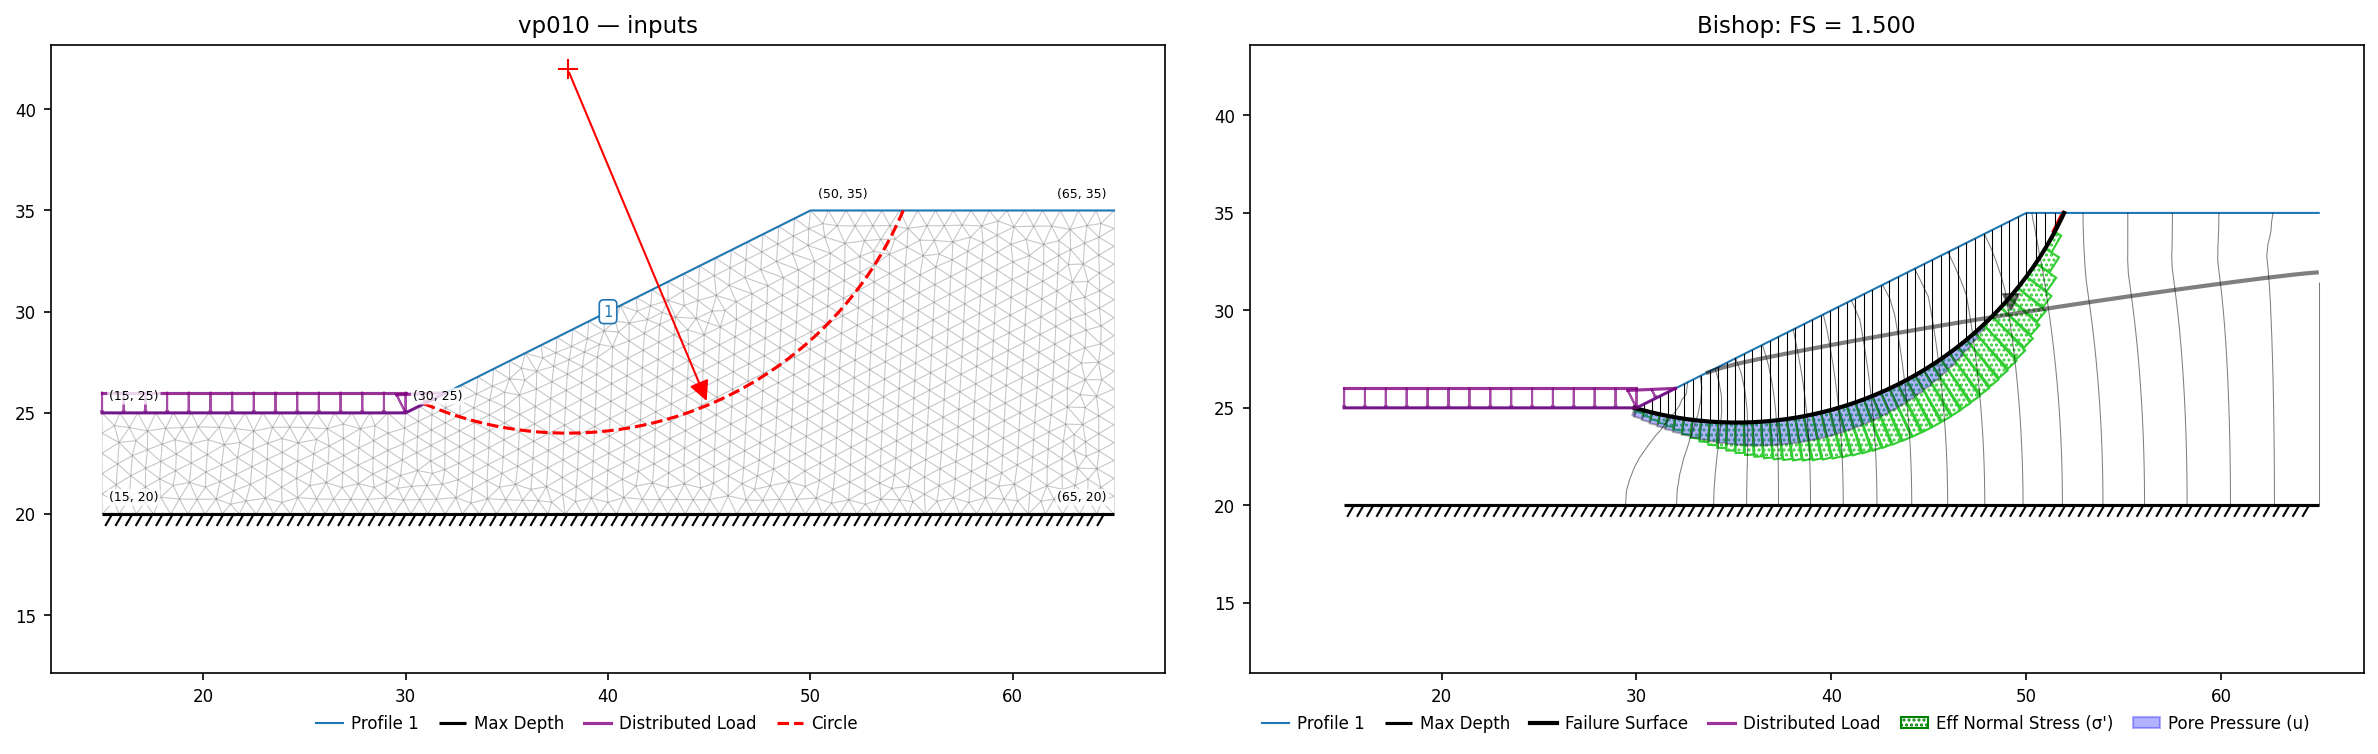
| 10 | Slope, homogenous, pore pressure grid, ponded water | built (via FE seepage) | vp010.xlsx. ACADS #5 excavated slope with ponded water; XSLOPE solves the seepage the manual's pore-pressure grid encodes (k-independent head field, solved phreatic within ~0.1 m of the Fig 10.2 flow net). |
| 11 | Embankment, (2) materials, pore pressure grid | no lock possible | Saint-Alban test embankment (built to failure, Pilot et al. 1982): the grid encodes construction-induced excess pore pressures interpolated from the paper's isobars — there is no seepage problem behind them, so a flow solution cannot reproduce them, and XSLOPE deliberately has no pore-pressure-grid input (water enters as piezometric lines, ru, or FE seepage). |
| 12 | Embankment, (4) materials, tension crack, pore pressure grid | no lock possible | Lanester test embankment: same situation as VP11 — the printed 22-point grid is measured loading-induced pressure, not a flow field. Also SLOPE/W §2.10 — same problem in the GeoStudio corpus. |
| 13 | Embankment, (3) materials, pore pressure grid | no lock possible | Cubzac-les-Ponts test embankment: same situation as VP11/12. |
| 14 | Slope, homogenous | built | xslope_arai_tagyo.xlsx. Arai & Tagyo (1985) ex. 1: seven-method comparison; Bishop 1.404 vs published 1.451. Also SLOPE/W §2.11 — same problem in the GeoStudio corpus. |
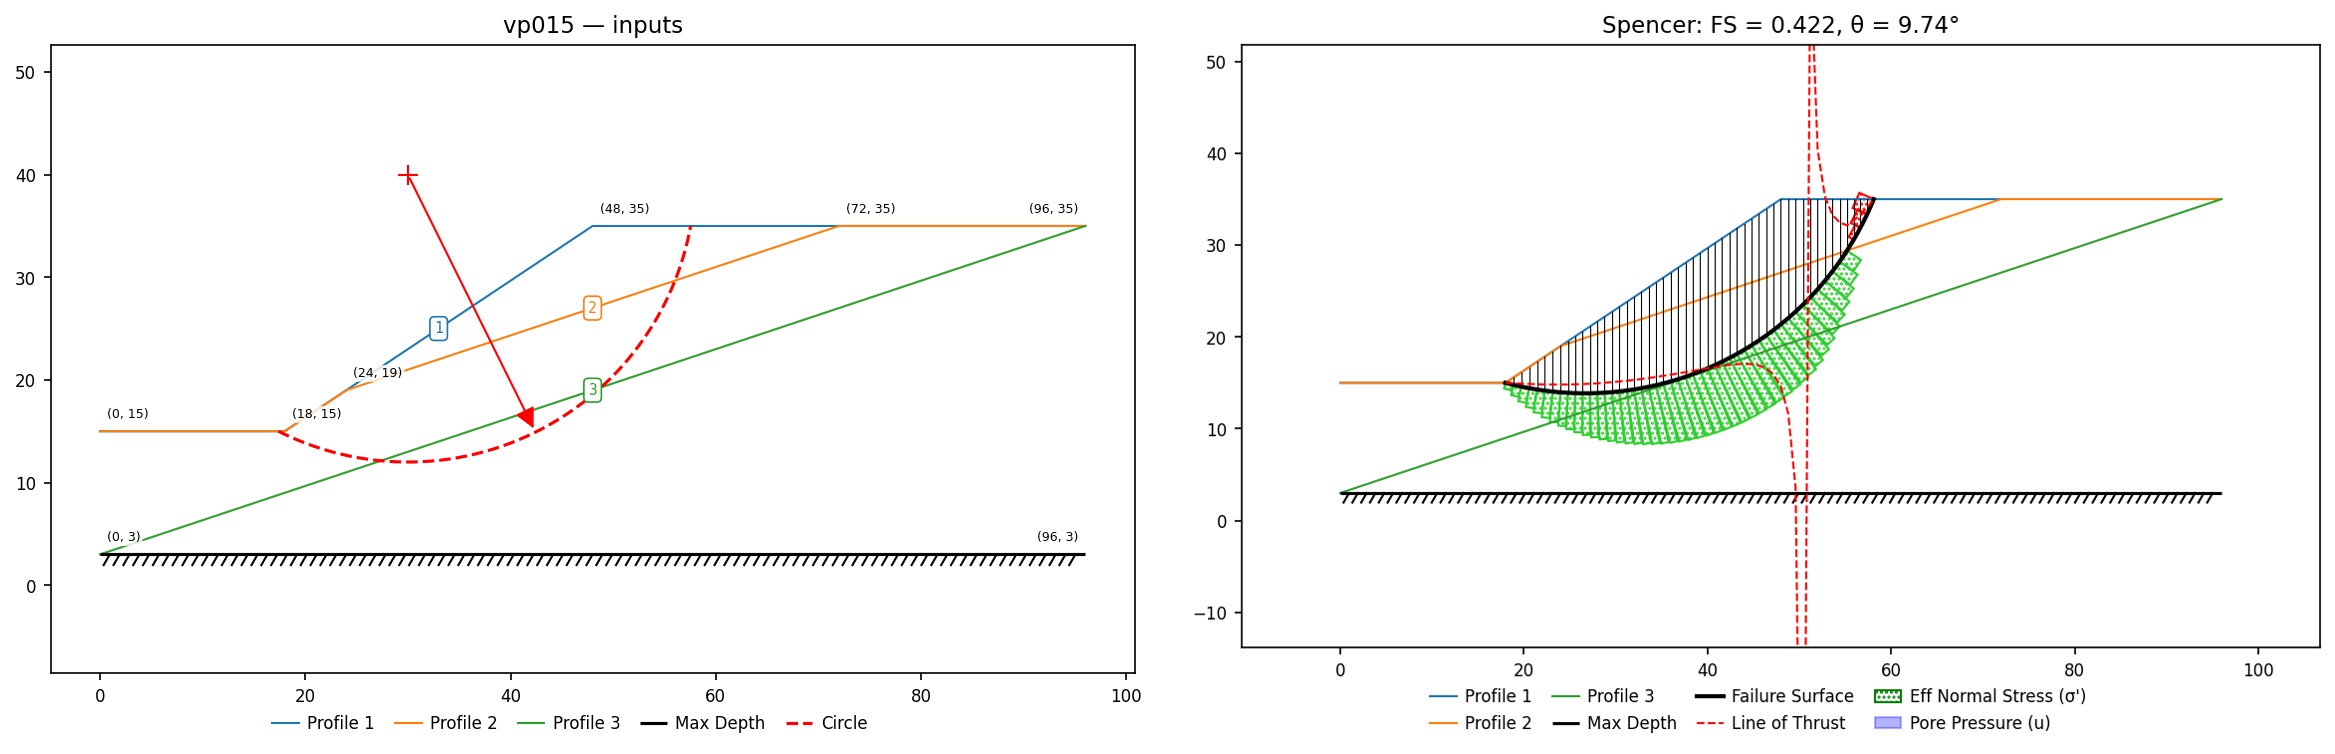
| 15 | Slope, (3) materials, weak layer | built | vp015.xlsx. Arai & Tagyo (1985) ex. 2, weak middle band. Circular search: Bishop 0.419 / Spencer 0.422 / Janbu(corr) 0.436 / M-P 0.420 vs Slide 0.420 / 0.409 / 0.423 / (GLE) 0.437; A&T Bishop 0.417; Kim et al. 0.43. |
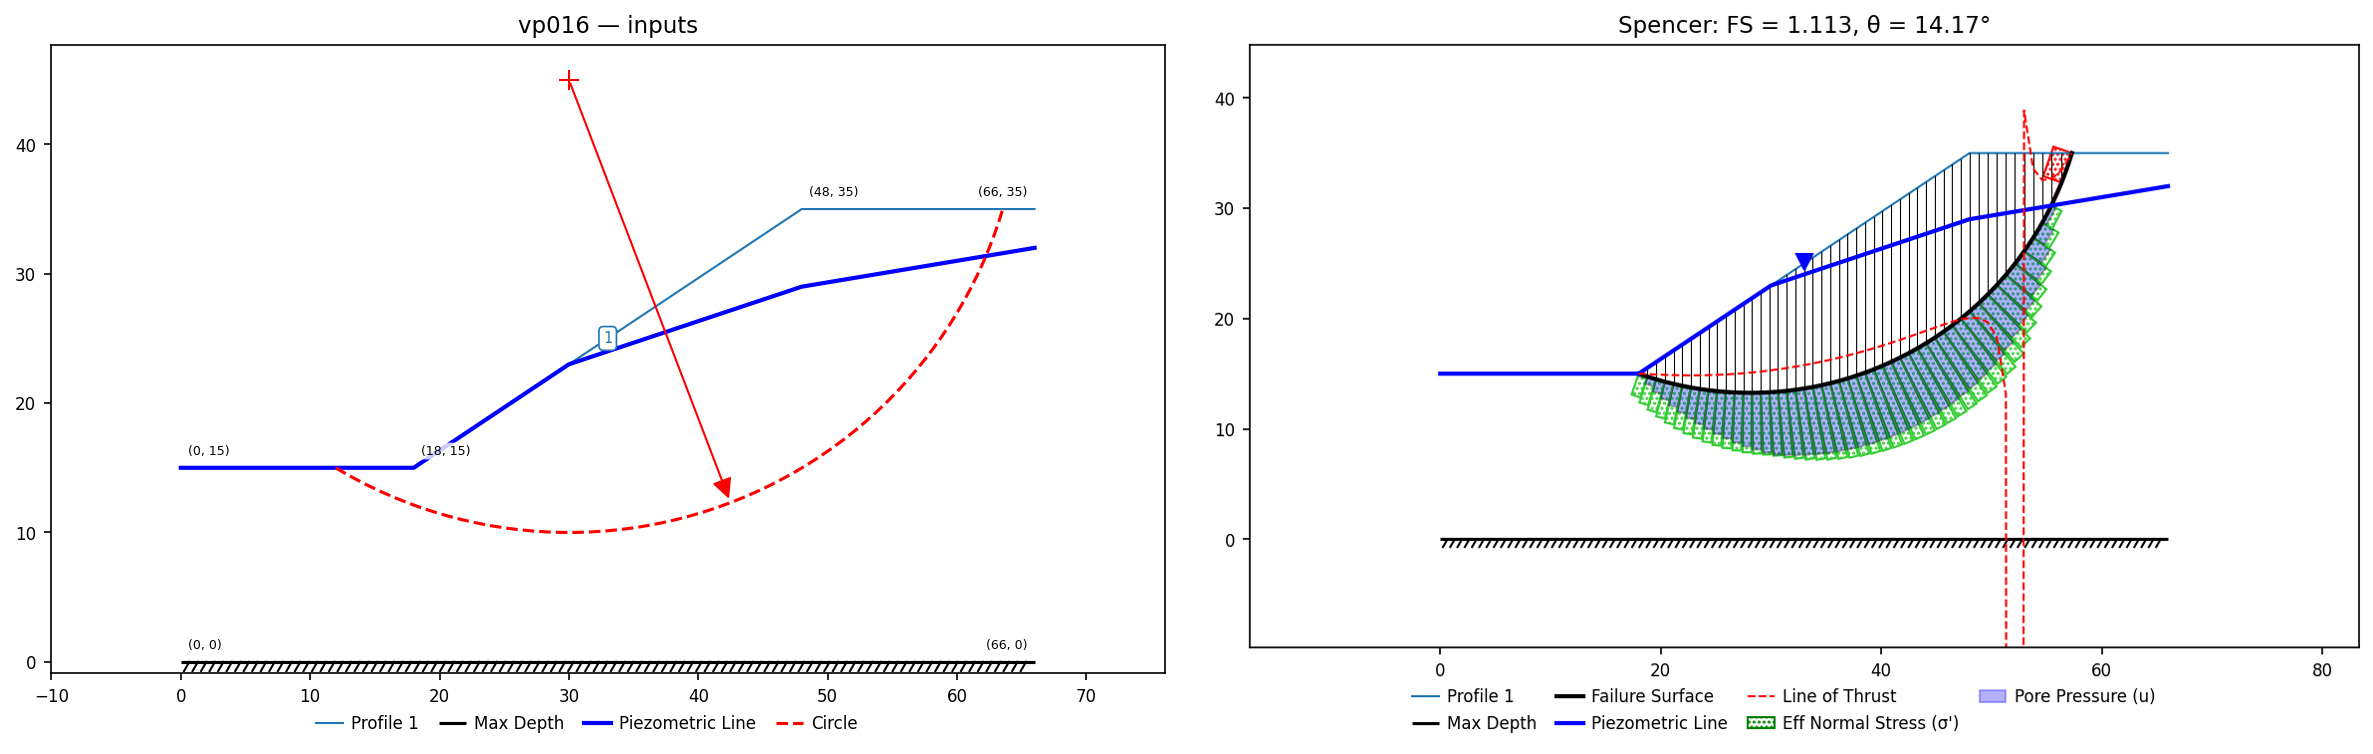
| 16 | Slope, homogenous, water table | built | vp016.xlsx. Arai & Tagyo (1985) ex. 3, piezometric line. Circular search: Bishop 1.112 / Spencer 1.113 / Janbu(corr) 1.122 / M-P 1.111 vs Slide 1.118 / 1.118 / 1.131; A&T Bishop 1.138. Also SLOPE/W §2.12 — same problem in the GeoStudio corpus. |
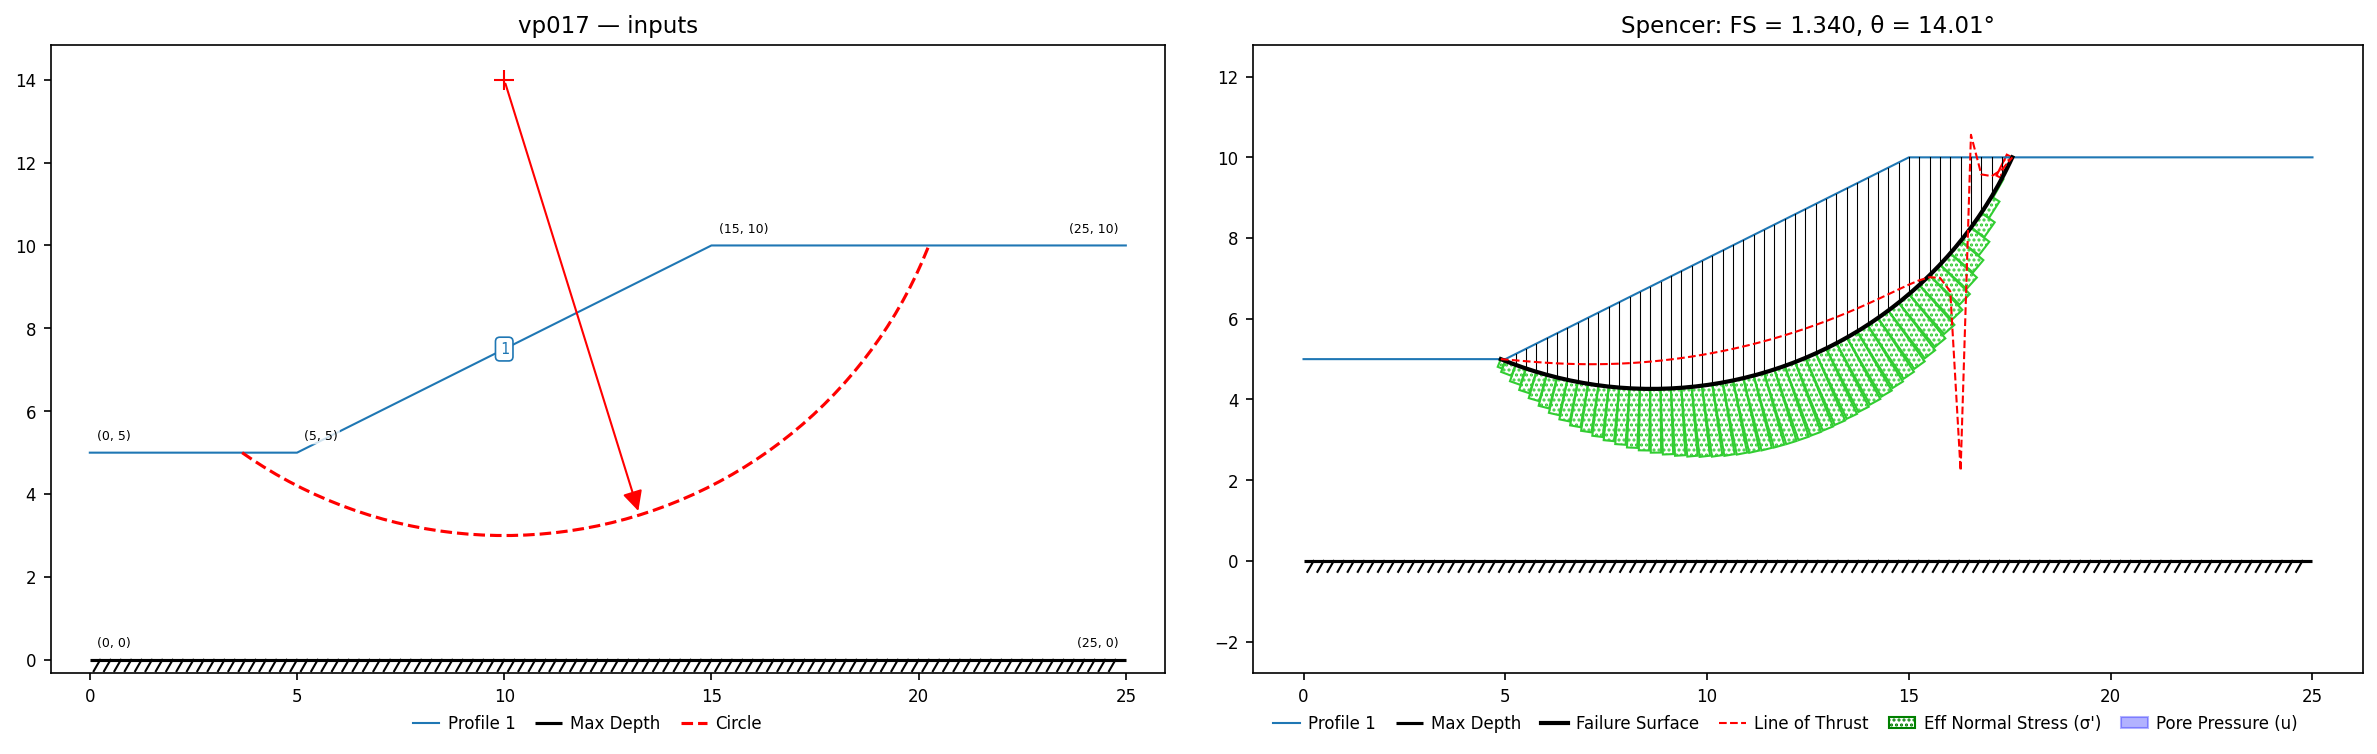
| 17 | Slope, homogenous | built | vp017.xlsx. Yamagami & Ueta (1988) homogeneous slope, circular search (the local non-circular search hits the same search-power ceiling as #19/#20). |
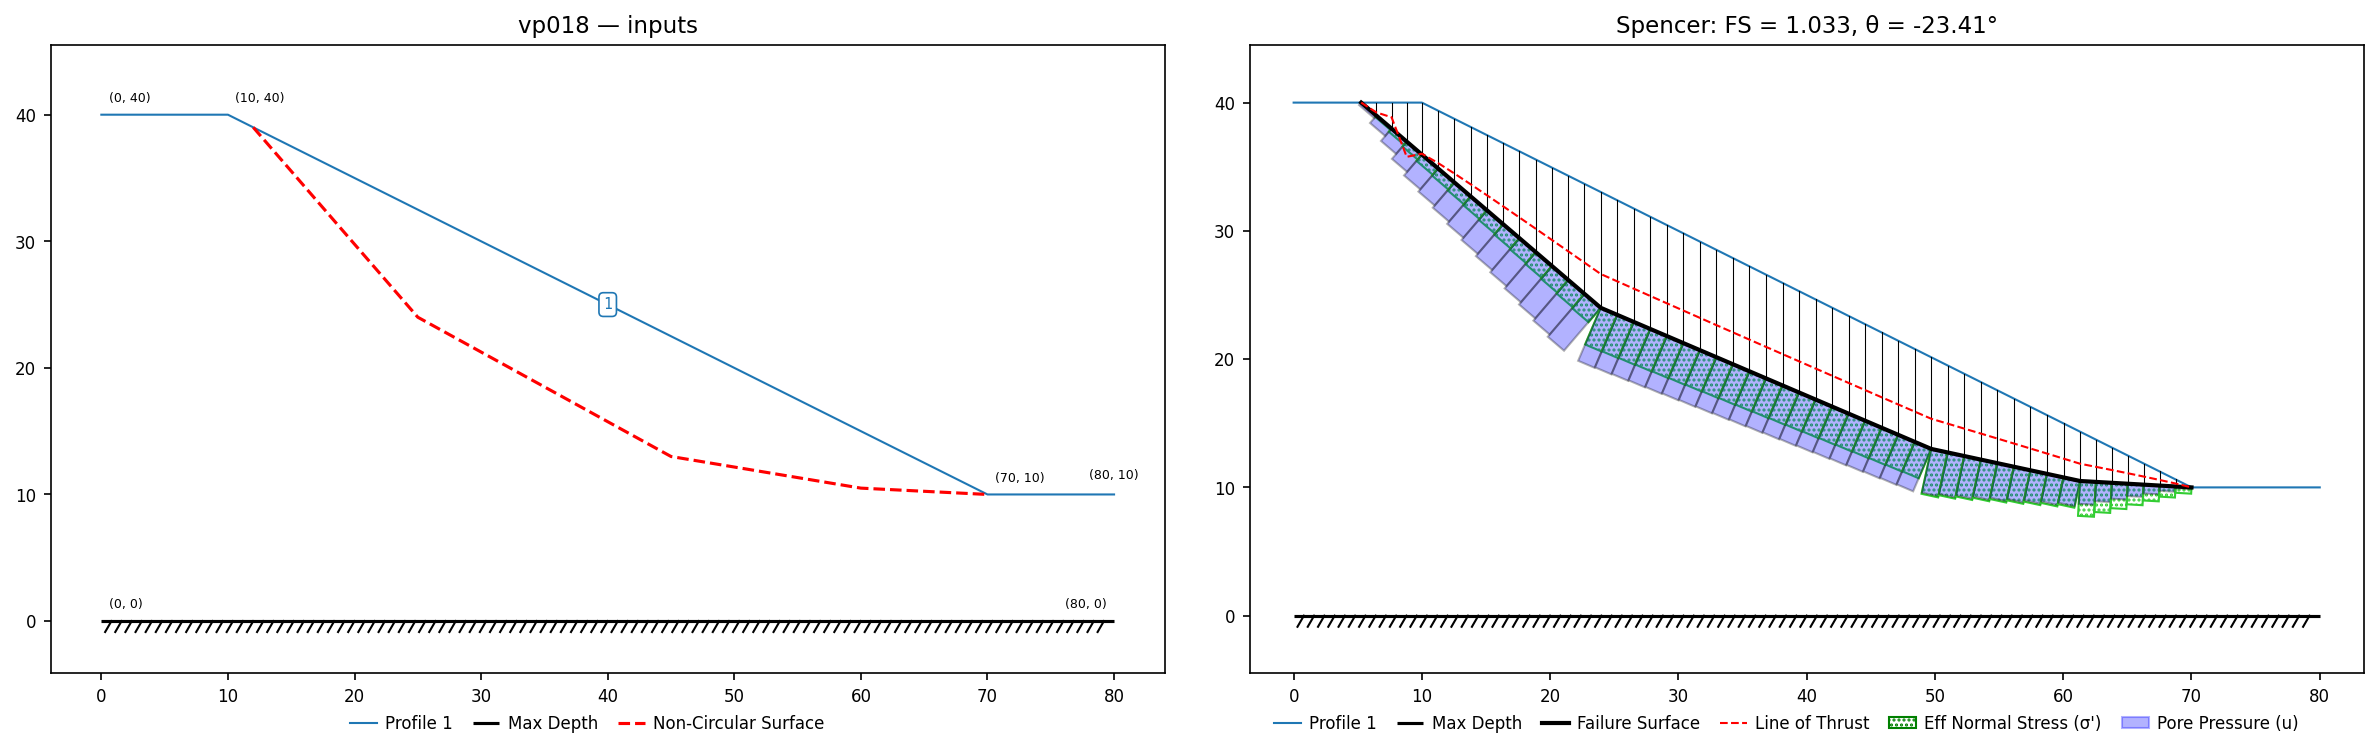
| 18 | Slope, homogenous slope, ru pore pressure | built | vp018.xlsx. Spencer (1969)/Baker (1980) slope, ru=0.5, non-circular search (right-facing). Spencer 1.033 / M-P 1.024 vs Slide 1.010 (random search + Monte-Carlo optimization), Baker 1.02, Spencer (1969) 1.08. |
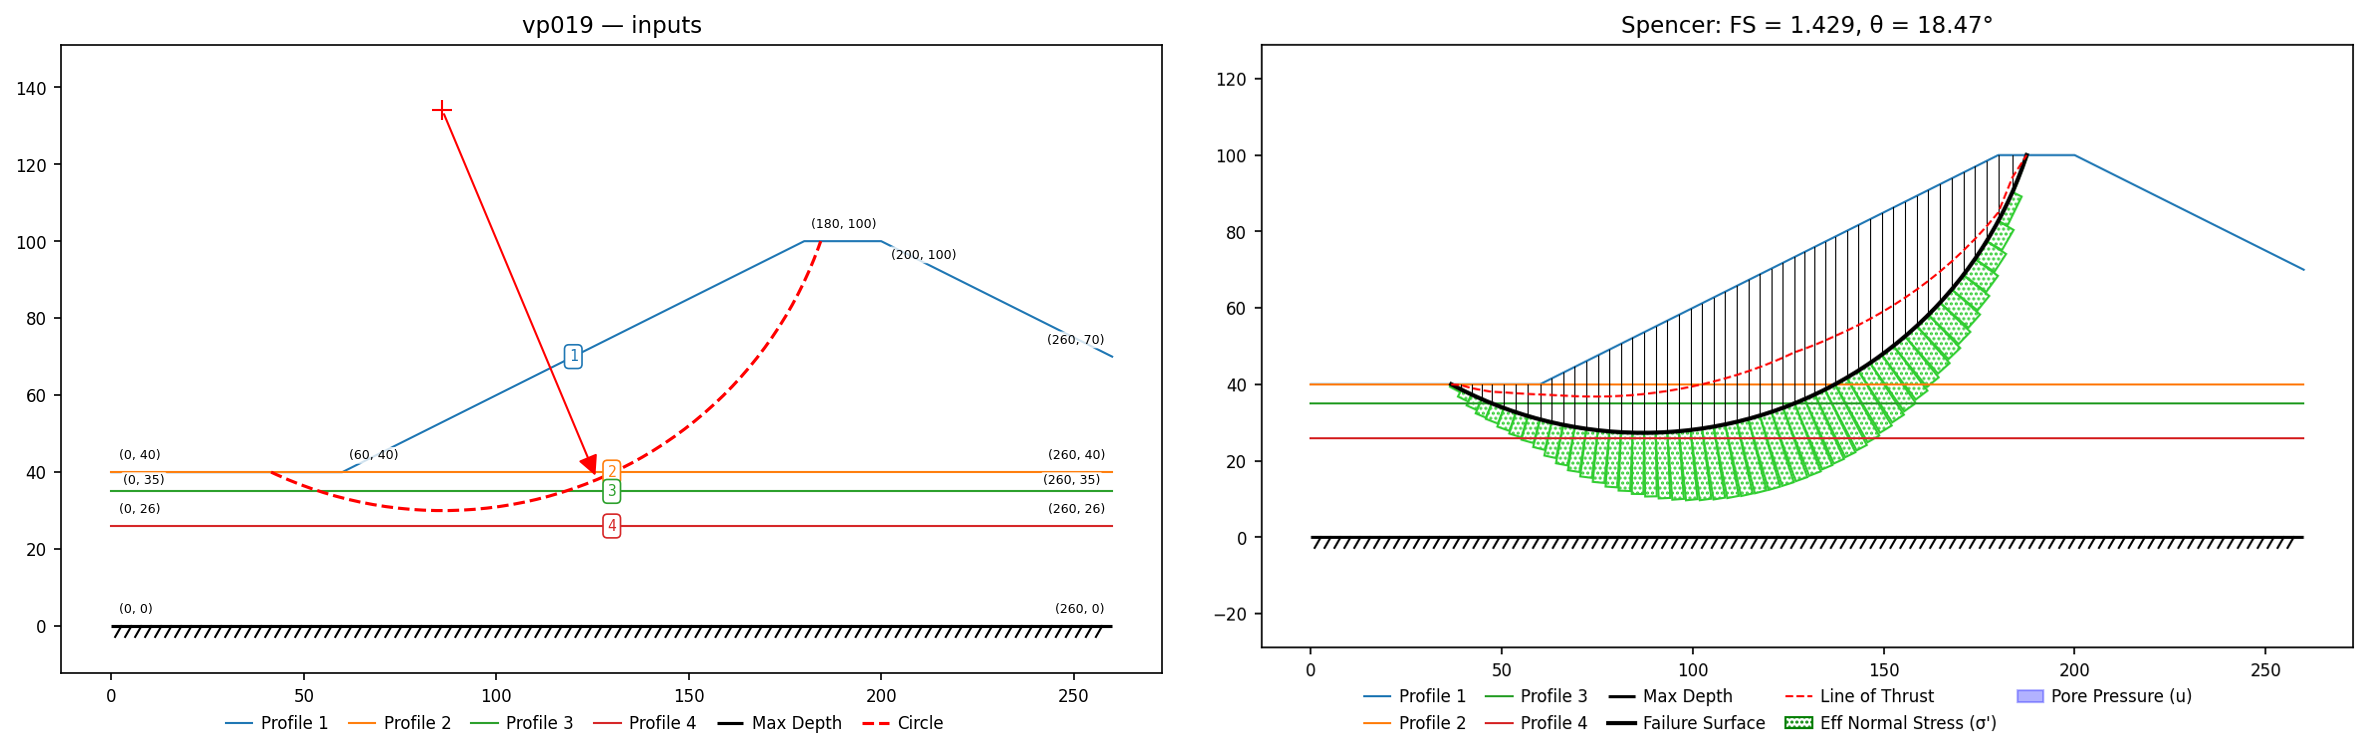
| 19 | Slope, (4) materials | built | vp019.xlsx. Greco (1996) ex. 4 / Yamagami & Ueta (1988) four-layer slope; circular search, with a documented non-circular search-power gap. Also SLOPE/W §2.13 — same problem in the GeoStudio corpus. |
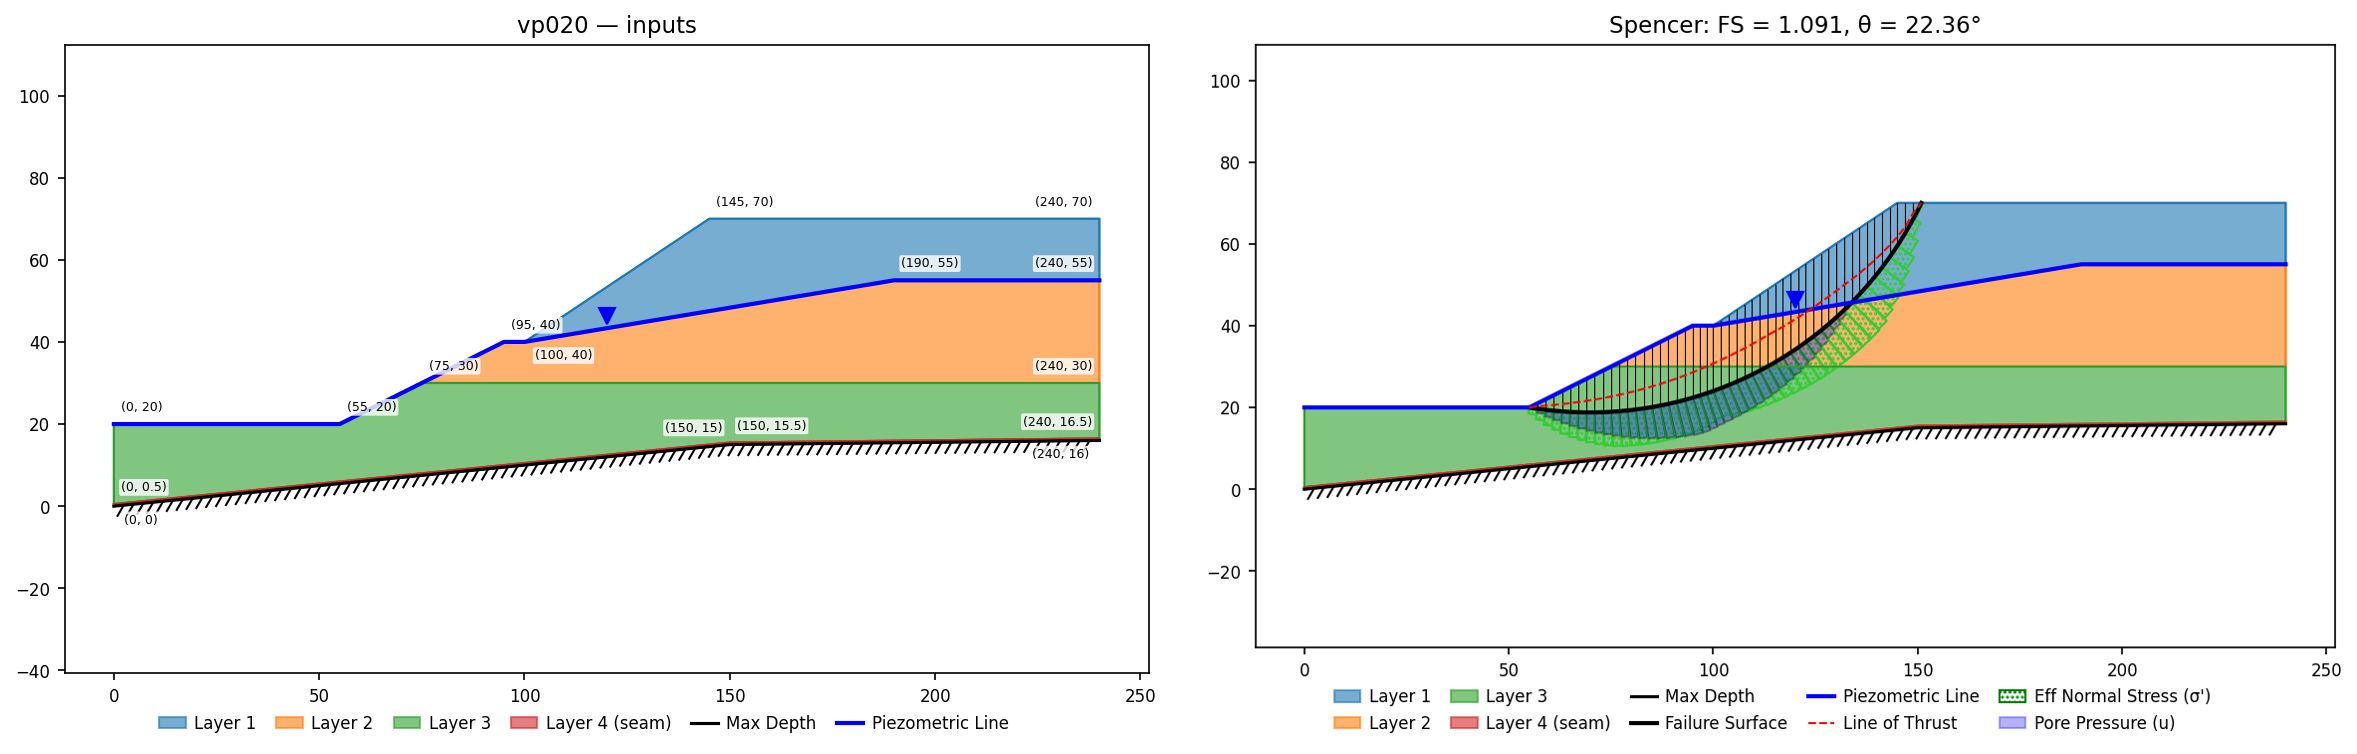
| 20 | Slope, (4) materials, weak layer, water table | built | vp020.xlsx. Greco (1996) ex. 5 / Chen & Shao (1988): a 0.5 m weak seam along the inclined base (polygon zones) with a water table; same search-power gap as #19. Also SLOPE/W §2.14 — same problem in the GeoStudio corpus. |
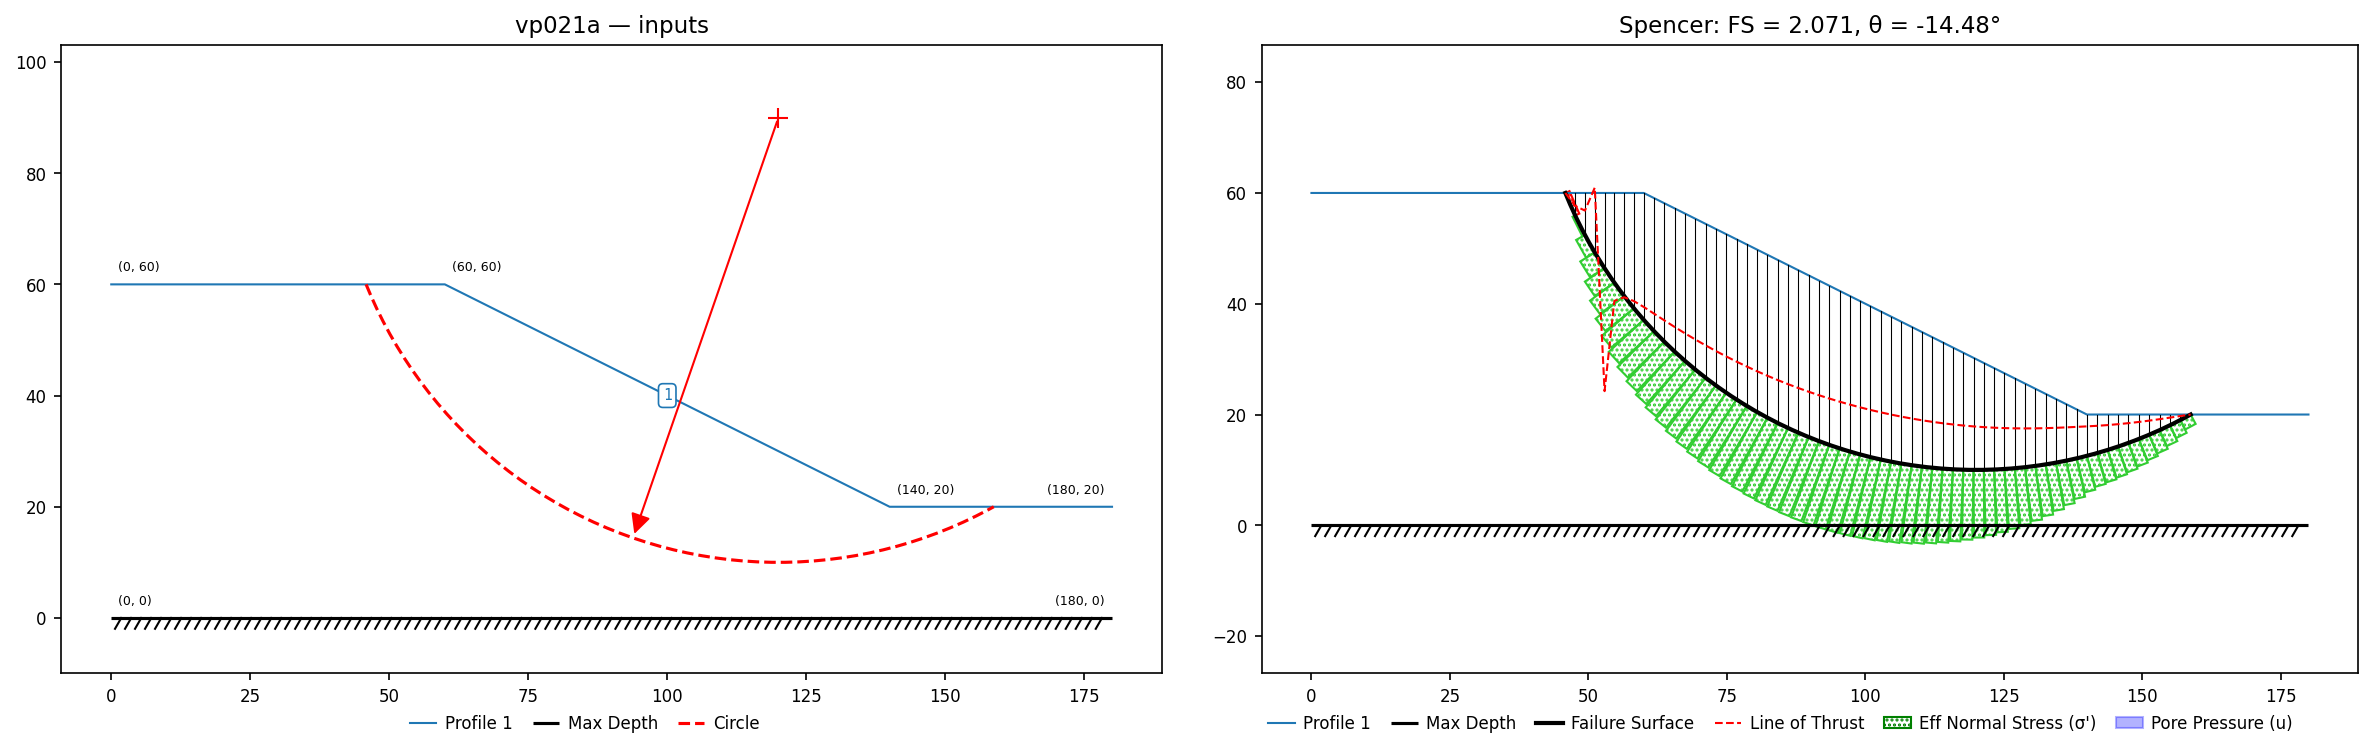
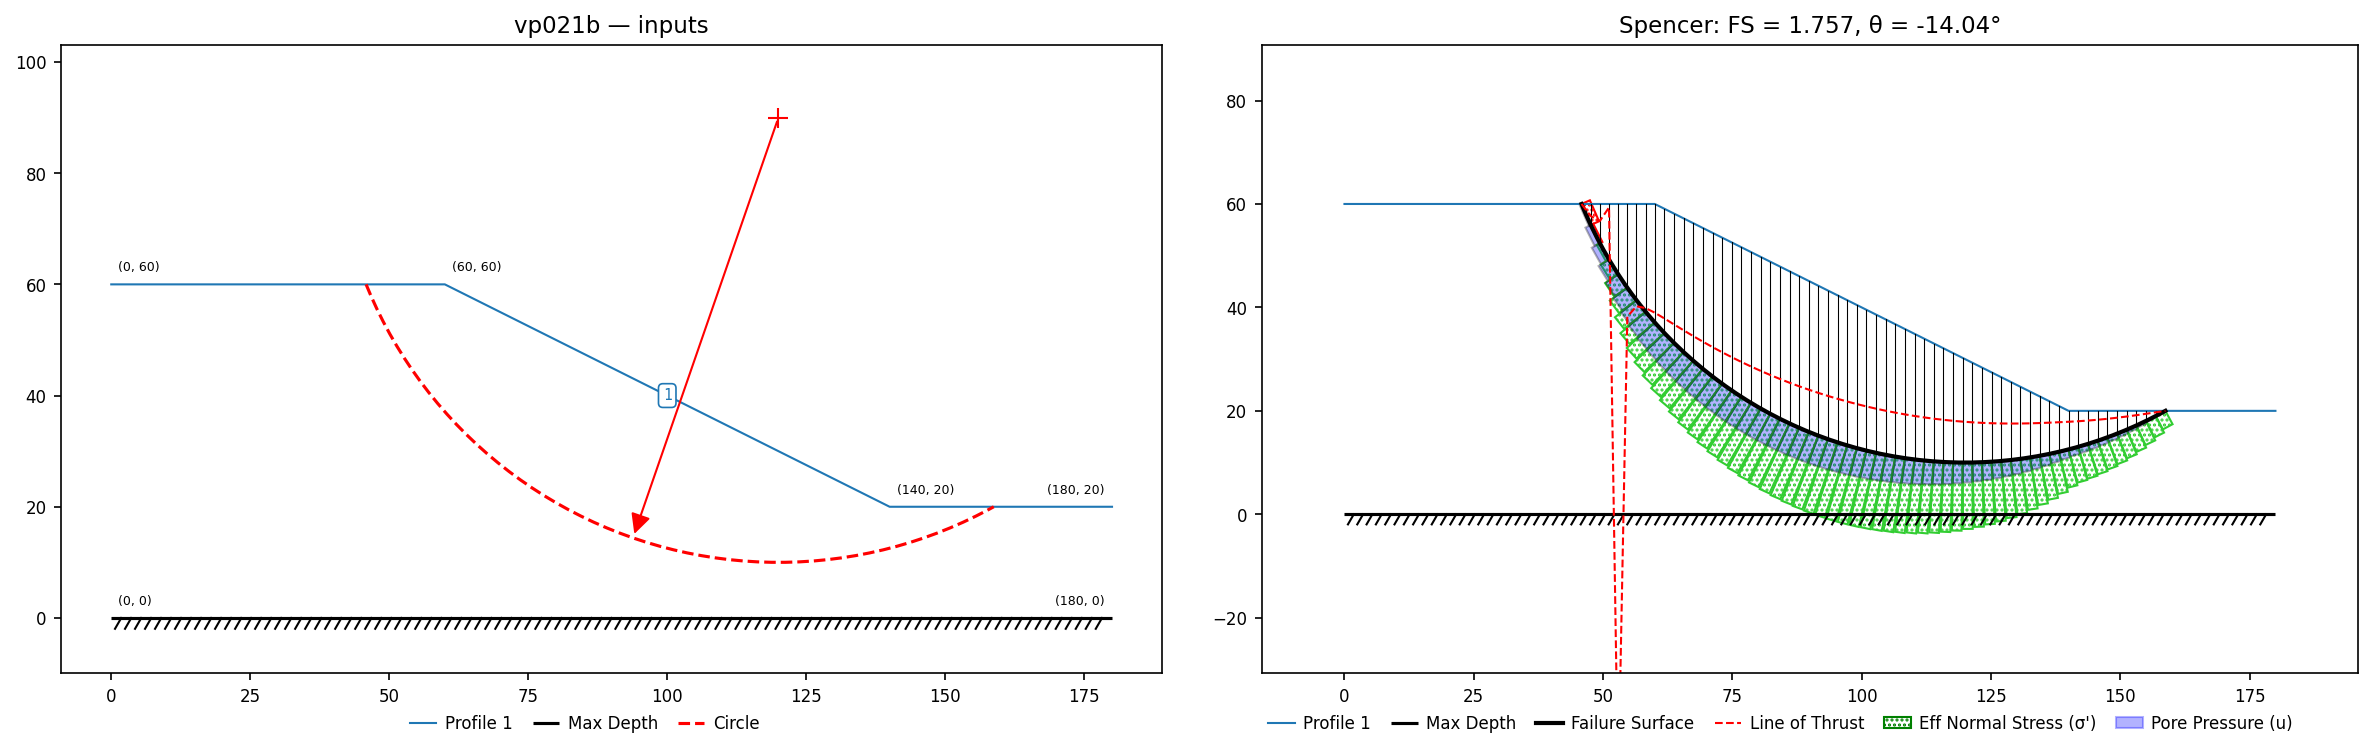
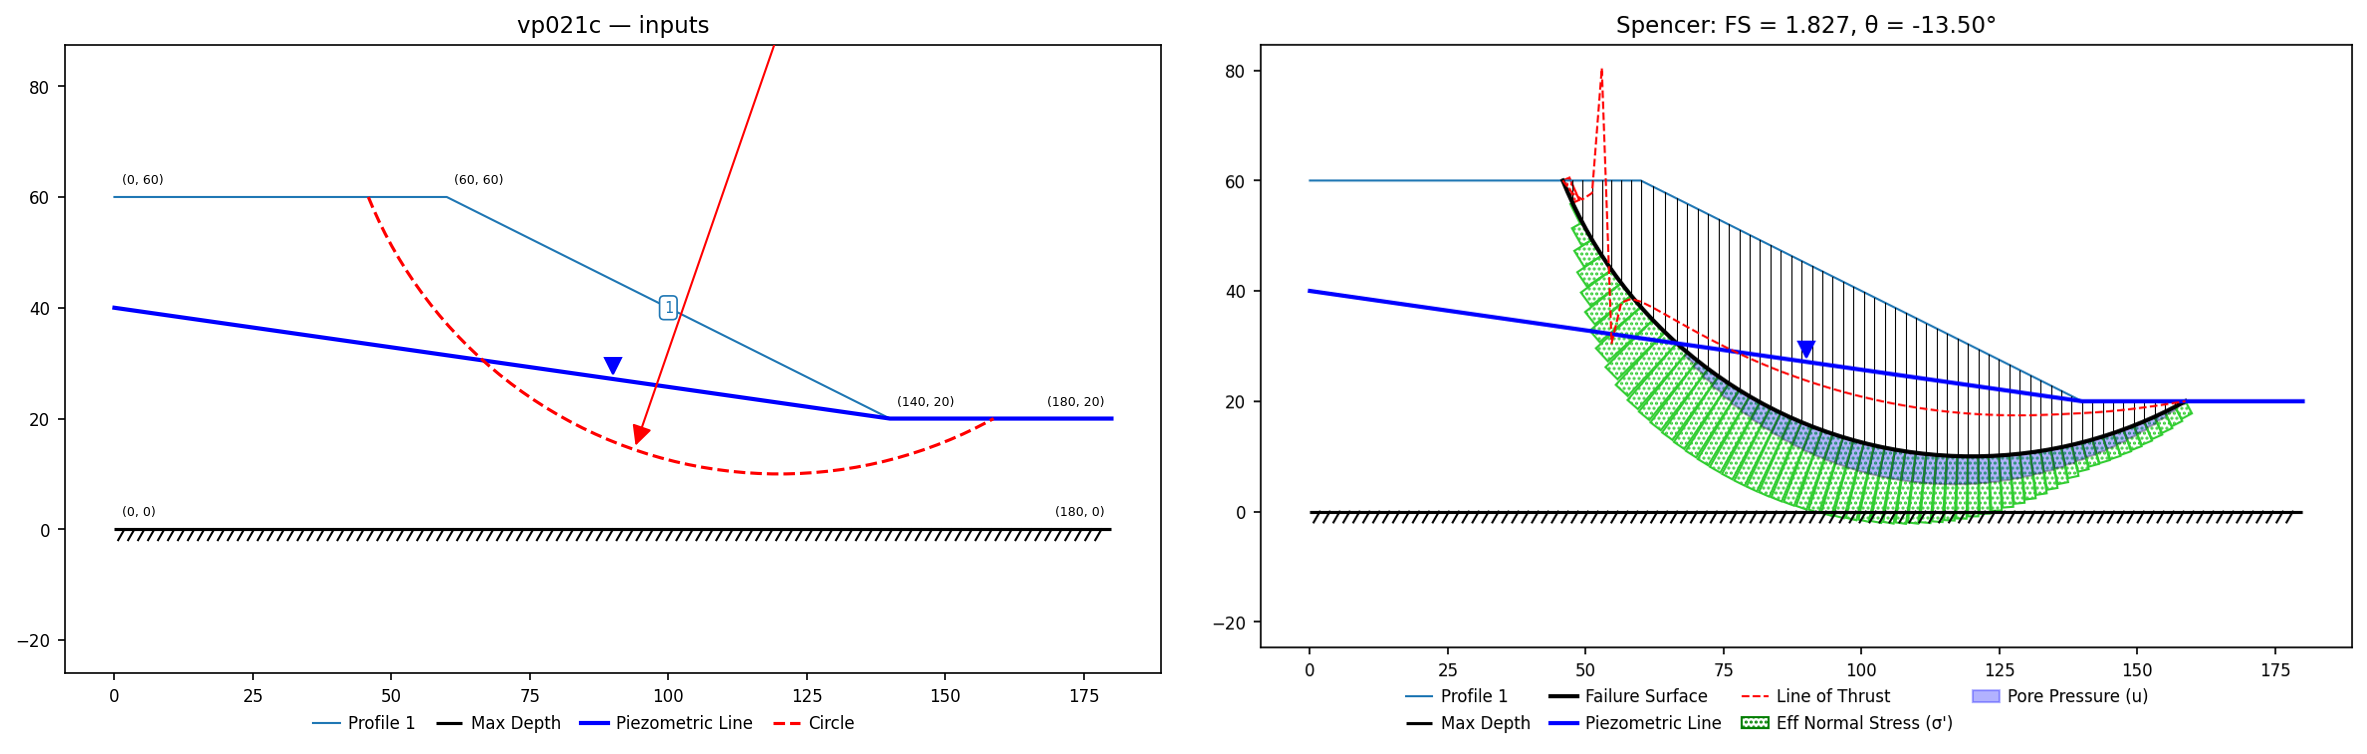
| 21 | Slope, homogenous, ru pore pressure | built | vp021a.xlsx (dry) / vp021b.xlsx (ru=0.25) / vp021c.xlsx (water table). Fredlund & Krahn (1977) classic homogeneous slope, fixed circle (120, 90, R=80), imperial units. All three F&K pore-pressure cases; the case-3 phreatic line (0,40)-(140,20)-(180,20) is read from the vendor Slide2 model. |
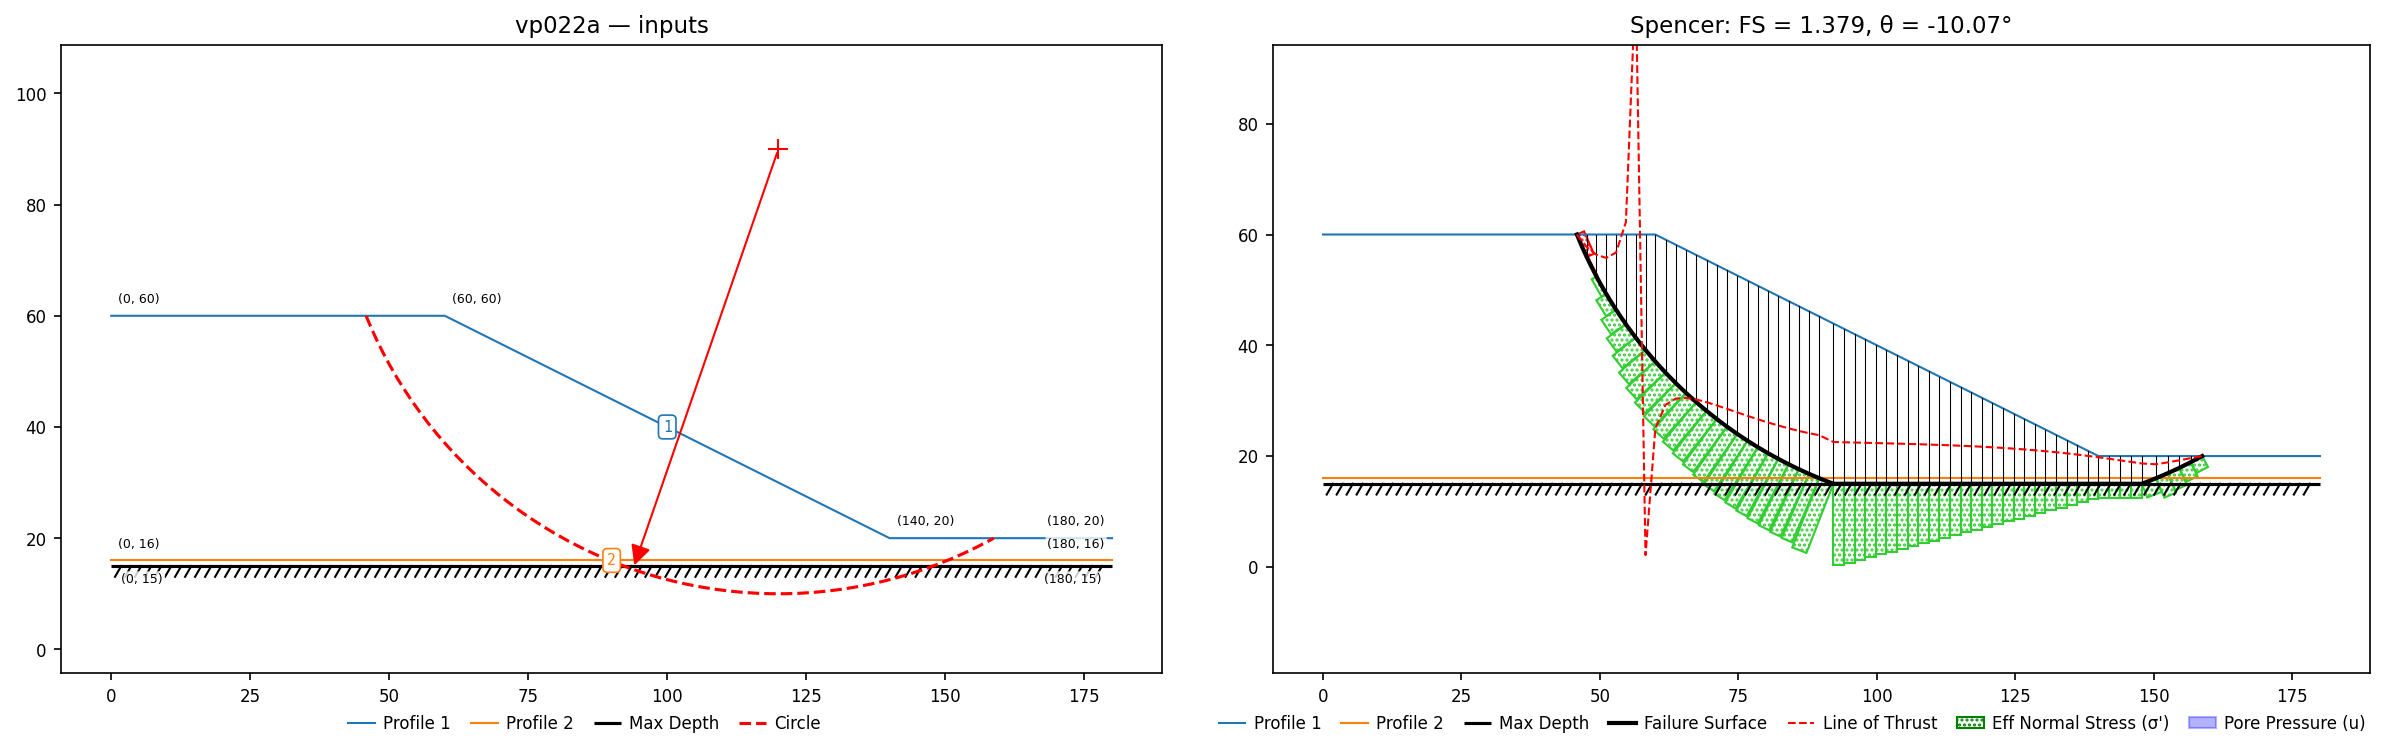
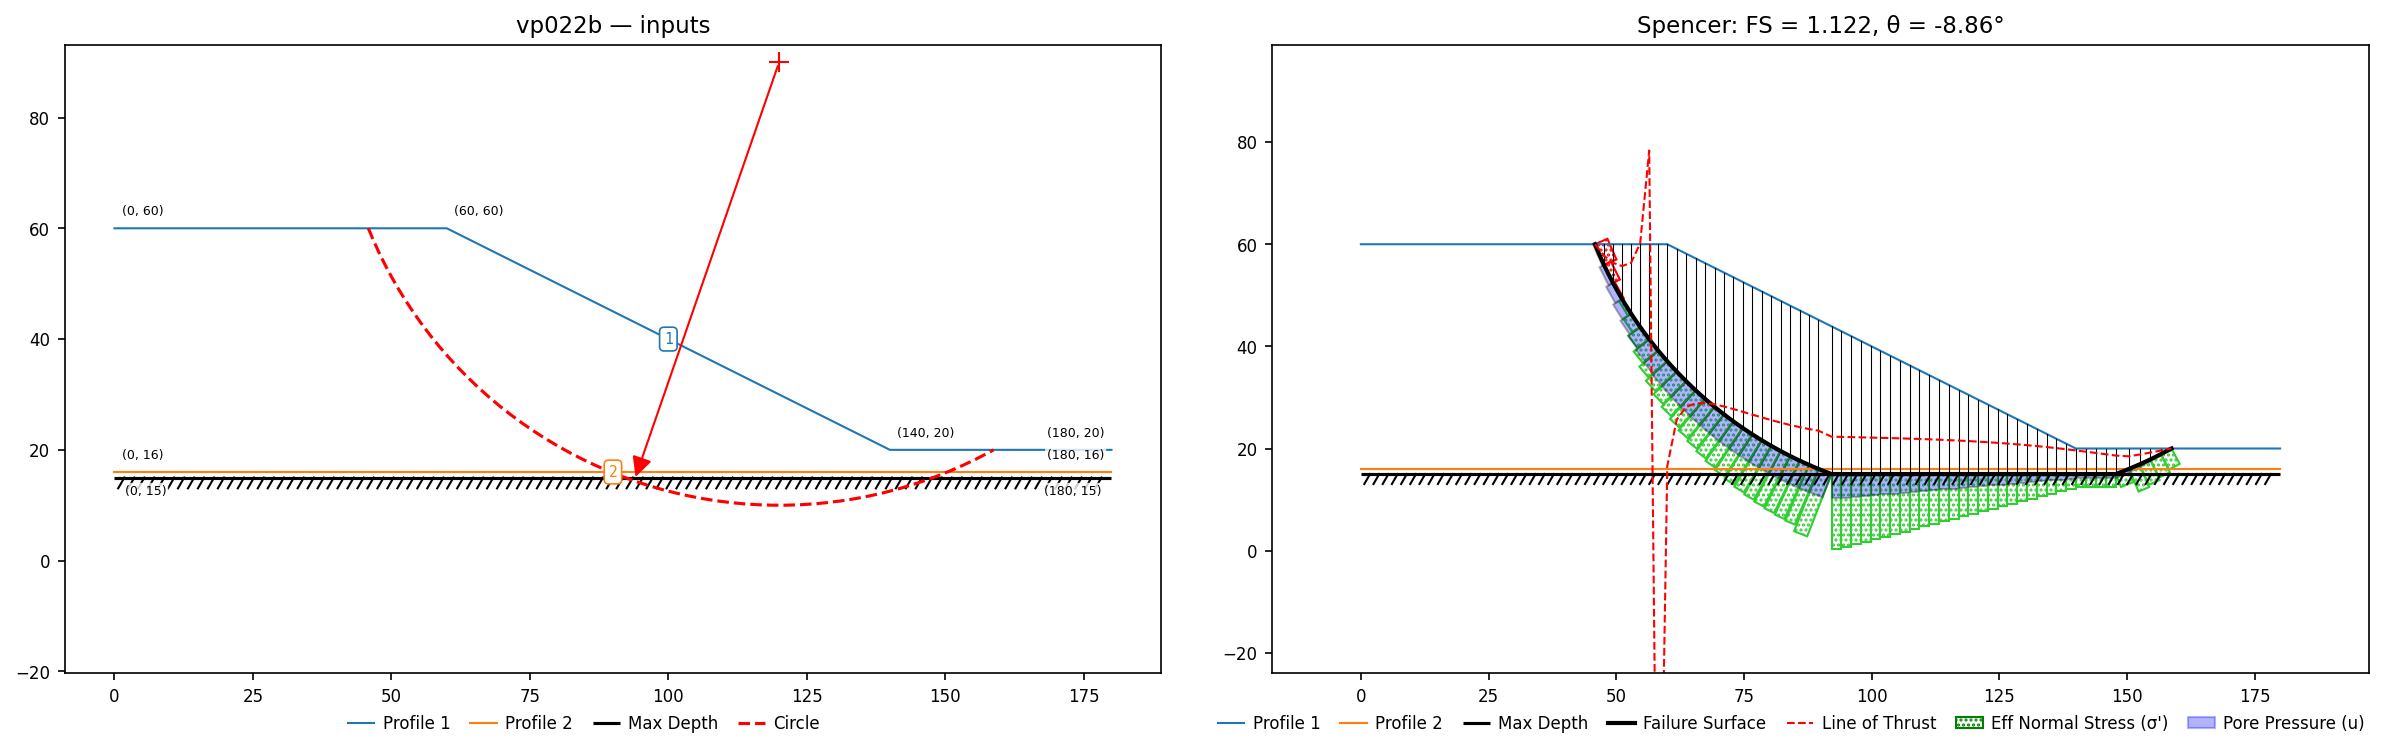
| 22 | Slope, (2) materials, weak layer, ru pore pressure | built | vp022a.xlsx (dry) / vp022b.xlsx (ru=0.25). The Fredlund & Krahn (1977) slope of #21 with a weak seam — the corpus's first composite-surface problem (F&K's circle truncates on the base and runs along the seam). |
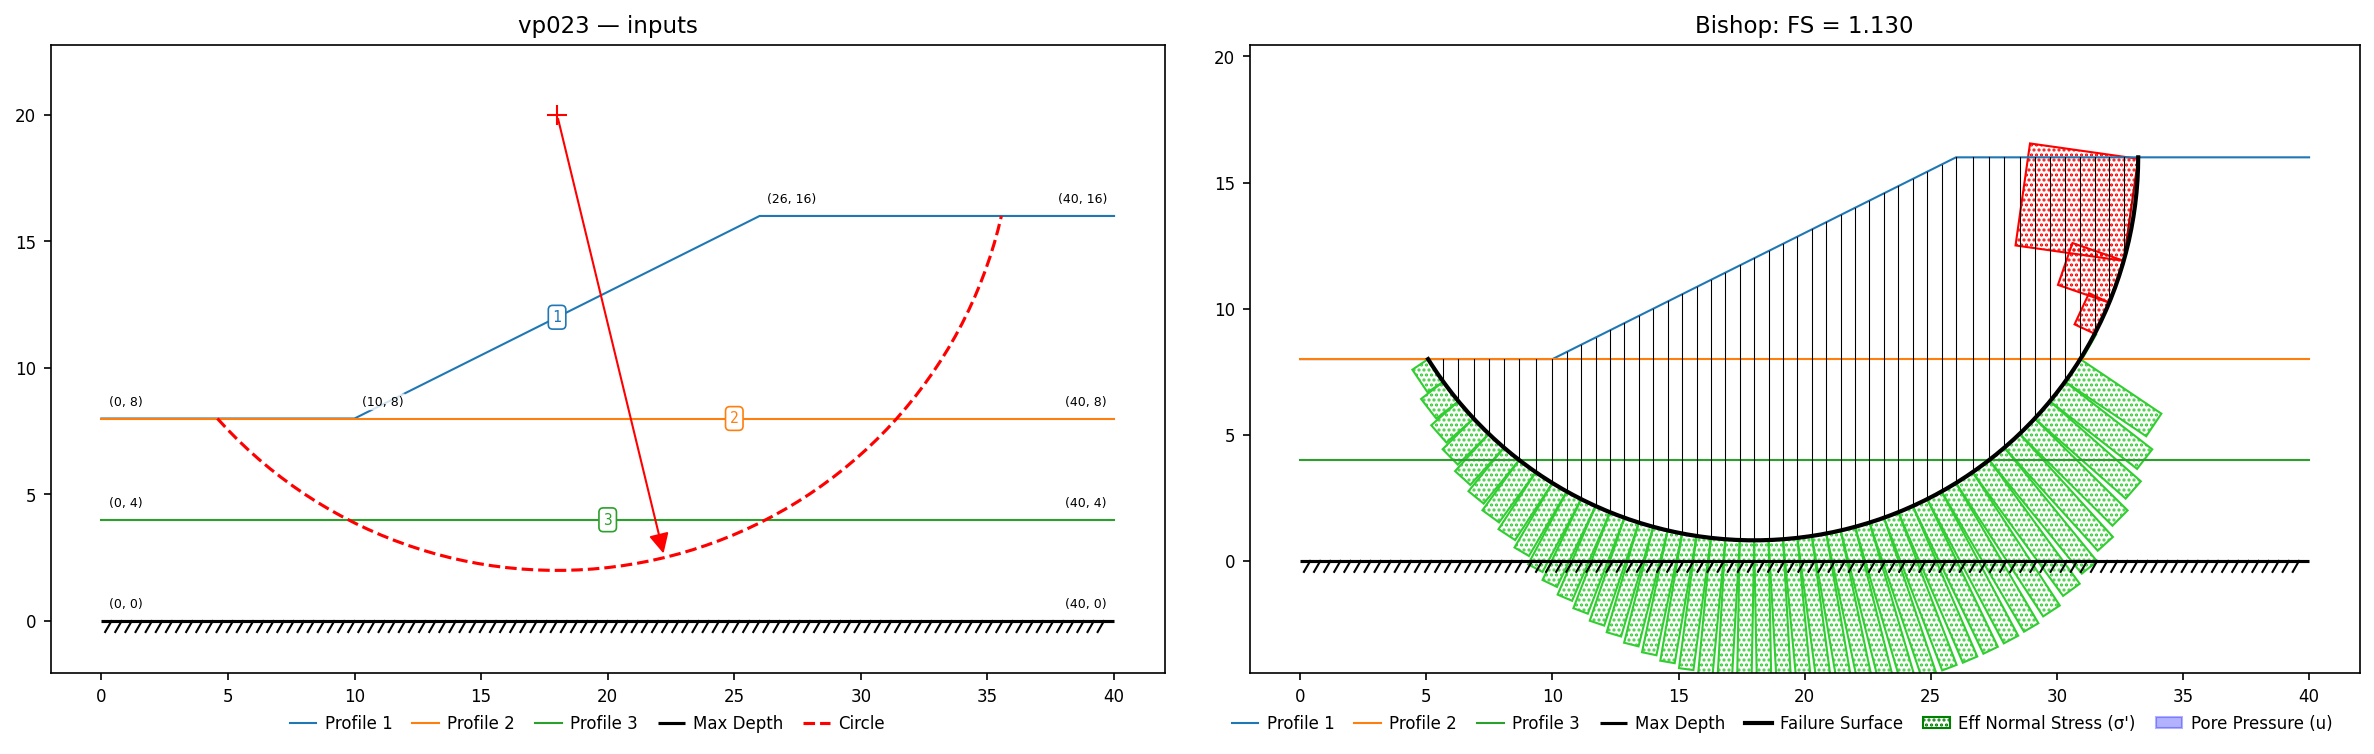
| 23 | Slope, (3) materials | built | vp023.xlsx. Low (1989): undrained layers, lower cu grows 15→30 kPa with depth (cp linear-strength option). Circular search: Ordinary 1.357 / Bishop 1.130 vs Low 1.36 / 1.14 (Slide 1.370 / 1.192; Kim 1.17 — the published Bishop values themselves spread 1.14-1.19). |
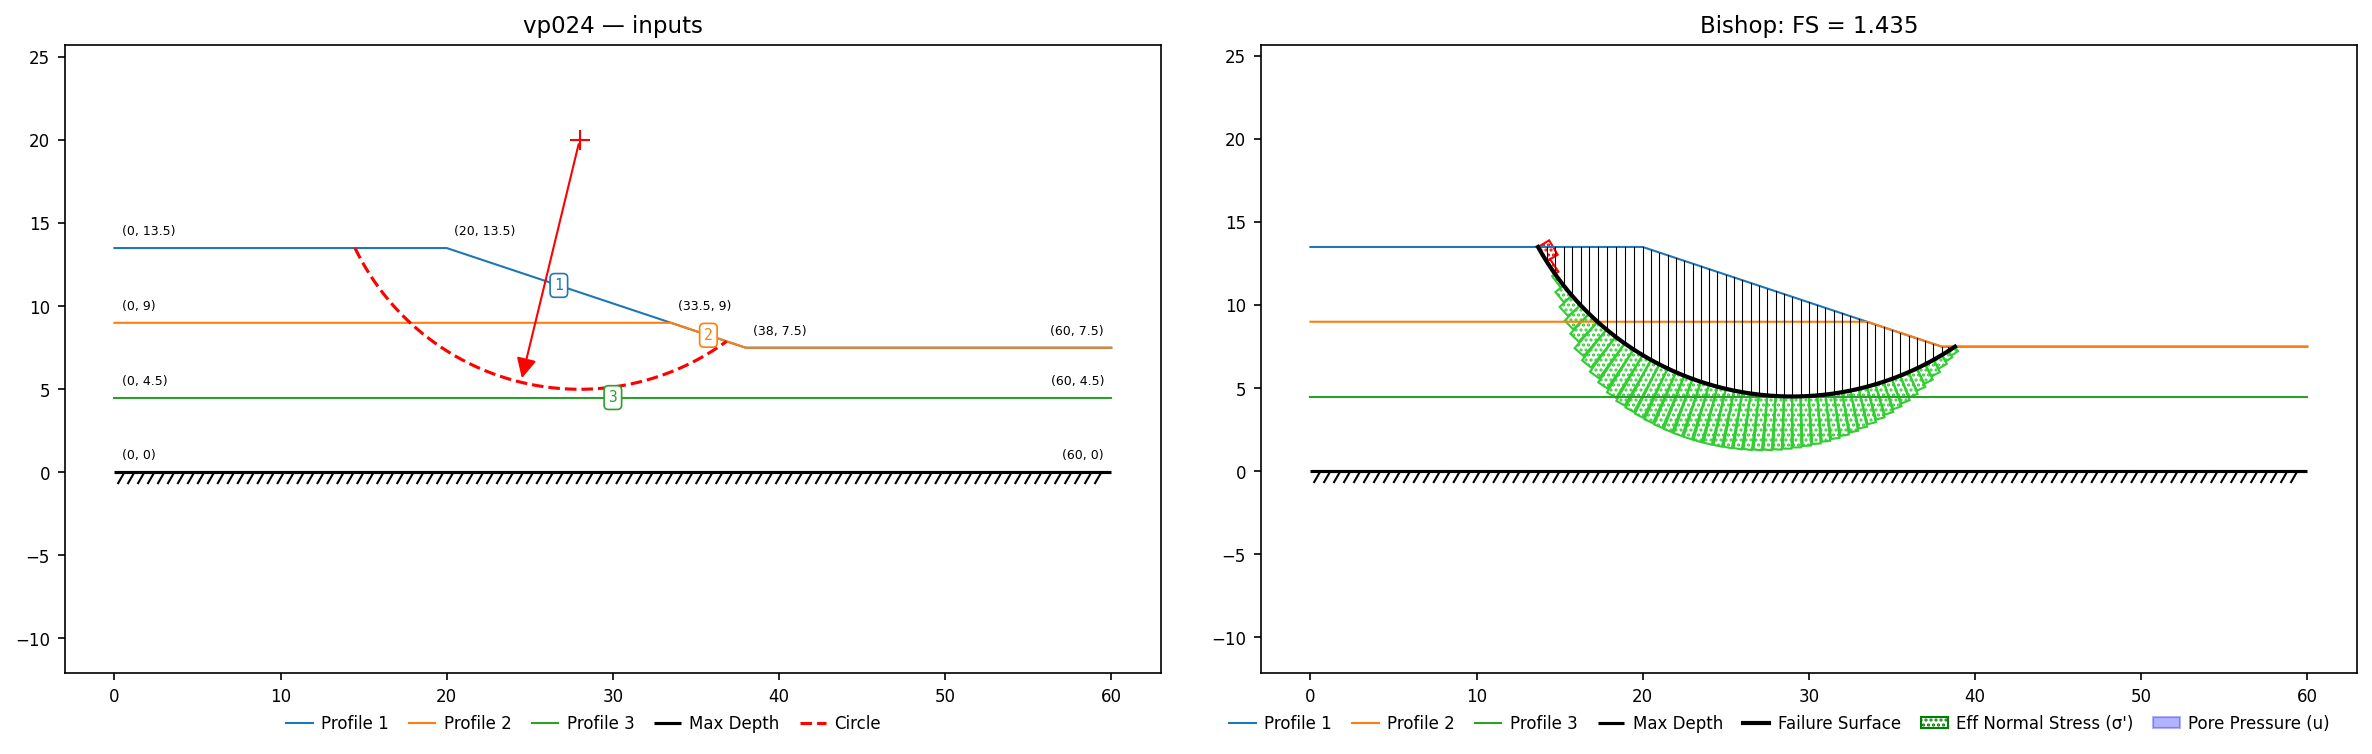
| 24 | Slope, (3) materials | built | vp024.xlsx. Low (1989) three-layer undrained slope (φ=0). Circular search: Ordinary 1.435 / Bishop 1.435 vs Slide 1.439 / 1.439; Low reference 1.44. |
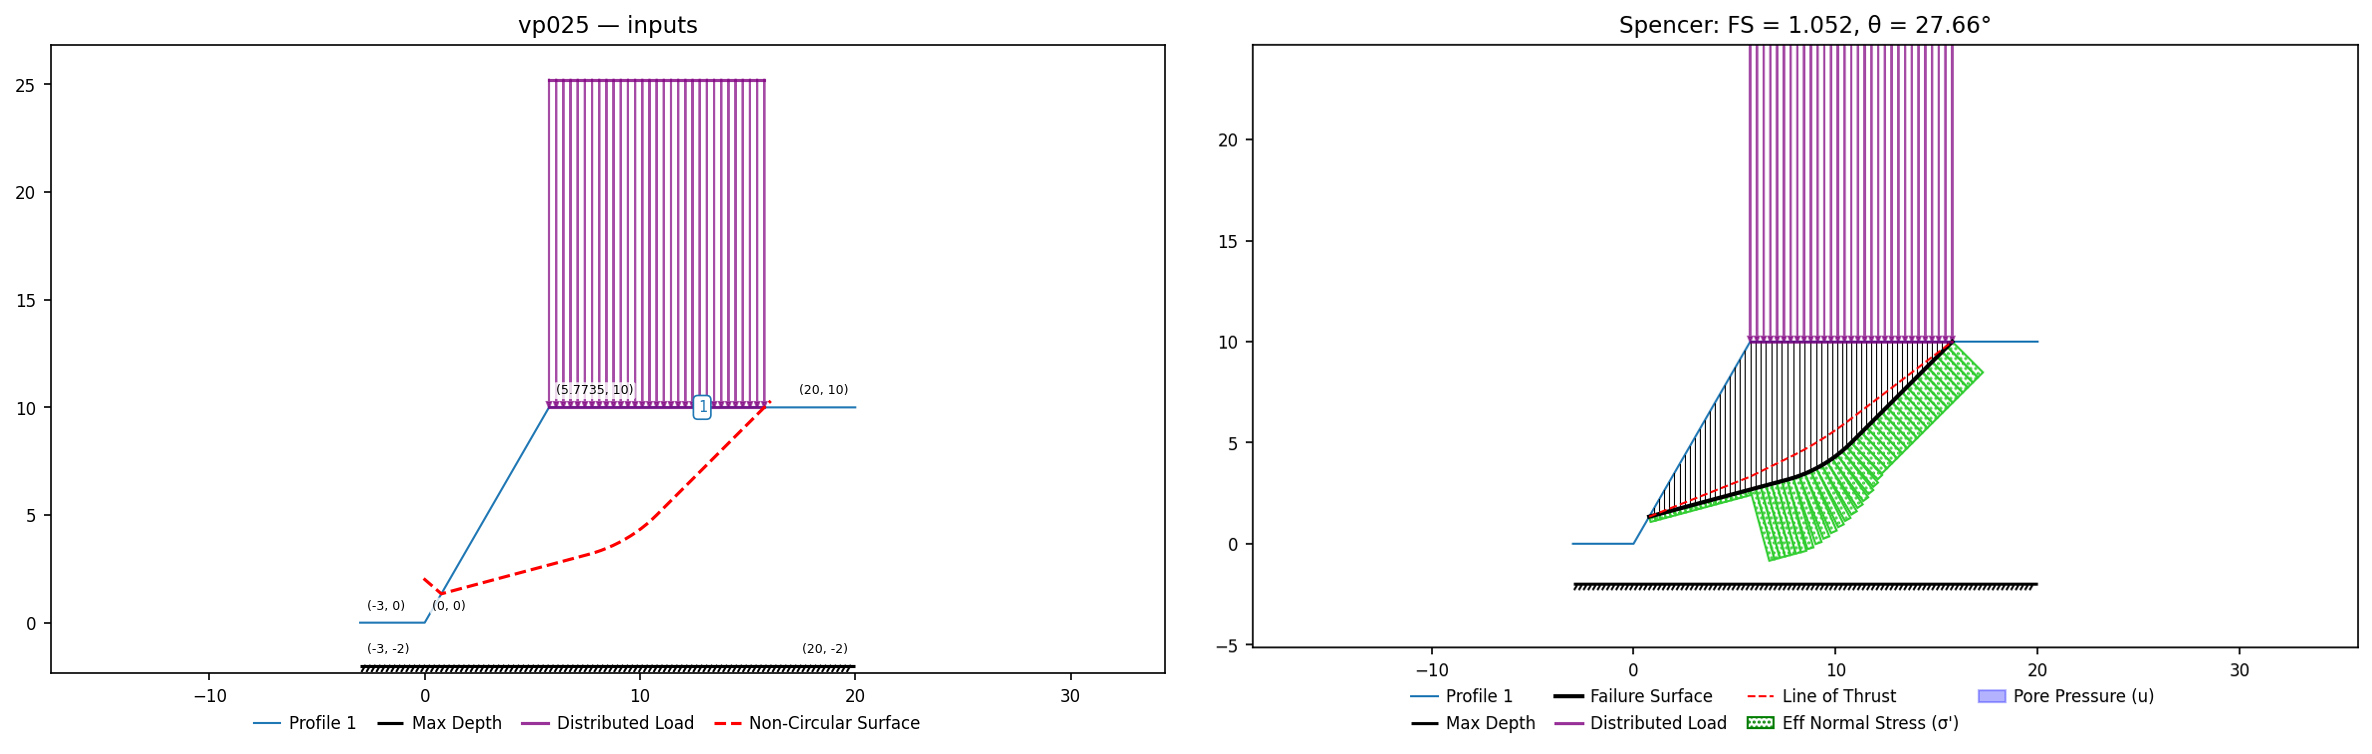
| 25 | Bearing capacity test slope, homogenous, distributed load, predefined slip surface | built | vp025.xlsx. Prandtl bearing mechanism on a 60° weightless slope (Chen & Shao 1988), surface constructed analytically as a 45° wedge + tangent fan arc. Also SLOPE/W §2.15 — same problem in the GeoStudio corpus. |
| 26 | Bearing capacity test prism, homogenous, distributed load, predefined slip surface | built | vp026.xlsx. Weightless c = 20 soil under a UDL of 102.83 = c·Nc, so the exact bearing-capacity theory FS is 1.0. Spencer 1.043 on the printed Prandtl surface (level-ground, unblocked by the flat-arc facing rule); the RS2-21 SSRM lock runs on the same file (SSRM ≈ 1.0). See the section for the comparison with Slide2's 0.941. Also SLOPE/W §2.16 — same problem in the GeoStudio corpus. |
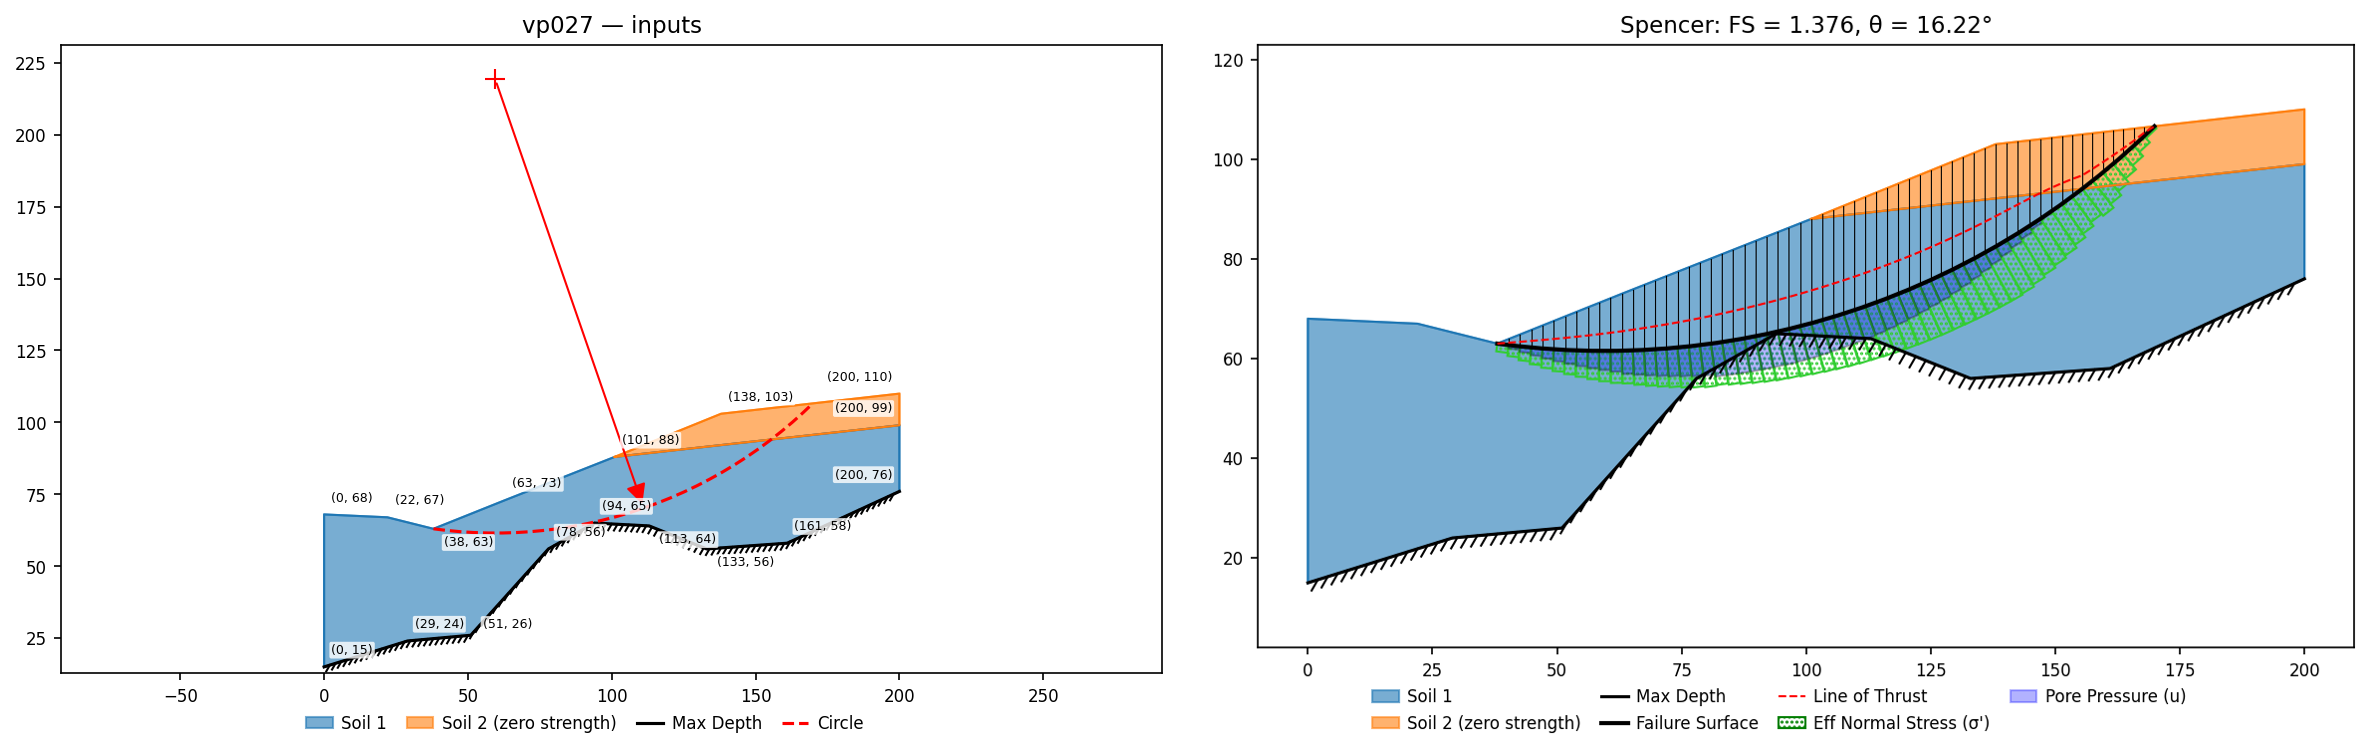
| 27 | Slope, (2) materials, tension crack, water table (auto Hu) | built | vp027.xlsx. XSTABL v5 reference slope (Sharma 1996): two materials over undulating bedrock, a zero-strength cap, and a water table with the phreatic-inclination (Hu) correction. |
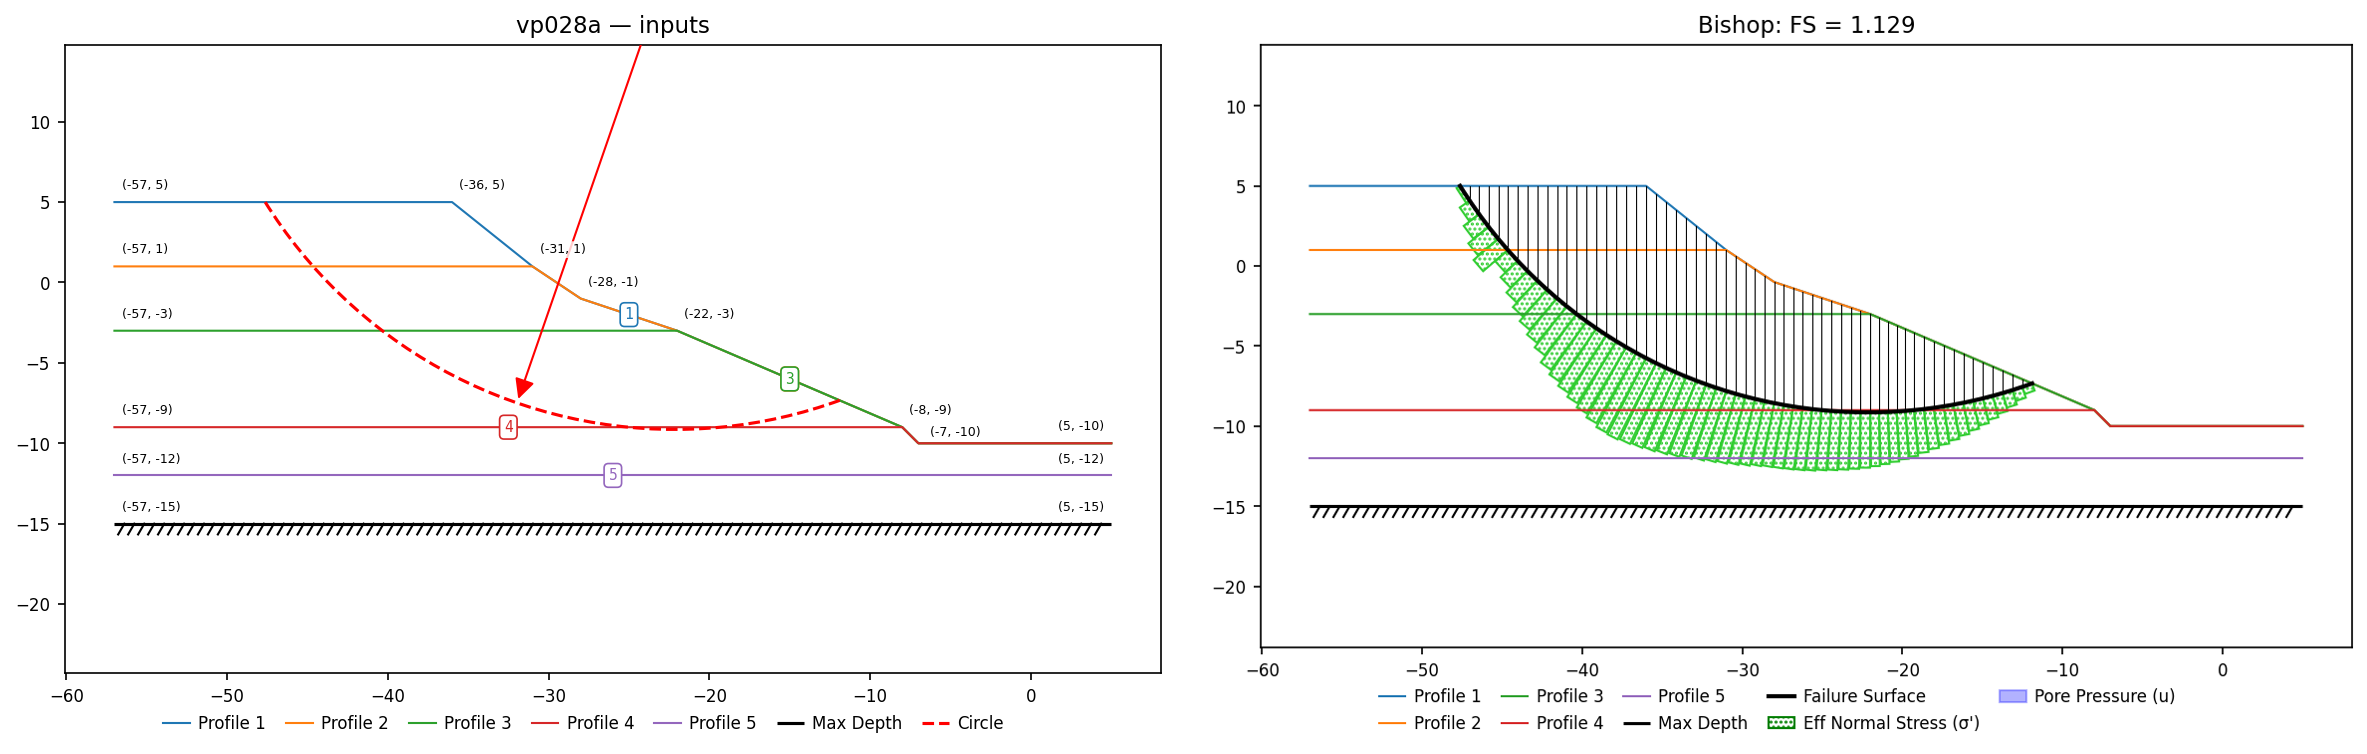
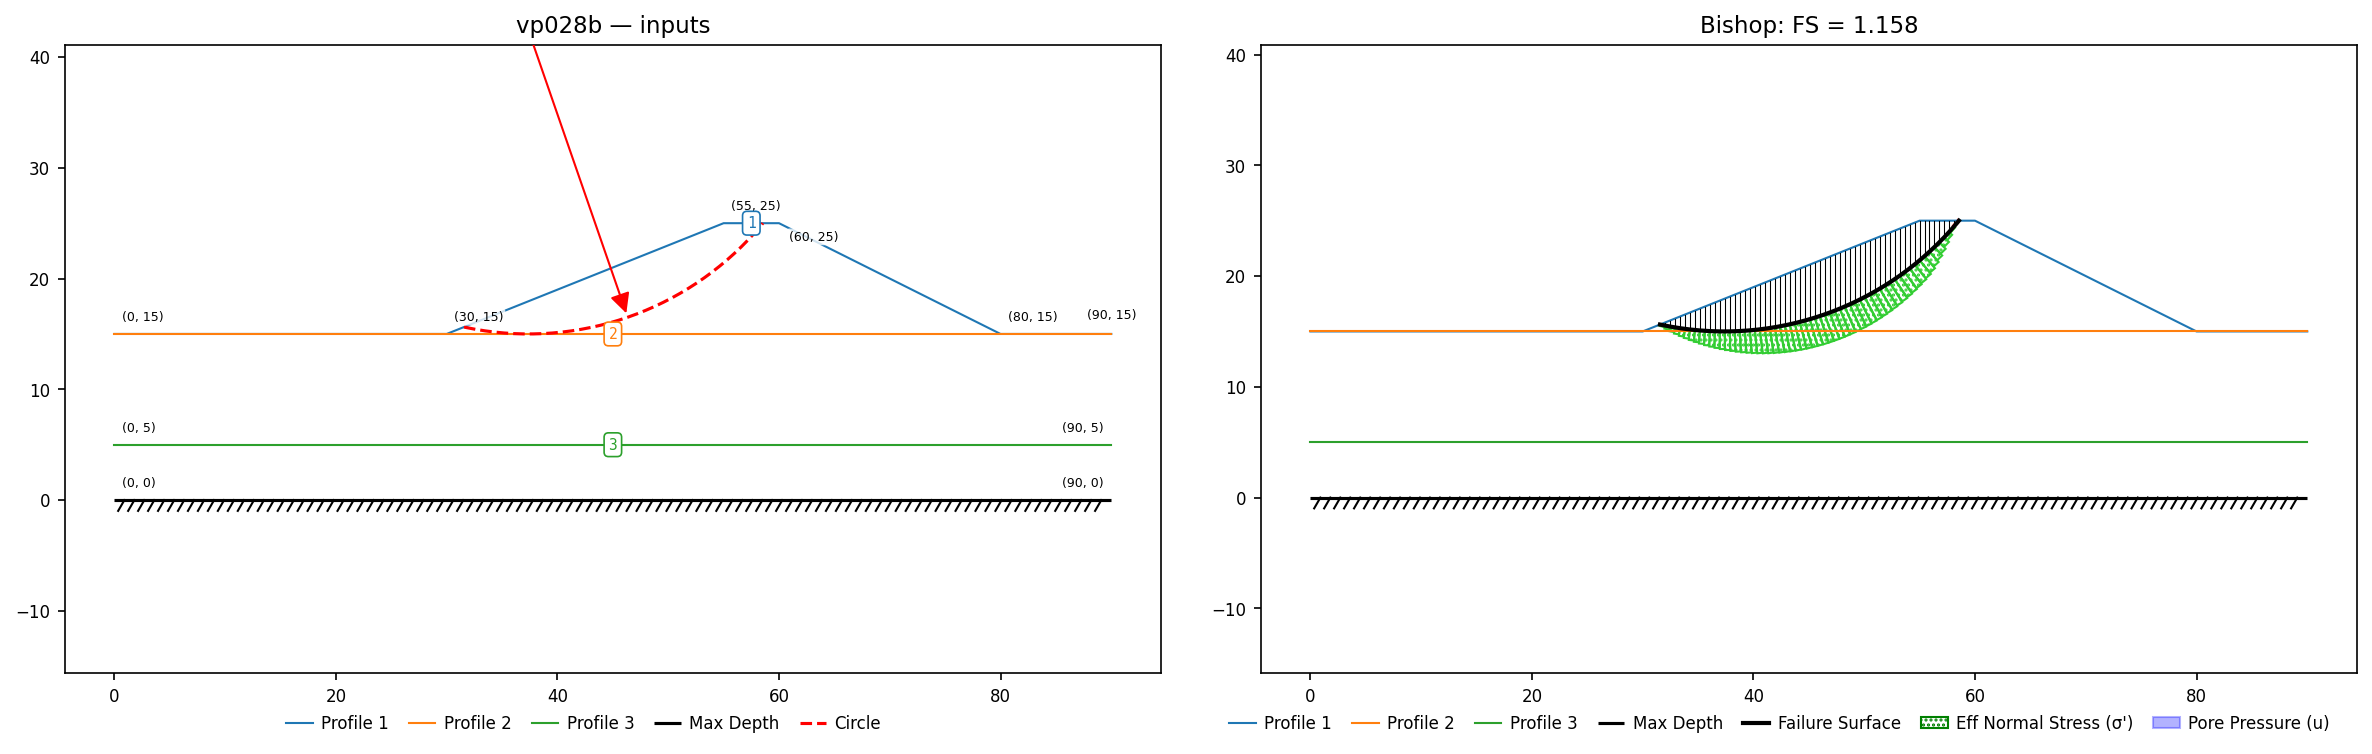
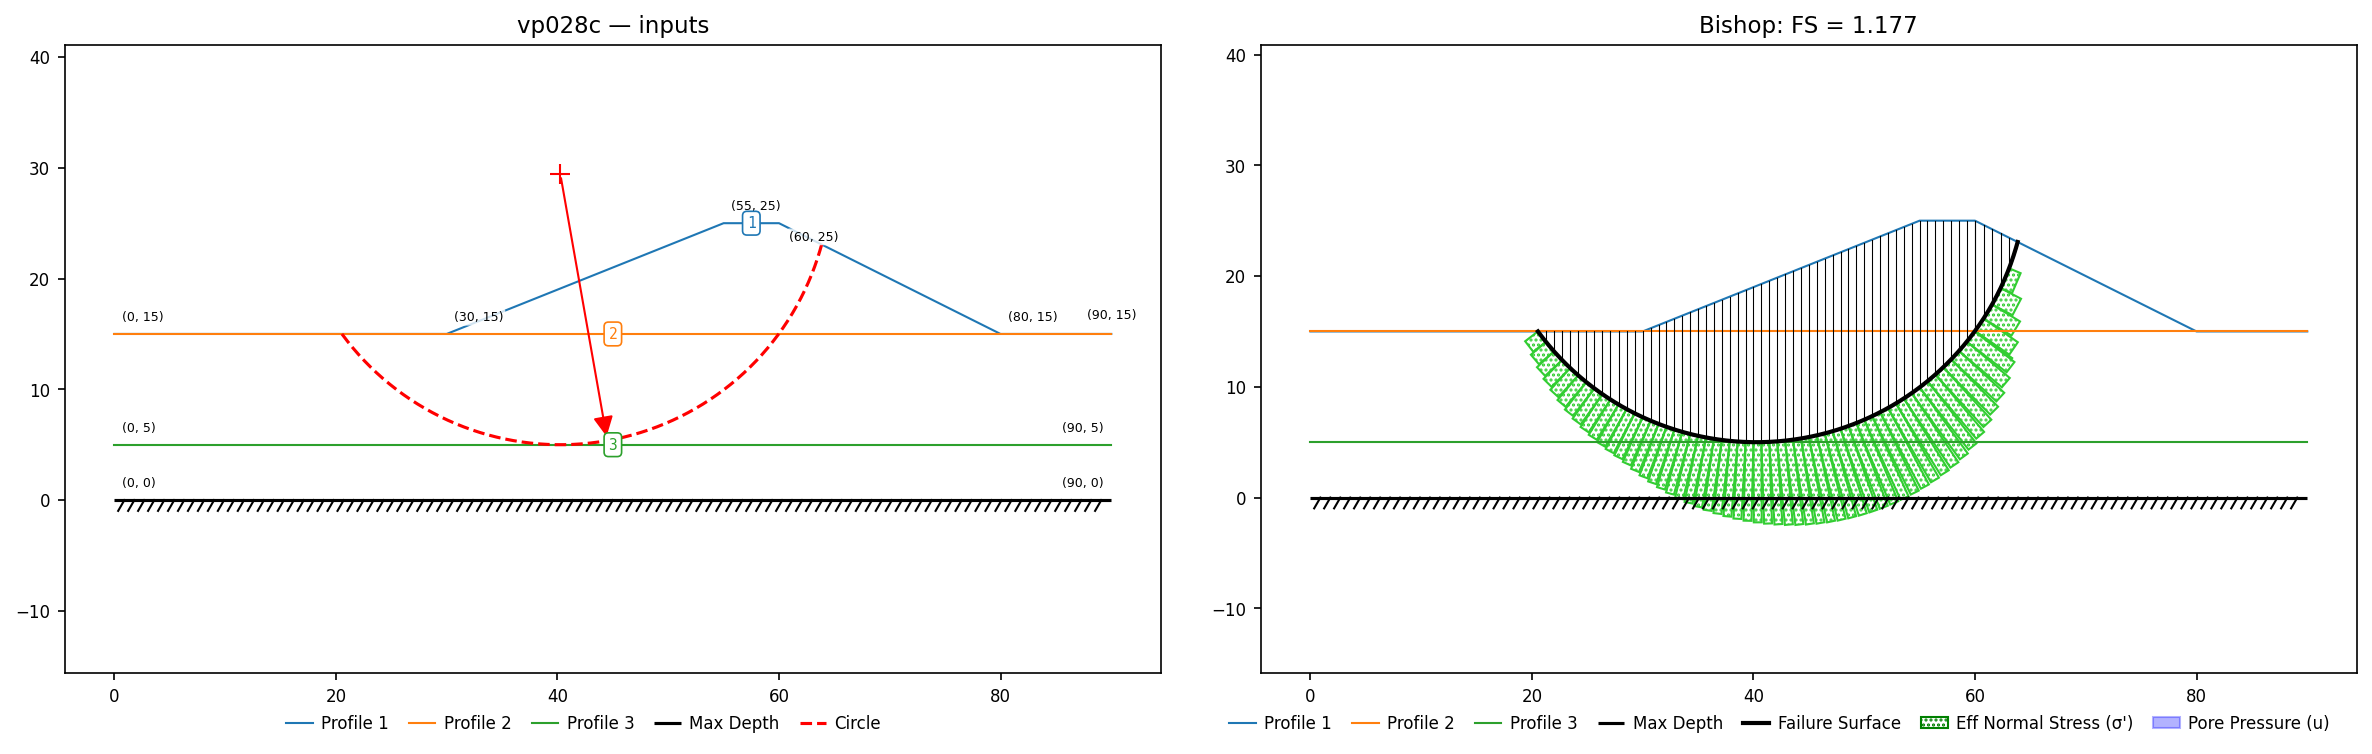
| 28 | Excavated slope and embankment, (3) materials and (5) materials, probabilistic analysis | built (3 of 10 cases) | vp028a / b / c. Chowdhury & Xu (1995): the Congress St. Cut + an embankment on soft clay, probabilistic analysis on the manual's fixed printed circles. Also SLOPE/W §2.17 — same problem in the GeoStudio corpus. |
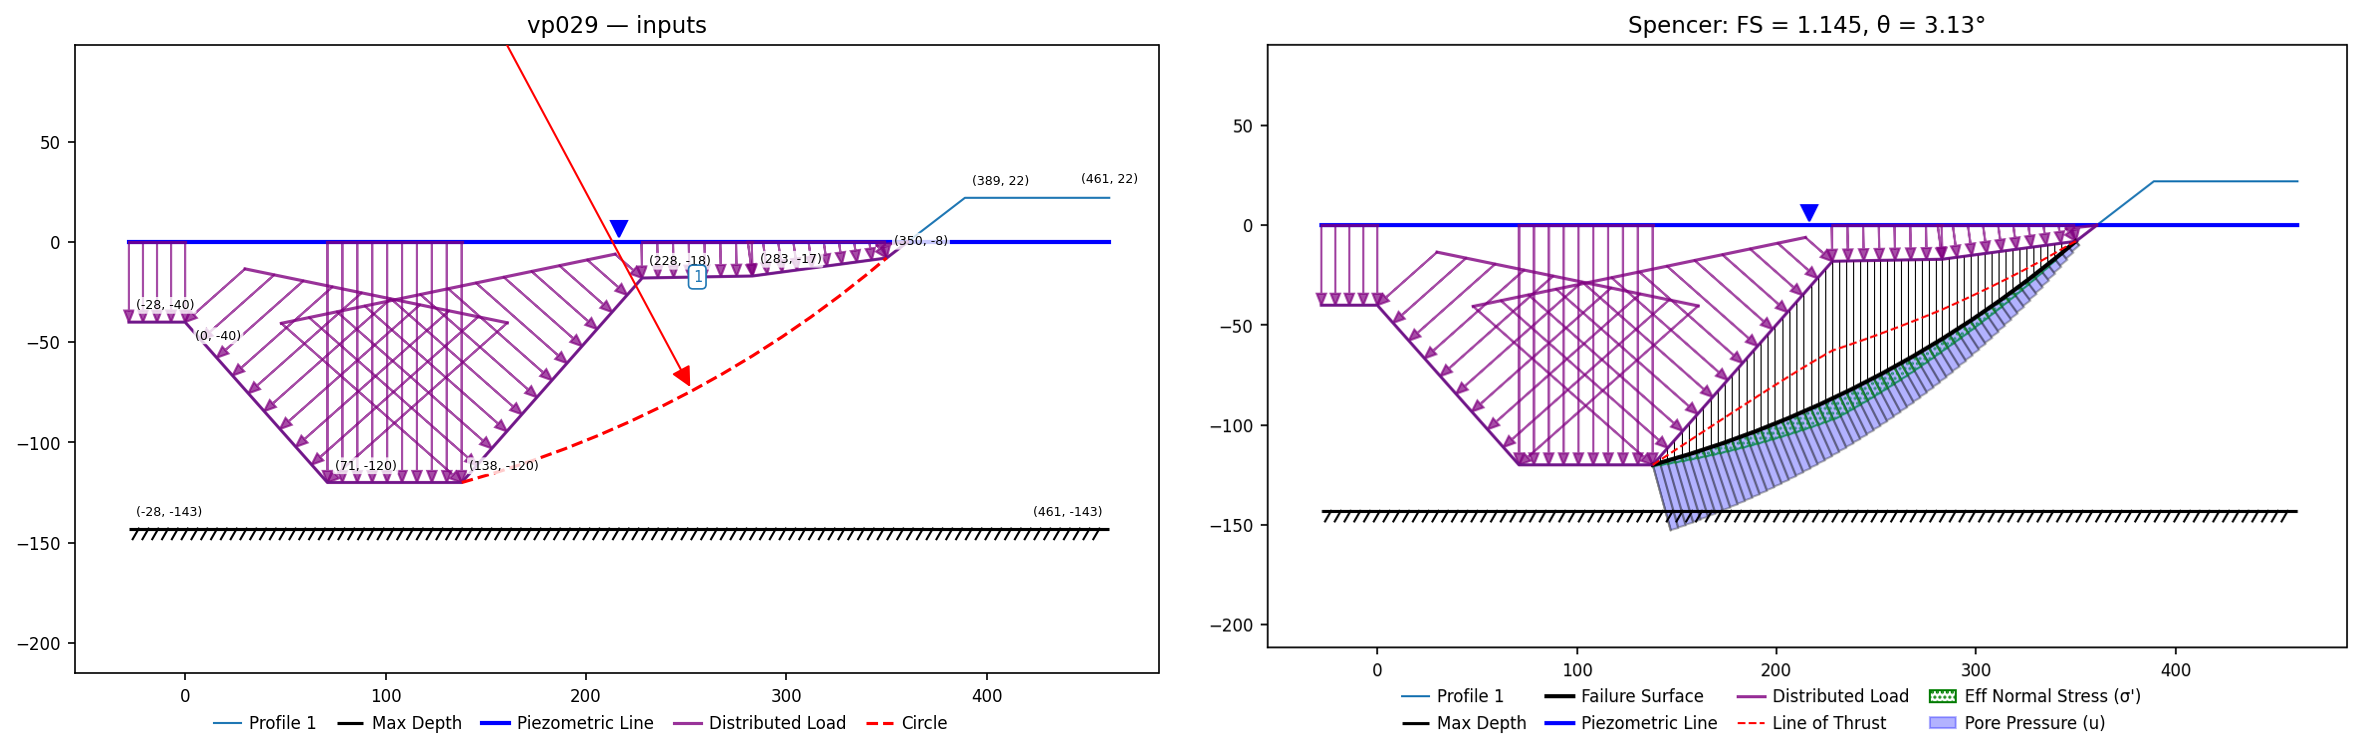
| 29 | Submerged slope, homogenous, probabilistic analysis, water table | built | vp029.xlsx. Duncan (2000) LASH terminal — the canonical Taylor-series reliability (TSPM) benchmark, an underwater trench failure in San Francisco Bay Mud, on Duncan's estimated surface. |
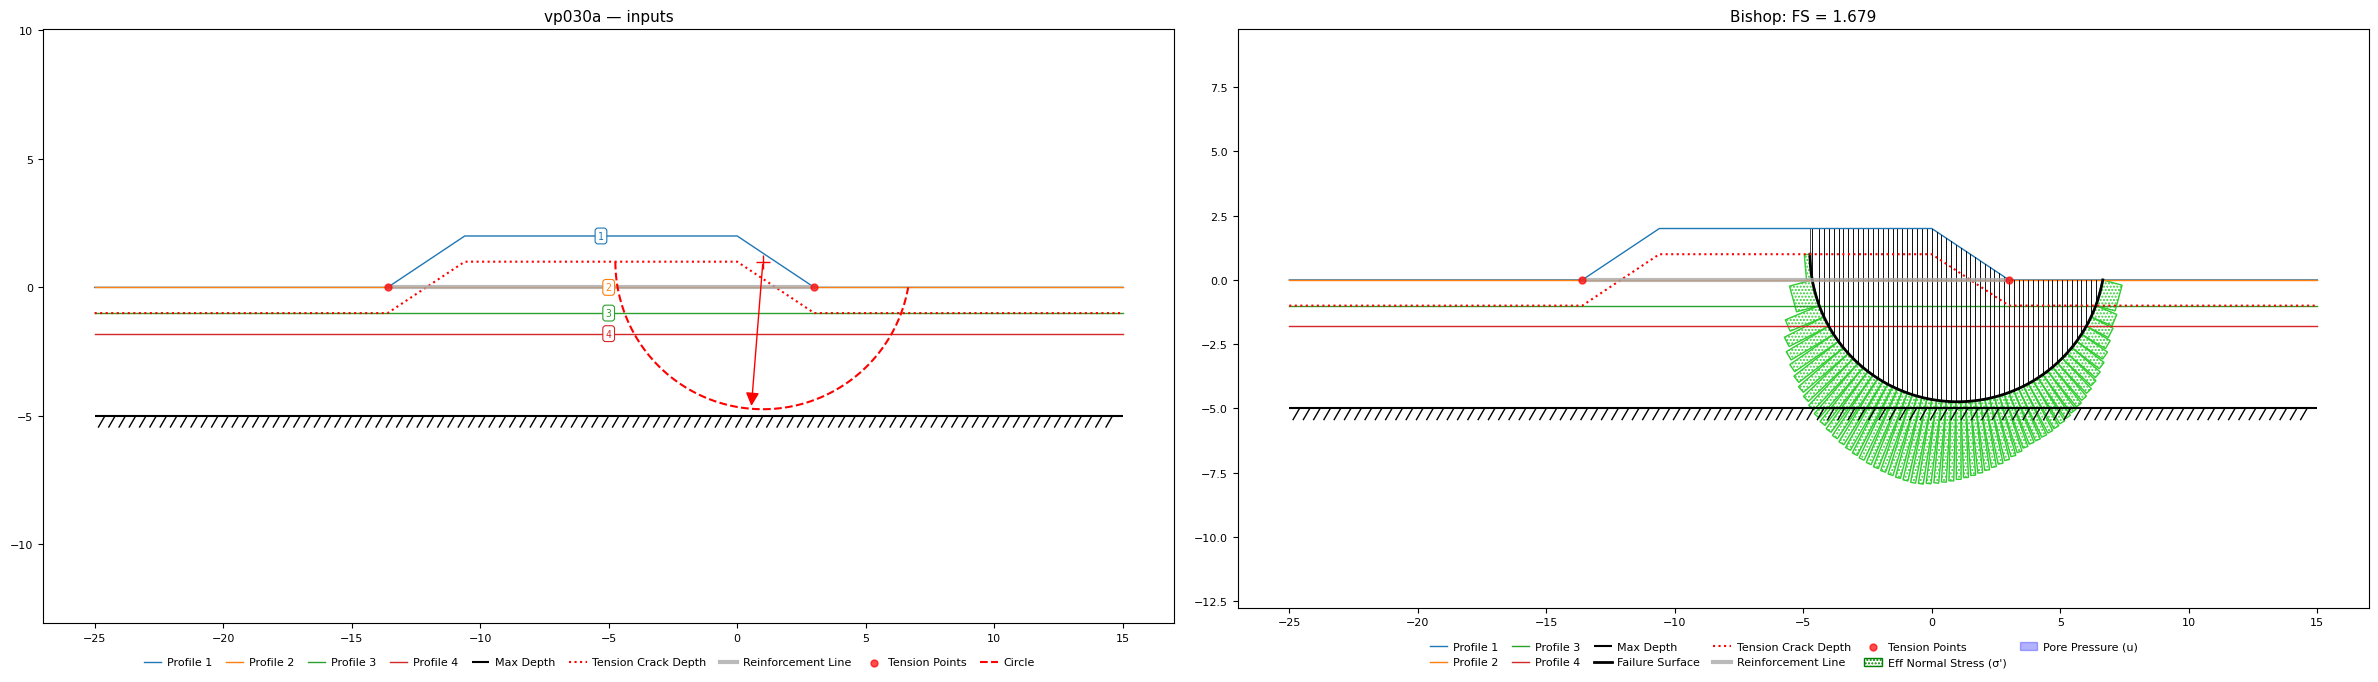
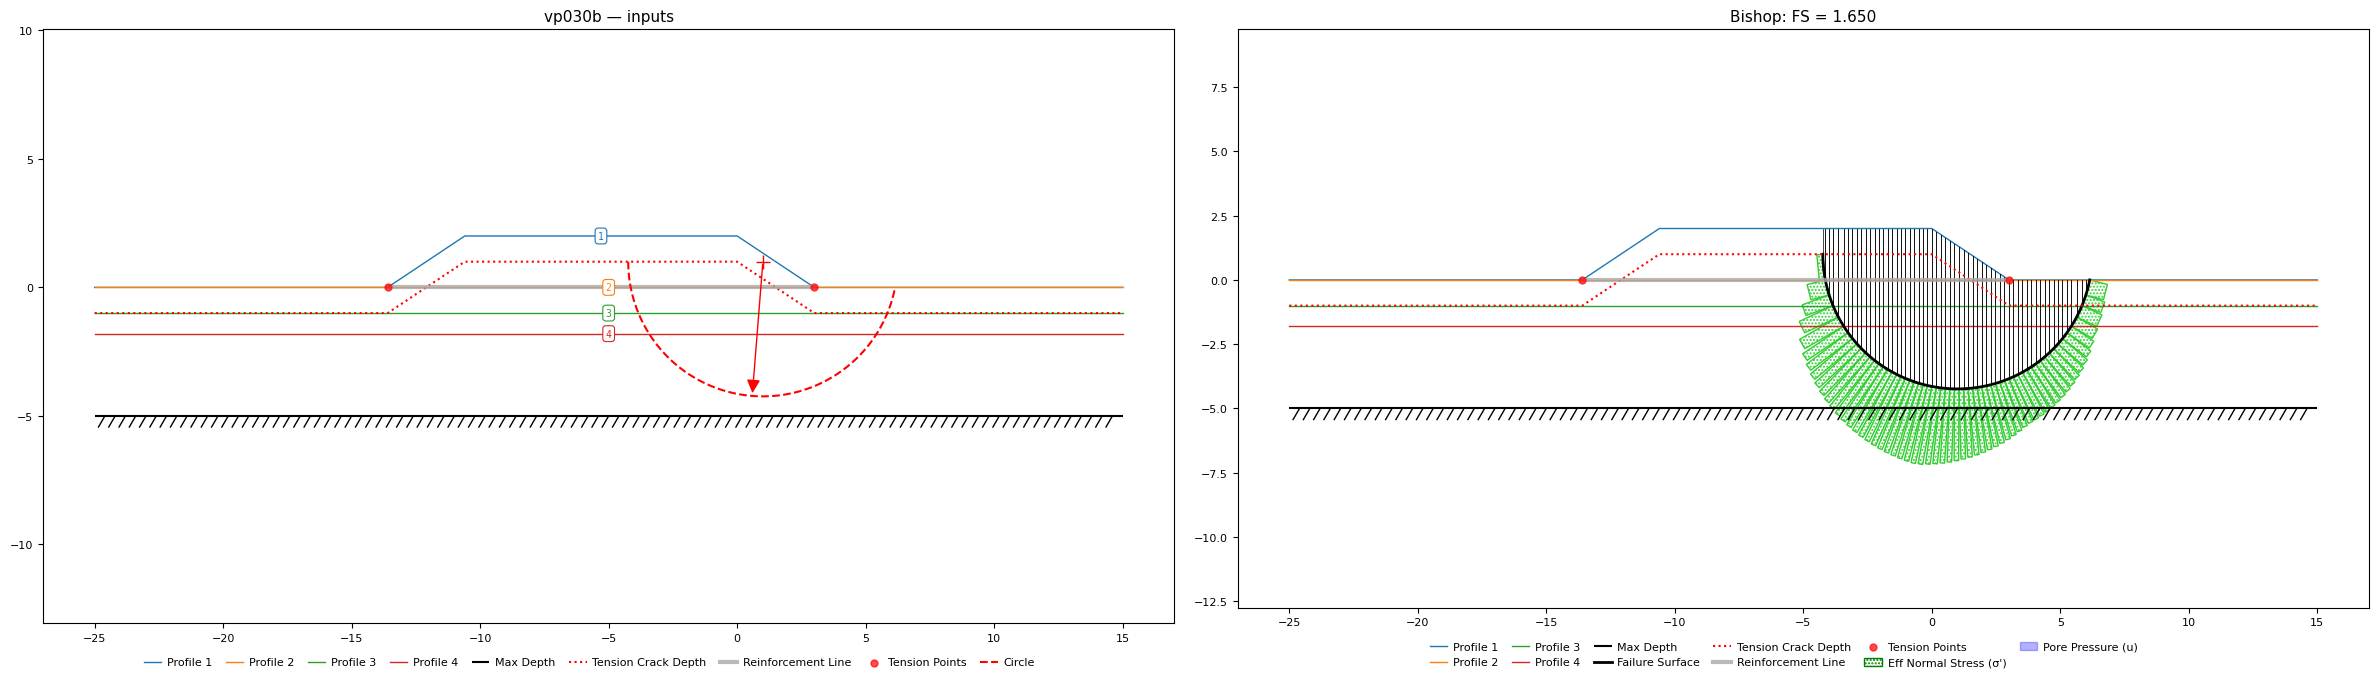
| 30 | Reinforced embankment, (4) materials, tension crack, geosynthetic | built | vp030a / b. Borges & Cardoso (2002) Case 1 — geosynthetic-reinforced embankment on soft clay. Cases 2 and 3 are VP31 and VP32. |
| 31 | Reinforced embankment, (5) materials, geosynthetic | covered | Borges & Cardoso (2002) Case 2 — the same problem is built in the GeoStudio corpus as SLOPE/W §2.18 (gs2_18.xlsx): identical embankment (c'=0, φ'=35, γ=20), the four depth-varying soft-clay layers (Clay1 33, Clay2 16, Clay3 16→18.4, Clay4 18.4→55.1, matching Slide2's Table 31.2 to rounding) and the unanchored 200 kN/m geosynthetic (δ=33.7°). M-P 1.153 / Bishop 1.154 vs SLOPE/W 1.171 / 1.170 and B&C 1.15 — the same reference as Slide2's Circle A/B (Slide 1.18 / 1.16, Borges 1.19 / 1.15). The reverse-curvature blocker noted for VP30 does not arise on the critical circle. |
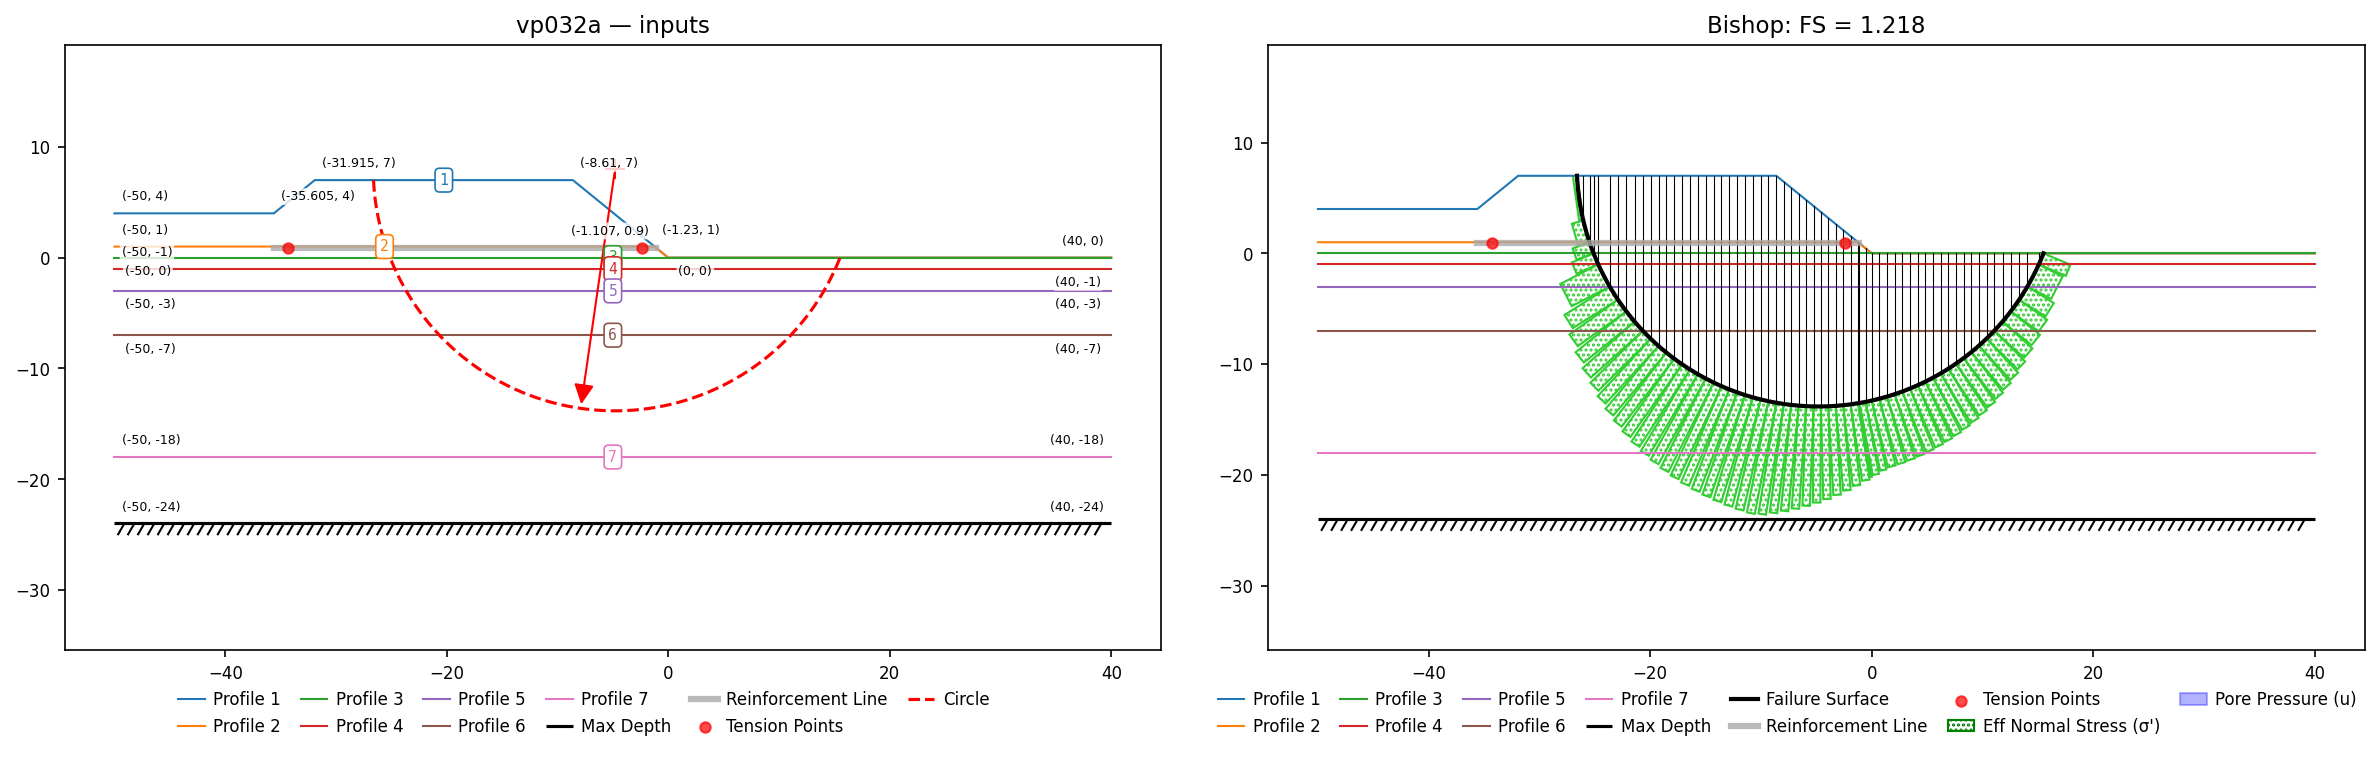
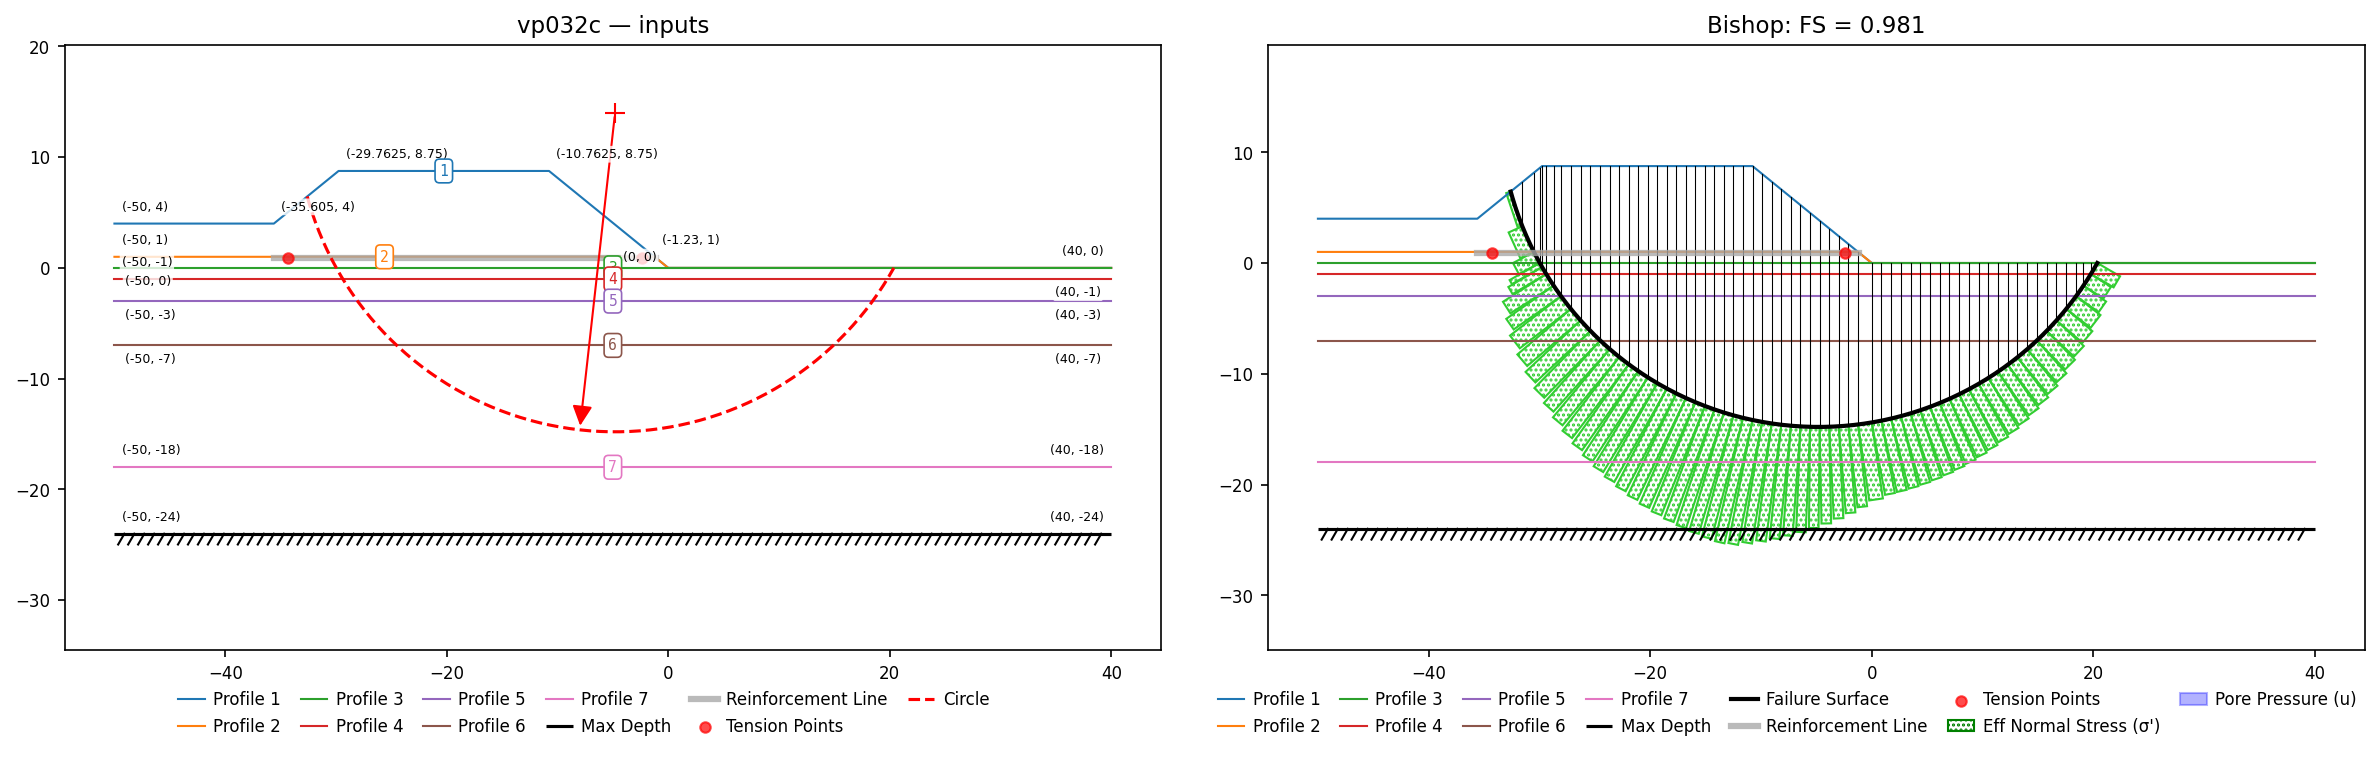
| 32 | Reinforced embankment, (7) materials, geosynthetic | built | vp032a / b / c. Borges & Cardoso (2002) case 3 geosynthetic-reinforced embankment (two fill stages), geometry from the RS2 manual's fully labeled figures. |
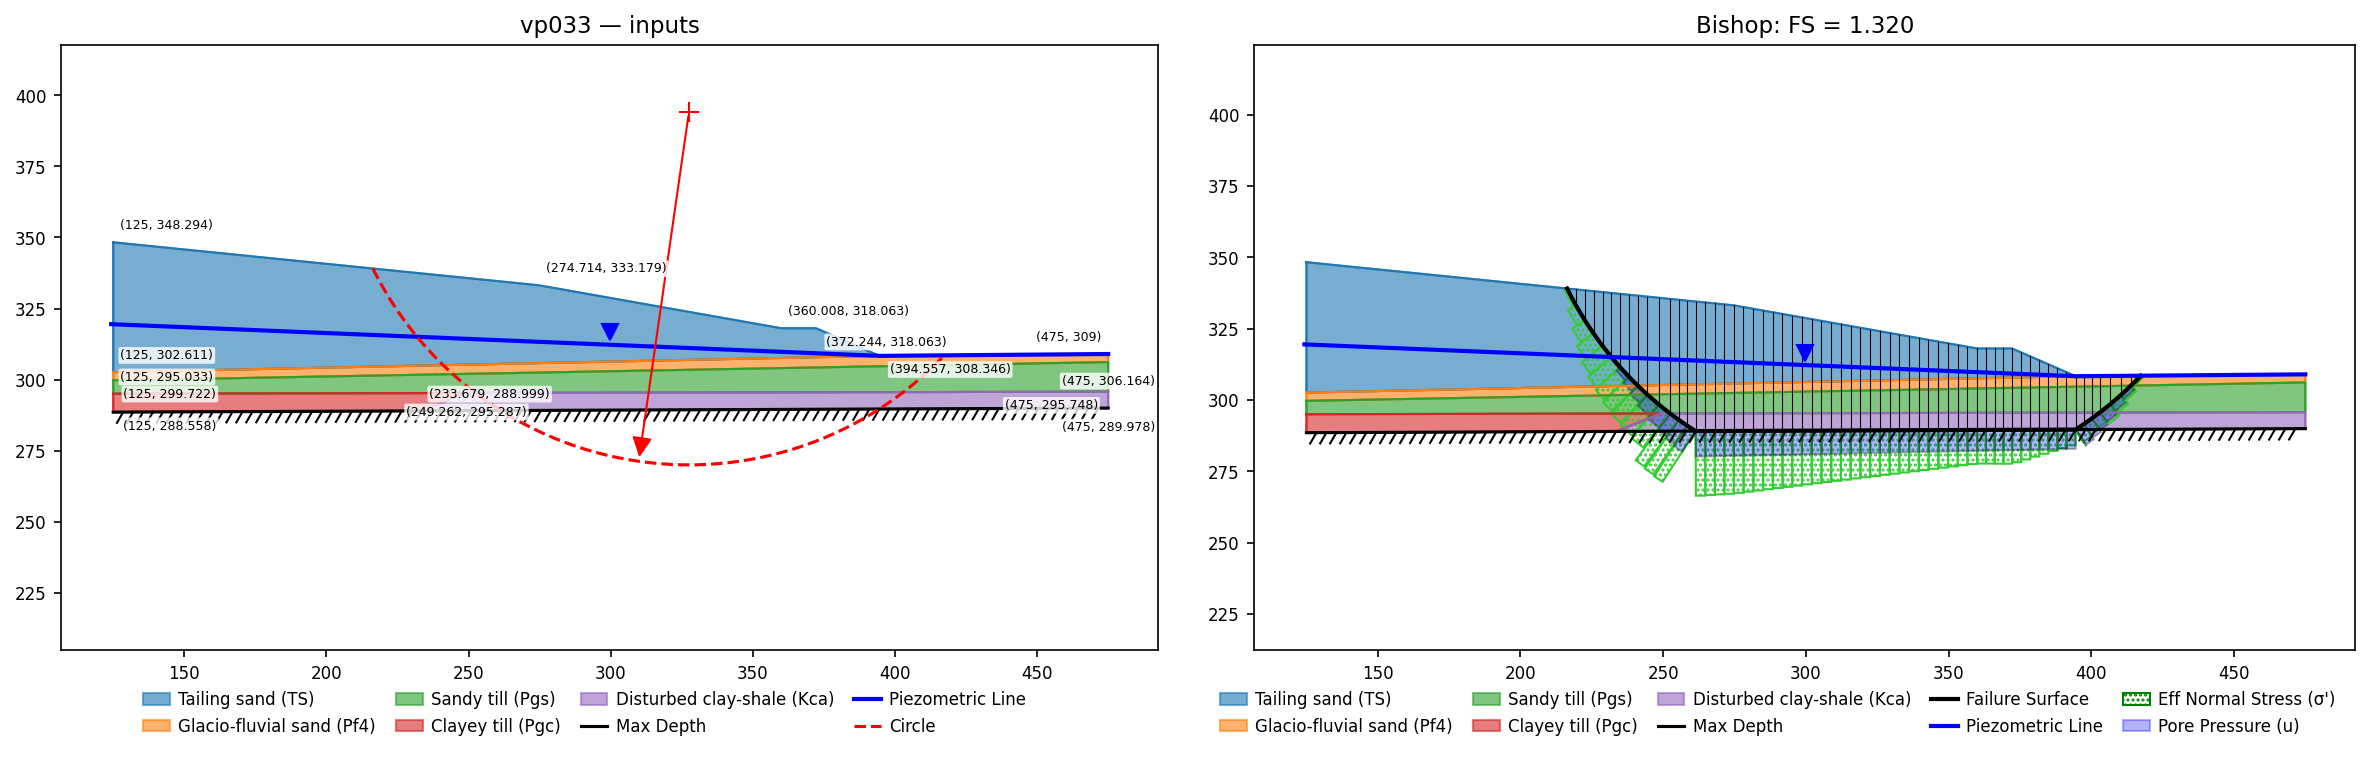
| 33 | Dike, (5) materials, probabilistic analysis, water table | built (deterministic) | vp033.xlsx. El-Ramly et al. (2003) Syncrude tailings dyke; the critical surface is composite (circle truncated at the base, running flat in the presheared clay-shale). Also SLOPE/W §2.20 — same problem in the GeoStudio corpus. |
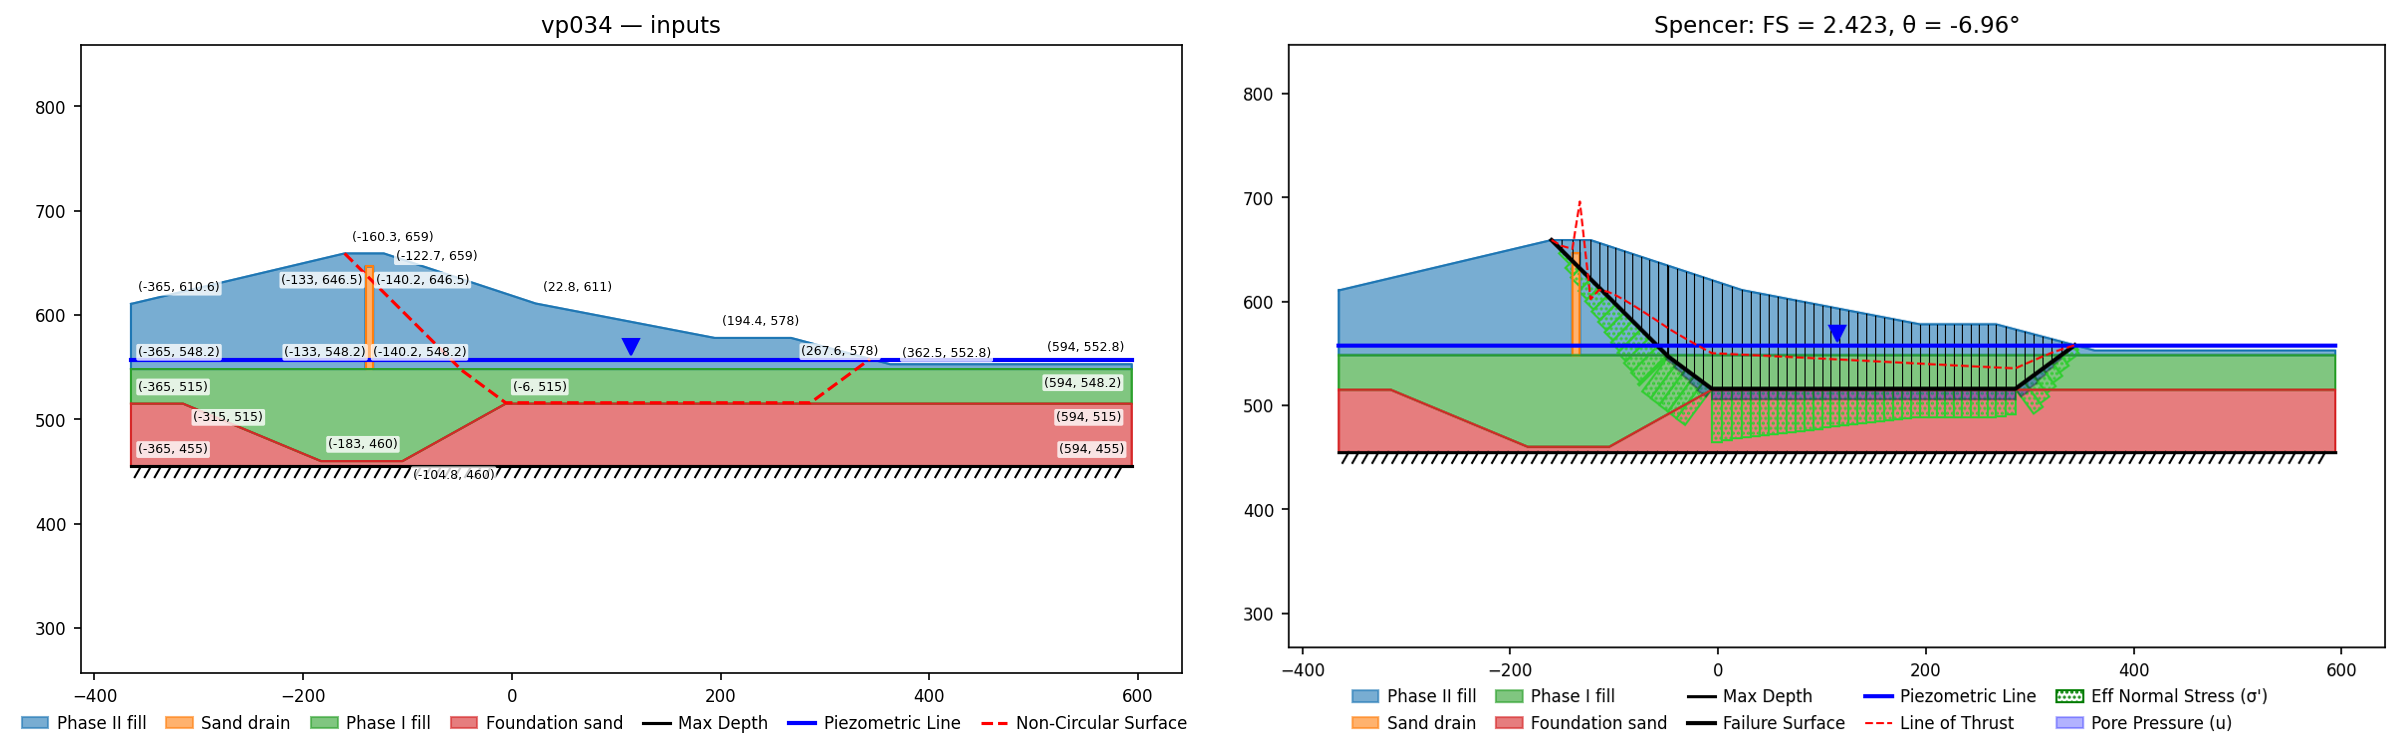
| 34 | Dam, (3) materials, probabilistic analysis, water table | built | vp034.xlsx. Clarence Cannon Dam (Wolff & Harr 1987) on the W&H prescribed noncircular surface, polygon-zone geometry with a chimney drain; deterministic lock (the Phase I COV of 124% is outside the Taylor series' domain, but Monte Carlo reproduces the probabilistic case — see section). Also SLOPE/W §2.21 — same problem in the GeoStudio corpus. |
| 35 | Dam, (5) materials, probabilistic analysis, reliability index | built | vp035.xlsx. Hassan & Wolff (1999) Cannon Dam — the benchmark where the minimum-reliability-index surface is not the minimum-FS surface, reproduced by procedure. Also SLOPE/W §2.22 — same problem in the GeoStudio corpus. |
| 36 | Slope, homogenous, probabilistic analysis, ru pore pressure, reliability index | built | vp036.xlsx. Li & Lumb (1987) / Hassan & Wolff (1999) reliability benchmark (c′=18±3.6, φ′=30±3, γ=18±0.9, ru=0.2). Also SLOPE/W §2.23 — same problem in the GeoStudio corpus. |
| 37 | Slope, homogenous, distributed load, back analysis of required support force and length | built (base slope) | vp037.xlsx. XSTABL v5 reference manual (Sharma 1996) §3.8 "Reinforcement Example" after Koerner (1991): a 12 m, 45° cohesionless slope (φ=36°, γ=20 kN/m³, printed on XSTABL's Fig. 3.15 — the Slide2 manual omits them) under a 40 kN/m² crest surcharge. On Slide's printed critical circle, Bishop 0.764 = Slide 0.764 (XSTABL Fcrit 0.734), and a toe-focus, 2 m-minimum-depth search finds that circle unaided. The required support-force back-analysis (part a, target FS 1.5) is documented in the section but not locked: xslope's concentrated-support-force credit differs from XSTABL's, so the required load does not reproduce the published 351 kN / 345 kN exactly. Part (b), the minimum reinforced-zone length, needs variable-length material zones and stays feature-gated. |
| 38 | Excavated slope, homogenous, finite element groundwater seepage analysis, matric suction | built | vp038a/b/c. Ng & Shi (1998) Hong Kong cut: xslope's own steady unsaturated FE seepage supplies the negative (matric-suction) pore pressures above the water table, and the extended Mohr-Coulomb strength (φᵇ = 15°) is priced as an apparent cohesion on the unsaturated slices. On Slide's printed H = 61 critical circle, Bishop 1.612 / 1.533 / 1.413 for right-side head H = 61/62/63 m vs Slide 1.621 / 1.538 / 1.407 (Ng & Shi 1.636 / 1.527 / 1.436) — within 0.6%. See the section for the seepage→suction chain and the free-search note. |
| 39 | Reinforced embankment, (2) materials, tension crack, geosynthetic | built (circular cases) | vp039a/b/c/d. Tandjiria (2002): the geosynthetic force required to restore FS=1.35 on a half-embankment, as clay and as sand fill (noncircular cases not locked — see section). Also SLOPE/W §2.24 — same problem in the GeoStudio corpus. |
| 40 | Slope, homogenous, sensitivity analysis | built | vp040.xlsx. Perry (1993) power-curve strength slope on the specified surface — the corpus's first sensitivity benchmark, sweeping the A and b parameters through sensitivity(). |
| 41 | Slope, homogenous, ru pore pressure | built | vp041.xlsx. Jiang, Baker & Yamagami (2003): power-curve strength τ=1.4·σ′^0.8 with ru=0.3 — exercises the pow and ru options together. |
| 42 | Dam, (3) materials, water table, ponded water, tension crack | built | vp042.xlsx. Baker & Leshchinsky (2001) safety-map clay-core dam — XSLOPE reproduces the published cluster on all three reference surfaces (Slide's circle Spencer 1.926 vs 1.925; Baker's noncircular 1.882 vs 1.91; SLOPE/W's own circle 1.939 vs 1.934), with the reservoir carried as an explicit hydrostatic face load validated against a buoyant-weight oracle. Also SLOPE/W §2.25 — same problem in the GeoStudio corpus. |
| 43 | Slope, homogenous, planar surface, RocPlane comparison | built | vp043.xlsx. Baker (2001) planar-slip benchmark (c'=30, φ'=30, γ=20, dry) on the critical toe plane; the SLOPE/W model pins the crest-offset geometry. Also SLOPE/W §2.26 — same problem in the GeoStudio corpus. |
| 44 | Slope, homogenous | built | vp044a.xlsx (power curve) / vp044b.xlsx (Mohr-Coulomb) / vp044c.xlsx (converged LLA). Baker (2003) ex. 1: a 43° slope with three strength models fitted to the same triaxial data. |
| 45 | Slope, homogenous | built | vp045a.xlsx (Mohr-Coulomb) / vp045b.xlsx (power curve). Baker (2003) ex. 2: a linear vs non-linear strength envelope on the same 4:1 slope. |
| 46 | Dam, (2) materials, rapid drawdown, finite element groundwater seepage analysis, ponded water | partial (stages 1-2 built) | vp046.xlsx (stage 1) / vp046b.xlsx (stage 2). Baker (1993) three-stage validation dam. Stage 1 (dry): the c′ = 0 upstream natural-clay face is a 4H:1V infinite-slope skin, so XSLOPE's circular search lands on the closed form FS = tan 32°/tan 14.04° = 2.50 (Spencer/Bishop) — exactly the manual's theoretical 2.5, vs Slide's min-depth-5m noncircular Spencer 2.534 (−1.4%) and Baker 2.41. Stage 2 (steady seepage, full reservoir): XSLOPE solves its own FE seepage from the conductivity ratios Baker publishes (equal clays, 10:1 anisotropy, p. 32) — the field, and thus FS, is invariant to the absolute Ks (checked at 7e-5 and 7e-6) — and the upstream-slope search gives Spencer 7.086 / Bishop 7.093 vs Slide 7.003, Baker 6.98. Stage 3 (rapid drawdown) stays gated: its undrained strength is Baker's Fig. 14, a 2-D contour field whose near-surface value varies ~6× with the embankment surcharge; a 1-D cu-vs-elevation fit swings FS from 1.10 to 3.11 (stepped-zone fits 2.40–2.70), so no per-material function reaches 2.181 without tuning to the target. The paper corroborates the targets: Baker Fs = 2.41 / 6.98 / 2.18 for stages 1 / 2 / 3. |
| 47 | Retaining wall, homogenous, planar failure, line load, shotcrete, soil nails | built | vp047.xlsx. Sheahan & Ho (2003) Amherst test wall: a 6 m undrained cut with 2 soil-nail rows (FHWA capacity envelope) + a shotcrete line load, on planar surfaces through the toe. Also SLOPE/W §2.27 — same problem in the GeoStudio corpus. |
| 48 | Retaining wall, homogenous, planar failure, line load , soil nails, shotcrete | built | vp048.xlsx. Clouterre full-scale test wall: 7 nail rows (constant 15 kN tension), planar surfaces through the toe at 45–70°; Janbu/Spencer within 0.3% of Slide at 55–70°. Also SLOPE/W §2.28 — same problem in the GeoStudio corpus. |
| 49 | Retaining wall, (2) materials, grouted tiebacks, soldier piles | built | vp049.xlsx. SNAILZ reference-manual soldier-pile tieback wall on the given bilinear wedge (two tieback rows + the soldier pile as a face micro-pile). Also SLOPE/W §2.29 — same problem in the GeoStudio corpus. |
| 50 | Reinforced slope, (2) materials, predefined slip surface, geosynthetic | built | vp050.xlsx. SNAILZ reference-manual nail wall: 14 nail rows with per-row length/tensile/bond values, evaluated on the printed deep wedge. Also SLOPE/W §2.30 — same problem in the GeoStudio corpus. |
| 51 | Slope, (4) materials, water table, tension crack, seismic | built | vp051.xlsx. Zhu, Lee & Jiang (2003) four-layer slope, k=0.1, 5 m tension crack, specified circle (18.058, 66.744, R=86); seven-method comparison, phreatic line calibrated to the agreeing published Bishop/Spencer values. Also SLOPE/W §2.31 — same problem in the GeoStudio corpus. |
| 52 | Slope, (4) materials, water table, tension crack | built | vp052a.xlsx (dry) / vp052b.xlsx (wet). Zhu & Lee (2002) heterogeneous benched slope; the governing deep (surface 3) family via free circular search (the shallow/noncircular surfaces need constrained searches not yet exposed). Also SLOPE/W §2.32 — same problem in the GeoStudio corpus. |
| 53 | Slope, homogenous, water table, tension crack, planar failure, RocPlane comparison | built | vp053.xlsx. Priest (1993) rigid block: 30° plane from the toe, 15-m tension crack 25% filled with water (tcrack_water). All methods 1.048 vs Slide Janbu 1.049 = RocPlane 1.049 = Priest 1.049 — on a single plane every method coincides. |
| 54 | Slope, homogenous, micro piles | built | vp054a.xlsx (no pile) / vp054b.xlsx (with pile). Yamagami (2000): a stabilizing micro-pile row at the crest, evaluated on the printed critical circle. Also SLOPE/W §2.34 — same problem in the GeoStudio corpus. |
| 55 | Slope, homogenous, water table | built | vp055.xlsx. Pockoski & Duncan (2000) test slope 1 — a homogeneous sandy-clay slope with a water table, on Slide's printed critical circle. |
| 56 | Slope, homogenous, water table, tension crack | built | vp056.xlsx. P&D test slope 2: slope 1 plus a dry 5.5-ft tension crack (depth from Slide's slip-endpoint/intercept pair). Bishop 1.283 / Spencer 1.288 / Lowe 1.307 vs Slide 1.285 / 1.290 / 1.304. |
| 57 | Slope, (2) materials, water table, tension crack, composite surfaces | built | vp057.xlsx. Pockoski & Duncan (2000) test slope 3 with a weak clay seam — the manual's A/B test run with and without composite surfaces, which XSLOPE reproduces both ways. |
| 58 | Retaining wall, (8) materials, water table, grouted tieback | built | vp058.xlsx. Pockoski & Duncan (2000) #4 on Slide's printed circle: Bishop 1.142 / Spencer 1.140 / Ordinary 1.119 vs Slide 1.147 / 1.145 / 1.129 and UTEXAS4 1.14 / 1.14. |
| 59 | Retaining wall, homogenous, water table, grouted tieback | built (Janbu/Corps) | vp059.xlsx. Pockoski & Duncan (2000) test slope 5 — a single-row tieback wall in sand with a drawn-down water table, under-designed so every published FS is below 1 (Spencer/M-P are inadmissible here — see section). |
| 60 | Retaining wall, (2) materials, tension crack, distributed load, soil nails | built | vp060.xlsx. Pockoski & Duncan (2000) #7 nailed wall on Slide's printed circle with a 7-ft dry crack: Spencer 1.010 / Janbu simplified 1.043 vs Slide 1.009 / 1.041. |
| 61 | Slope, homogenous, composite surfaces | built | vp061a.xlsx (power), vp061b.xlsx (M-C). Baker (2003) ex. 3 (London clay) on the #44 geometry: Spencer power 1.466 vs Slide 1.468 / Baker 1.48; MC 1.367 vs Slide 1.366 / Baker 1.35. |
| 62 | Slope, homogenous, ru pore pressure, seismic | built | vp062a.xlsx (dry, kc=0.432) / vp062b.xlsx (ru=0.5, kc=0.132). Loukidis et al. (2003) critical-seismic-coefficient benchmark: FS should be 1.0 at kc. Also SLOPE/W §2.38 — same problem in the GeoStudio corpus. |
| 63 | Slope, (3) materials, seismic | built | vp063.xlsx. Loukidis et al. (2003) example 2 — a three-layer dry slope loaded at the paper's critical seismic coefficient kc = 0.155, noncircular search. |
| 64 | Embankment, (4) materials, water table, tension crack | built | vp064.xlsx. USACE EM 1110-2-1902 Fig. 4-1 end-of-construction dam (4 materials, core trench, water table, 7-ft crack) on the specified circle; crest placement pinned from USACE's printed slice table. |
| 65 | Embankment, (4) materials, water table, ponded water | built | vp065.xlsx. USACE Fig. 4-2: the #64 dam, drained strengths, upstream low pool (el 20): Bishop 2.725 vs Slide 2.716 / USACE 2.71; Spencer 2.748 vs 2.736. |
| 66 | Embankment, (4) materials, water table, ponded water | built | vp066.xlsx. USACE Fig. 4-3 chart-check set; Slide's own face geometry recovered from its printed slip endpoints (toe −222, crest edge −15): Spencer 2.258 vs Slide 2.307 / USACE 2.30 (−2.1%). |
| 67 | Embankment, (2) materials | built | vp067.xlsx. USACE EM 1110-2-1902 example F-5 end-of-construction embankment: specified toe circle — Spencer 1.316 vs Slide 1.328 / USACE 1.33; Bishop 1.320 vs 1.332. |
| 68 | Embankment, (3) materials, ponded water | built | vp068.xlsx. USACE example E-10 (φ=0 three-layer slope, 8-ft pond, specified base-tangent circle): Bishop 1.234 / M-P 1.234 vs Slide 1.241 / GLE 1.244. |
| 69 | Embankment, (2) materials, water table, ponded water | built | vp069.xlsx. USACE example F-6 steady-seepage dam (piezometric line, ponded tailwater, specified R=280 circle): Bishop 1.999 / Spencer 2.013 / M-P 2.013 vs Slide 2.011 / 2.026 / GLE 2.027, USACE 2.01. |
| 70 | Submerged slope, homogenous, water table, ponded water | built | vp070a.xlsx / vp070b.xlsx. Duncan & Wright (2005) Fig. 6.27 fully submerged slope at two pool depths — the example demonstrating that FS is independent of submergence depth. |
| 71 | Slope, homogenous, finite element groundwater seepage analysis, water table | built | vp071a.xlsx (FE seepage) / vp071b.xlsx (piezometric line). Duncan & Wright (2005) Figs. 6.37–6.38: the same slope solved with pore pressures from XSLOPE's own FE seepage and from a piezometric line — the two must agree. |
| 72 | Embankment dam, (4) materials, finite element groundwater seepage analysis, ponded water | built | vp072a.xlsx (FE seepage) / vp072b.xlsx (piezo line). Duncan & Wright (2005) Figs. 6.39–6.40: a dam on a layered foundation (clay over sand) where underseepage produces artesian uplift under the downstream shell, which a single piezometric line cannot represent. |
| 73 | Excavated slope, (4) materials, tension crack | built | vp073.xlsx. The Bradwell reactor-1 excavated slope (Skempton & LaRochelle 1965): London Clay in six sublayers of depth-increasing undrained strength (cp) under a cracked clay fill. |
| 74 | Embankment, (2) materials | built | vp074.xlsx. D&W (2005) Fig. 7.12 sand embankment on saturated clay: search Bishop 1.219 / Spencer 1.194 vs Slide 1.228 / 1.201, D&W 1.22 / 1.19. |
| 75 | Dyke, (4) materials | built | vp075.xlsx. The James Bay dyke (Duncan & Wright 2005 Fig. 7.16): a granular berm embankment on soft crust / marine clay / lacustrine clay — the corpus's local-minimum showcase. Also SLOPE/W §2.44 — same problem in the GeoStudio corpus. |
| 76 | Embankment dam, homogenous, finite element groundwater seepage analysis, ponded water | built | vp076a.xlsx (FE seepage) / vp076b.xlsx (piezometric line). Duncan & Wright (2005) Fig. 7.19 homogeneous dam with a full-face pool, pore pressures modelled both ways (a shallow toe surface hypersensitive to the line elevation — see section). |
| 77 | Dam, (2) materials, finite element groundwater seepage analysis, ponded water | built | vp077a.xlsx (FE seepage) / vp077b.xlsx (piezo line). Duncan & Wright (2005) Fig. 7.24 thick-core dam (100:1 shell/core permeability contrast), pore pressures modelled both ways on the deep base-tangent circles. |
| 78 | Slope, homogenous | built | vp078.xlsx. Duncan & Wright (2005) Fig. 14.3 pure-cohesive (φ=0) slope on a 30-ft foundation; the free search finds the deep base-tangent circle. |
| 79 | Slope, (2) materials, infinite slope failure | built | vp079.xlsx. D&W (2005) Fig. 14.4 cohesionless embankment on a φ=0 foundation: base-tangent circle Bishop 1.407 / Spencer 1.397 vs Slide 1.412 / 1.400, D&W 1.40. |
| 80 | Embankment, (6) materials | built | vp080a.xlsx / vp080b.xlsx. D&W (2005) Fig. 14.5 six-layer stratified foundation, circles from (142,147): tangent-0 Spencer 2.530 vs Slide 2.545 / D&W 2.56; tangent-15 Spencer 1.352 vs Slide 1.359 / D&W 1.35. |
| 81 | Embankment, (2) materials, infinite slope failure | built | vp081.xlsx. D&W (2005) Fig. 14.7 embankment on a φ=0 foundation: base-tangent circle Bishop 1.223 / Spencer 1.204 vs Slide 1.230 / 1.209, D&W 1.21. |
| 82 | Embankment, (2) materials, water table | built | vp082.xlsx. D&W Fig. 14.20-a embankment with a water table; free circular search. Bishop 1.521 / Spencer 1.533 vs Slide 1.533 / 1.540, D&W 1.535. |
| 83 | Embankment, (2) materials | built | vp083a.xlsx (cu=200+15·z) / vp083b.xlsx (cu=300). Duncan & Wright (2005) Fig. 14.20-b embankment on an undrained foundation, two strength profiles (the depth-increasing one via cp). |
| 84 | Embankment, (2) materials | built | vp084a–d. Duncan & Wright (2005) Fig. 15.9 embankment on an undrained foundation with cu=300+cz·z, swept over four strength gradients (cz=0/5/10/15 psf/ft). |
| 85 | Reinforced slope, homogenous, grouted tieback | built | vp085a.xlsx (active) / vp085b.xlsx (passive). Duncan & Wright (2005) Fig. 6.34: one 9,000 lb/ft horizontal tieback at mid-height of an undrained clay slope, on Slide's printed critical circles. |
| 86 | Reinforced slope, homogenous, grouted tieback | built | vp086.xlsx. Duncan & Wright (2005) Fig. 7.28 / STABGM reinforced fill on rock: five 800 lb/ft geogrids. Circular search: Bishop 1.617 / Spencer 1.611 vs Slide 1.629 / 1.620; D&W reference 1.61. |
| 87 | Retaining wall, (3) materials, geotextile | built | vp087.xlsx. Baseline three-tier wall (Ta=10, L=6.3): Bishop 1.031 on Slide's printed circle vs Slide 1.040; free search 0.99 vs L&H 0.99–1.00. |
| 88 | Retaining wall, (3) materials, geotextile | built | vp088.xlsx. Fill-quality case (φ=25, Ta=22): Spencer 1.057 vs Slide 1.043. |
| 89 | Retaining wall, (3) materials, geotextile | built | vp089.xlsx. Reinforcement-length case (L=4.2, Ta=11.4): Spencer 1.011 (≈L&H design intent 1.0); with Slide's actual baseline Ta=10 supports: 0.980 vs Slide 0.971. |
| 90 | Retaining wall, (3) materials, geotextile | built | vp090.xlsx. Two reinforcement types (7.5 upper 8 / 11.0 lower 7): Bishop 1.012 vs Slide 1.004. |
| 91 | Retaining wall, (3) materials, geotextile | built | vp091.xlsx. Weak foundation (c=0, φ=18): deep bearing circle, Spencer 0.960 vs Slide 0.964. |
| 92 | Retaining wall, (3) materials, geotextile | built | vp092.xlsx. Water table 3 m above foundation (drained fill + pond): with Ta=10, Bishop 1.039 vs Slide 1.037; at the paper's Ta=9.25: 1.010 ≈ L&H 1.01. |
| 93 | Retaining wall, (3) materials, distributed load, geotextile | built | vp093.xlsx. 20 kPa crest surcharge, Ta=10 (Slide's and the RS2 vendor .fez's value): Bishop 0.961 vs Slide 0.958. At the L&H paper's design Ta=11.6, Bishop is 1.017 ≈ L&H 1.02. |
| 94 | Retaining wall, (3) materials, geotextile | built | vp094.xlsx. Five 1.8-m tiers (Ta=10.1): Bishop 1.020 on Slide's printed circle vs Slide 1.040. |
| 95 | Embankment dam, homogenous, rapid drawdown, water table | not supported | USACE EM 1110-2-1902 (1970) App. G example, analyzed with the Corps 2-stage rapid-drawdown method and its R-envelope (Slide 1.347, USACE 1.35). XSLOPE does not support the 2-stage method: it implements the Duncan, Wright & Wong (1990) 3-stage procedure that superseded it, verified on the same dam and six other drawdown problems in VP96–VP102. |
| 96 | Embankment dam, homogenous, rapid drawdown, water table | built | vp096.xlsx. USACE EM 1110-2-1902 (2003) Appendix G example, pool 103→24, Kc=1 envelope on a specified circle — the corpus's first Duncan-Wright-Wong 3-stage rapid-drawdown problem. Also SLOPE/W §2.41 — same problem in the GeoStudio corpus. |
| 97 | Embankment dam, homogenous, rapid drawdown, water table | built | vp097.xlsx. Pilarcitos Dam (Duncan, Wright & Wong 1990), drawdown 72→37 ft, Kc=1 envelope from D&W eqs 9.6–9.7 — the dam that actually failed in drawdown, at FS≈1. Also SLOPE/W §2.43 — same problem in the GeoStudio corpus. |
| 98 | Embankment dam, (5) materials, rapid drawdown, water table | built | vp098.xlsx. Walter Bouldin Dam (Duncan, Wright & Wong 1990) — a 5-zone rolled earthfill dam that failed during a 1975 drawdown; Kc=1 envelopes from the paper's Table 2, DWW 3-stage. Also SLOPE/W §2.40 — same problem in the GeoStudio corpus. |
| 99 | Embankment dam, (3) materials, rapid drawdown, water table | built | vp099.xlsx. Duncan, Wright & Wong (1990) hypothetical pumped-storage dam, drawdown 285→120. Geometry re-pinned from the vendor GeoStudio .gsz (§2.42): DWW 3-stage Spencer 1.527 vs Slide 1.534 / SLOPE/W 1.550 / DWW 1.56. Also SLOPE/W §2.42 — same problem in the GeoStudio corpus. |
| 100 | Embankment dam, homogenous, rapid drawdown, water table | built | vp100.xlsx. Morgenstern (1963) chart problem, complete drawdown (100→0) with B̄=1 — the residual pore-pressure field maps onto a piezometric line at the slope surface, so it runs single-stage. |
| 101 | Embankment dam, homogenous, rapid drawdown, water table | built | vp101.xlsx. Morgenstern (1963), drawdown 100→50 ft, B̄=1 (piezo = ground above the pool, 50 below it; remaining pond on the face). Bishop 1.416 vs Slide 1.417 (exact) and Morgenstern chart 1.41. |
| 102 | Embankment dam, homogenous, rapid drawdown | partial | vp102a.xlsx (dry) / vp102b.xlsx (initial steady seepage). Huang & Jia (2008) earth dam; only these two end members are reproducible — the rest is a transient unsaturated drawdown series XSLOPE's steady-state seepage cannot represent (see section). |
| 103 | Undrained slope, multi-model optimization (MMO) | planned | |
| 104 | Newmark analysis, seismic analysis, multi-modal optimization (MMO) | planned | |
| 105 | Anisotropic surface, multi-modal optimization (MMO) | planned | |
| 106 | Support, Ito & Matsui pile | built (5 cases) | vp106a–e. Cai & Ugai (2000) pile-reinforced slope at pile spacings of 2–6 diameters; the Ito & Matsui (1975) limit pressure is auto-computed from pile diameter and spacing. |
| 107 | Retaining walls, gabion walls, supports | built | vp107a (equivalent cohesion) / b (mesh method). Cao et al. (2016) Vancouver gabion-wall failure; Slide models the steel mesh two ways, evaluated on its printed critical circle. |
| 108 | Retaining walls, gabion walls, supports | built | vp108a / b. Stepped gabion wall (steps out) on Slide's printed critical circles: equivalent-cohesion Bishop 1.790 vs Slide 1.787; mesh 1.830 vs 1.835. Spencer within 0.3% on both. |
| 109 | Retaining walls, gabion walls, weak layers | built | vp109.xlsx. The VP108 wall with weak joint bands (c=20.4, φ=37.8) between courses: Bishop 1.790 / Spencer 1.797 on the deep circle vs Slide's block search along the joints 1.799 / 1.803 — the joints don't govern overall stability. |
| 110 | Retaining walls, equivalent fluid pressure | blocked | Verifies Slide's EFP support type against a triangular distributed load (Spencer 2.566 both ways). The manual prints neither soil properties nor coordinates (the model is Slide's tutorial file), so there is nothing independent to lock; the equivalence it demonstrates — wall restraint as a boundary pressure — is how XSLOPE models EFP walls directly (dloads). |
| 111 | Helical anchor | no lock possible | Slide's problem 111 verifies its helical-anchor capacity envelope (Perko 2009), not a slope — no slope and no factor of safety to lock. Helically anchored slopes are analyzed in XSLOPE by entering the governing capacity as a standard anchor force — see the worked note. |
Problem details
Each built problem below shows the XSLOPE inputs (with coordinate labels) beside a representative solved surface. The build scripts live in benchmarks/rocscience/build_problems.py (the FE-seepage problem #38, which solves its own steady unsaturated field and writes the _mesh.json / _seep.csv sidecars, has its own builder benchmarks/rocscience/build_vp038.py); the figures are regenerated by benchmarks/rocscience/make_figures.py.
VP1: Slope, homogeneous (ACADS 1(a))
This is the headline limit-equilibrium verification benchmark, from the ACADS slope stability program review (Donald & Giam, 1989; Giam & Donald, 1992), as documented in the GeoStudio SLOPE/W Verification Manual (Oct 2022). A simple homogeneous slope analyzed with a circular search; the ACADS consensus answer is FOS ≈ 1.00, making percent differences easy to read.
| Property | Value |
|---|---|
| Slope | 2:1, 10 m high, with a bench |
| Cohesion, \(c'\) | 3.0 kPa |
| Friction angle, \(\phi'\) | 19.6° |
| Unit weight, \(\gamma\) | 20.0 kN/m³ |
| Pore pressure | none (total stress) |
Excel input file: xslope_acads_simple.xlsx
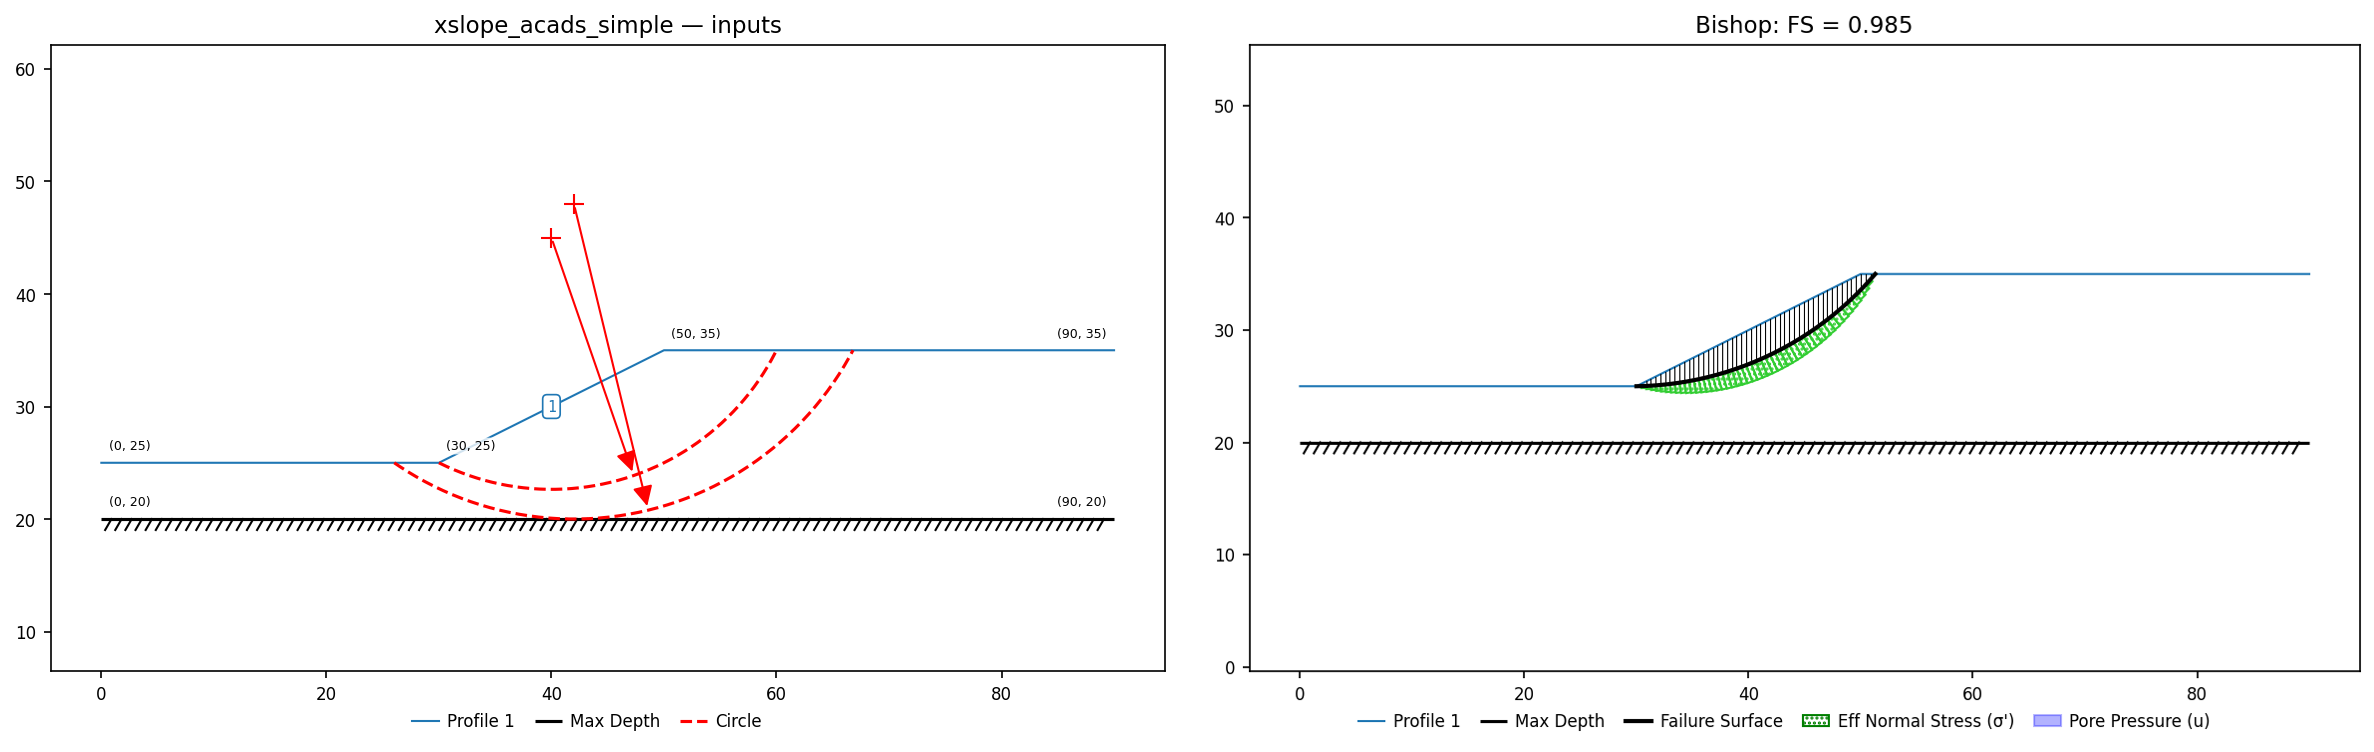
XSLOPE results for all six methods (automated critical-circle search, 50 slices, each method searched independently):
| Method | XSLOPE FOS | Reference | Diff |
|---|---|---|---|
| Ordinary (OMS) | 0.942 | 1.00 | -5.8% |
| Bishop's Simplified | 0.985 | 1.00 | -1.5% |
| Simplified Janbu | 0.986 | 1.00 | -1.4% |
| Corps of Engineers | 0.990 | 1.00 | -1.0% |
| Lowe & Karafiath | 0.987 | 1.00 | -1.3% |
| Spencer | 0.984 | 1.00 | -1.6% |
| Morgenstern-Price | 0.984 | 1.00 | -1.6% |
All rigorous methods fall within the ACADS accepted band; OMS reads low, as expected for the legacy method (its conservative bias on this class of problem is why it is reported for completeness only).
Sources: Donald, I.B. & Giam, P. (1989), Soil slope stability programs review, ACADS, Melbourne; Giam, P. & Donald, I.B. (1992); GeoStudio SLOPE/W Verification Manual (Oct 2022), ACADS suite.
Factor of safety by method (each method's own critical surface):
| OMS | Bishop | Janbu | Corps | Lowe | Spencer | M-P |
|---|---|---|---|---|---|---|
| 0.942 | 0.985 | 0.986 | 0.990 | 0.987 | 0.984 | 0.984 |
VP2: Slope, homogenous, tension crack
ACADS 1(b) (Giam & Donald 1989): the 1(a) slope with c'=32, phi'=10, gamma=20 and a water-filled tension crack of depth 2c/(gamma*sqrt(ka)) [Craig 1997]. Slide2: Bishop 1.596, Spencer 1.592, Janbu corrected 1.489, GLE 1.592; Giam reference 1.65.
Input files: vp002.xlsx
| Method | XSLOPE | Published |
|---|---|---|
| Bishop | 1.589 | Slide 1.596; SLOPE/W 1.664 |
| Janbu (corrected) | 1.495 | Slide 1.489 |
| Spencer | 1.585 | Slide 1.592 |
| Morgenstern-Price | 1.586 | Slide 1.592; SLOPE/W 1.660 |
ACADS reference band 1.65–1.70 (Giam & Donald).
VP3: Slope, (3) materials
ACADS 1(c): non-homogeneous three-layer slope, critical circle. Slide2: Bishop 1.405, Spencer 1.375, GLE 1.374, Janbu corrected 1.357; SLOPE/W: Bishop 1.414, M-P 1.382; ACADS reference 1.39.
Input files: vp003.xlsx
| Method | XSLOPE | Published |
|---|---|---|
| Bishop | 1.403 | Slide 1.405; SLOPE/W 1.414 |
| Janbu (corrected) | 1.354 | Slide 1.357 |
| Spencer | 1.372 | Slide 1.375 |
| Morgenstern-Price | 1.371 | Slide 1.374; SLOPE/W 1.382 |
ACADS reference 1.39.
VP4: Slope, (3) materials, seismic
ACADS 1(d): problem #3 plus horizontal seismic coefficient 0.15. Slide2: Bishop 1.016, Spencer 0.991, GLE 0.989, Janbu corrected 0.965; SLOPE/W: Bishop 1.02, M-P 0.989; ACADS reference 1.00.
Input files: vp004.xlsx
| Method | XSLOPE | Published |
|---|---|---|
| Bishop | 1.013 | Slide 1.016; SLOPE/W 1.02 |
| Janbu (corrected) | 0.963 | Slide 0.965 |
| Spencer | 0.989 | Slide 0.991 |
| Morgenstern-Price | 0.987 | Slide 0.989; SLOPE/W 0.989 |
ACADS reference 1.00.
VP5: Dam, (4) materials
ACADS 2(a) (Giam & Donald 1989): Talbingo Dam at end of construction, 4 zones, critical circular surface. Slide2: Bishop 1.948, Spencer 1.948, GLE 1.948, Janbu corrected 1.949; Giam reference 1.95. The minimum is a shallow slide parallel to the (steeper) upstream face.
Input files: vp005.xlsx
| Method | XSLOPE | Published |
|---|---|---|
| Bishop | 1.955 | Slide 1.948; SLOPE/W 1.951 |
| Janbu (corrected) | 1.965 | Slide 1.949 |
| Spencer | 1.955 | Slide 1.948 |
| Morgenstern-Price | 1.955 | Slide 1.948 |
Critical mechanism is the infinite-slope limit: tan φ′/tan β = 1.9475.
VP6: Dam, (4) materials, predefined slip surface
ACADS 2(b): Talbingo Dam, single specified circle Xc=100.3, Yc=291.0, R=278.8 (Table 6.1). Slide2: Bishop 2.208, Spencer 2.292, GLE 2.301, Janbu corrected 2.073; Giam reference 2.29.
Input files: vp006.xlsx
| Method | XSLOPE | Published |
|---|---|---|
| Bishop | 2.206 | Slide 2.208; SLOPE/W 2.207 |
| Janbu (corrected) | 2.073 | Slide 2.073 |
| Spencer | 2.290 | Slide 2.292 |
| Morgenstern-Price | 2.299 | Slide 2.301; SLOPE/W 2.299 |
ACADS reference 2.29.
VP8: Slope, (2) materials, weak layer, predefined slip surface
ACADS 3(b): the weak-layer slope (= LEM sample 13 / Slide #7) with the fully specified non-circular surface of Table 8.2. Slide2: Spencer 1.277, GLE 1.262, Janbu corrected 1.294; SLOPE/W: Bishop 1.259, M-P 1.261; Giam reference 1.34.
Input files: vp008.xlsx
| Method | XSLOPE | Published |
|---|---|---|
| Janbu (corrected) | 1.294 | Slide 1.294 |
| Spencer | 1.276 | Slide 1.277 |
| Morgenstern-Price | 1.260 | Slide 1.262; SLOPE/W 1.261 |
Giam reference 1.34.
VP9: Slope, (2) materials, weak layer, water table, distributed load
ACADS 4 (Slide #9): weak-layer slope + piezometric surface (Table 9.3) + two surcharge strips (Table 9.2: 20 kPa on the lower bench x=23-43, 20->40 kPa ramp on the crest x=70-80). Non-circular search. Slide2 (block search, no optimization): Spencer 0.760, GLE 0.720, Janbu corrected 0.734; with optimization 0.683-0.707; SLOPE/W: Bishop 0.699, M-P 0.689; Giam reference 0.78; Slope 2000 GLE reference 0.6878. The published spread is wide - this is a search-difficulty benchmark.
Input files: vp009.xlsx
| Method | XSLOPE | Published |
|---|---|---|
| Janbu (corrected) | 0.718 | Slide 0.734 / 0.699 |
| Spencer | 0.724 | Slide 0.760 (block) / 0.707 (optimized) |
SLOPE/W Bishop 0.699, M-P 0.689; ACADS 0.6878 (Slope 2000), 20-program mean 0.808 — a wide published band.
VP14: Slope, homogeneous (Arai & Tagyo ex. 1)
From Arai & Tagyo (1985), Soils and Foundations 25(1), and republished by Greco (1996), Malkawi et al. (2001), and Kim et al. (2002); also SLOPE/W Verification Manual sec. 2.11. A homogeneous 1.5:1 slope, 20 m high, with c = 41.65 kPa, φ = 15.0°, γ = 18.82 kN/m³ (total stress). Published FOS ≈ 1.451.
Excel input file: xslope_arai_tagyo.xlsx
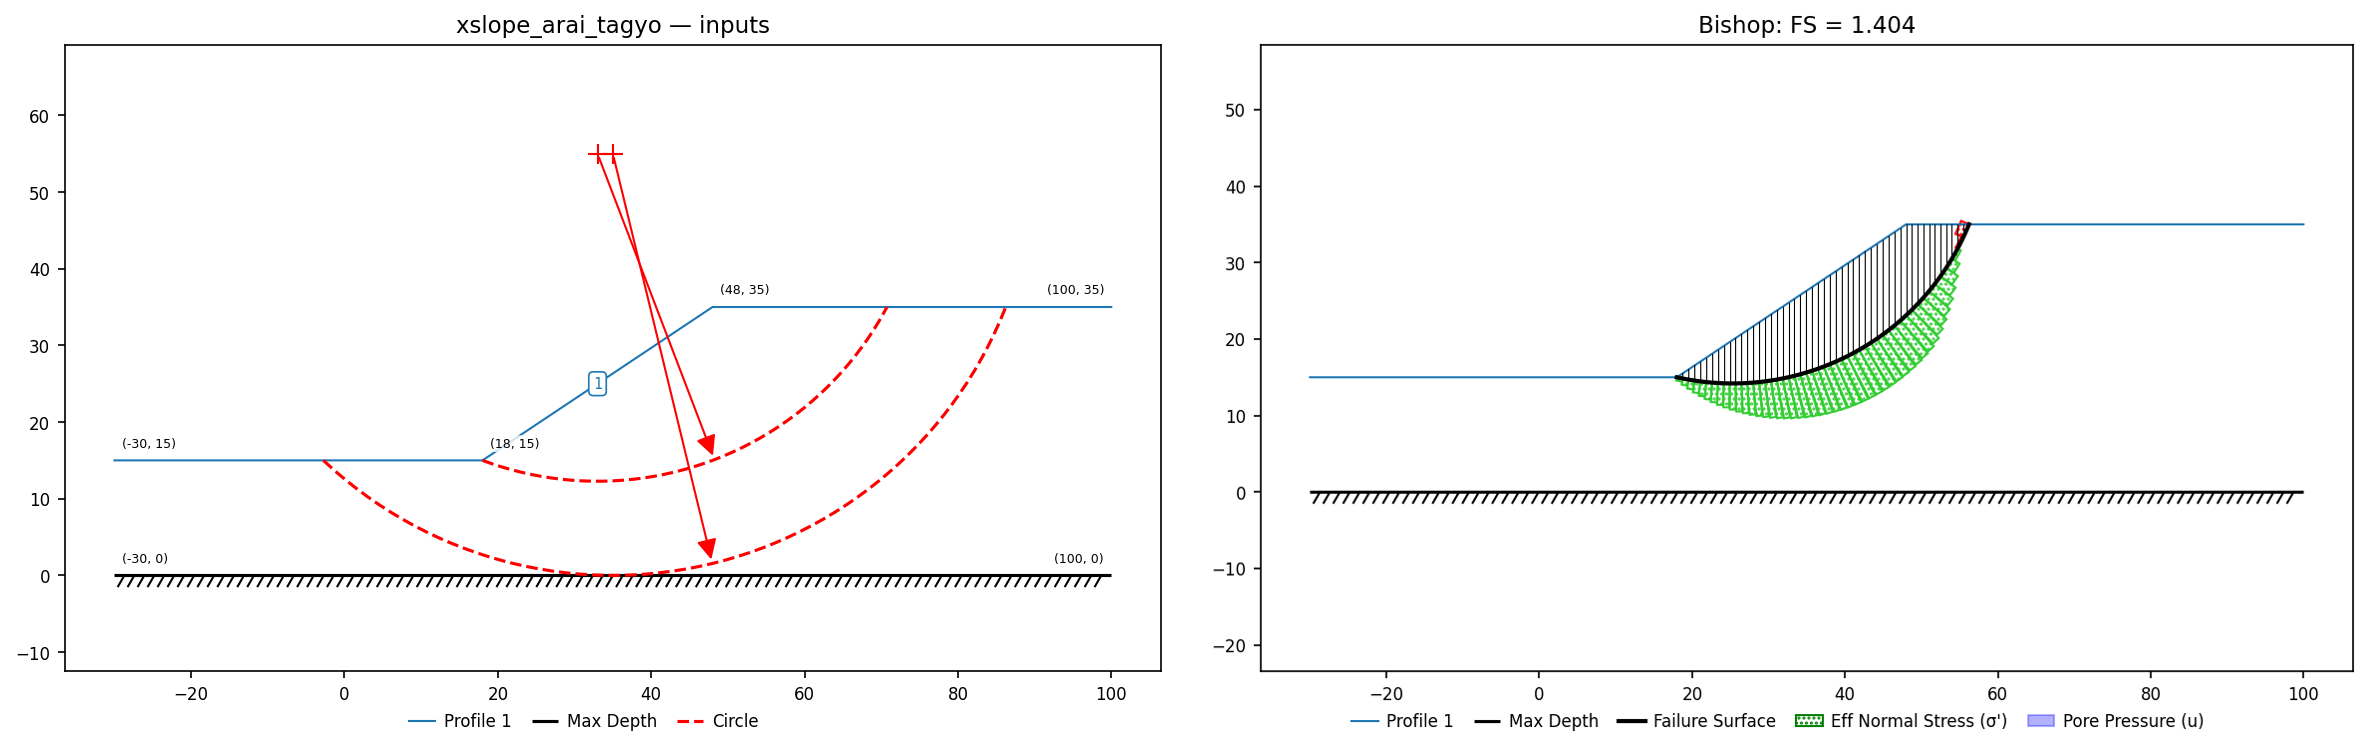
Results for all six methods (automated critical-circle search, 50 slices):
| Method | XSLOPE FOS | Reference | Diff |
|---|---|---|---|
| Ordinary (OMS) | 1.344 | 1.451 | -7.4% |
| Bishop's Simplified | 1.404 | 1.451 | -3.2% |
| Simplified Janbu | 1.411 | 1.451 | -2.8% |
| Corps of Engineers | 1.476 | 1.451 | +1.7% |
| Lowe & Karafiath | 1.438 | 1.451 | -0.9% |
| Spencer | 1.401 | 1.451 | -3.4% |
| Morgenstern-Price | 1.400 | 1.451 | -3.5% |
Source: Arai, K. & Tagyo, K. (1985). Determination of noncircular slip surface giving the minimum factor of safety in slope stability analysis. Soils and Foundations 25(1):43-51. doi:10.3208/sandf1972.25.43. Republished in Greco (1996), Malkawi et al. (2001), and Kim et al. (2002); also SLOPE/W Verification Manual sec. 2.11.
Factor of safety by method (each method's own critical surface):
| OMS | Bishop | Janbu | Corps | Lowe | Spencer | M-P |
|---|---|---|---|---|---|---|
| 1.344 | 1.404 | 1.411 | 1.476 | 1.438 | 1.401 | 1.400 |
VP10: Slope, homogenous, pore pressure grid, ponded water
Input files: vp010.xlsx (+ seepage sidecars)
ACADS problem #5 (Giam & Donald 1989): a slope excavated at 1:2 below initially horizontal ground, analyzed for the long-term condition with 1 m of ponded water over the excavation floor. The survey supplied pore pressures either as boundary conditions or as an approximate flow net; Slide interpolates a pore-pressure grid digitized from the net, while XSLOPE solves the seepage problem itself (specified head 26 on the submerged boundary, the labeled far-field water table as head 32 on the right edge, a seepage exit face above the waterline). The head field in a homogeneous steady problem is independent of conductivity, so the solution is fully determined by the figure's boundary conditions; the solved phreatic surface matches the manual's flow net within about 0.1 m across the section.
| Method | XSLOPE (FE seepage) | Slide (grid) | ACADS |
|---|---|---|---|
| Bishop | 1.500 | 1.498 | reference 1.53, survey mean 1.464 |
| Spencer | 1.501 | 1.500 | — |
| Janbu corrected | 1.440 | 1.457 | — |
VP15: Slope, (3) materials, weak layer
Slide #15: Arai & Tagyo (1985) example 2 - three layers with a weak (c=9.8, phi=5) middle band, no water. Circular search. Slide2 (auto refine): Bishop 0.420, Spencer 0.409, GLE 0.437, Janbu corrected 0.423; A&T Bishop 0.417; Kim et al. 0.43.
Input files: vp015.xlsx
| Method | XSLOPE | Published |
|---|---|---|
| Bishop | 0.419 | Slide 0.420; A&T 0.417 |
| Janbu (corrected) | 0.436 | Slide 0.423; A&T 0.430 |
| Spencer | 0.422 | Slide 0.409 |
| Morgenstern-Price | 0.420 | Slide (GLE) 0.437 |
Kim et al. (2002) 0.43.
VP16: Slope, homogenous, water table
Slide #16: Arai & Tagyo (1985) example 3 - homogeneous slope with a water table. Circular search. Slide2 (auto refine): Bishop 1.118, Janbu simplified 1.046, Janbu corrected 1.131, Spencer 1.118; A&T Bishop 1.138.
Input files: vp016.xlsx
| Method | XSLOPE | Published |
|---|---|---|
| Bishop | 1.112 | Slide 1.118; A&T 1.138 |
| Janbu (corrected) | 1.122 | Slide 1.131 |
| Spencer | 1.113 | Slide 1.118 |
| Morgenstern-Price | 1.111 | — |
SLOPE/W reports 1.190, the outlier of the four sources.
VP17: Slope, homogenous
Slide #17: Yamagami & Ueta (1988) homogeneous slope, dry. Circular: Slide Bishop 1.344, Ordinary 1.278 (Y&U 1.348 / 1.282). Non-circular: Slide Spencer 1.325 (Y&U 1.339, Greco 1.33).
Input files: vp017.xlsx
| Method | XSLOPE | Published |
|---|---|---|
| Ordinary | 1.274 | Slide 1.278; Y&U 1.282 |
| Bishop | 1.342 | Slide 1.344; Y&U 1.348 |
| Spencer | 1.340 | published non-circular 1.325–1.339 |
Our local non-circular search reaches 1.394 — same search-power note as VP19/VP20.
VP18: Slope, homogenous slope, ru pore pressure
Slide #18: Spencer (1969) / Baker (1980) homogeneous slope with ru=0.5, non-circular critical surface. The slope descends left-to-right (a right-facing case). Slide2 (random search + Monte Carlo optimization): Spencer 1.010; Baker reference 1.02; Spencer (1969) 1.08.
Input files: vp018.xlsx
| Method | XSLOPE | Published |
|---|---|---|
| Spencer | 1.033 | Slide 1.010 (MC-optimized); Baker 1.02; Spencer (1969) 1.08 |
| Morgenstern-Price | 1.024 | — |
VP19: Slope, (4) materials
Slide #19: Greco (1996) ex. 4 / Yamagami & Ueta (1988) four-layer slope, no water, non-circular critical surface. Slide2 (random search + Monte-Carlo optimization, convex): Spencer 1.398; Greco and Yamagami & Ueta references 1.40-1.42.
Input files: vp019.xlsx
| Method | XSLOPE | Published |
|---|---|---|
| Bishop | 1.448 | — |
| Spencer | 1.429 | Greco / Y&U 1.40–1.42; Slide MC 1.398 |
Circular-search values; the local non-circular search plateaus ~1.45 (search-power gap).
VP20: Slope, (4) materials, weak layer, water table
Slide #20: Greco (1996) ex. 5 / Chen & Shao (1988): four layers with a 0.5 m weak seam along the inclined model base, water table. Polygon-zone geometry (the base is not horizontal). Slide2: circular (toe focus grid) Bishop 1.087, Spencer 1.093; non-circular (block search in seam + MC optimization) Spencer 1.010; Chen & Shao 1.01-1.03; Greco 0.973-1.1.
Input files: vp020.xlsx
| Method | XSLOPE | Published |
|---|---|---|
| Bishop | 1.086 | Slide 1.087 |
| Spencer | 1.082 | Slide 1.093; Greco 1.08 |
Non-circular seam block: local search 1.082 vs Slide MC 1.010, Chen & Shao 1.01–1.03.
VP21: Slope, homogeneous, ru pore pressure (Fredlund & Krahn 1977)
Slide #21: Fredlund & Krahn (1977)'s classic homogeneous slope — the reference problem that VP22 extends with a weak seam. A single fixed circle, center (120, 90), R = 80, in imperial units, solved for all three of F&K's pore-pressure cases: dry, ru = 0.25, and a piezometric water table. F&K published all four method values for every case.
Input files: vp021a.xlsx (dry), vp021b.xlsx (ru = 0.25), vp021c.xlsx (water table)
| Method | XSLOPE (dry) | Published (dry) | XSLOPE (ru) | Published (ru) |
|---|---|---|---|---|
| Ordinary | 1.927 | F&K 1.928 | 1.606 | F&K 1.607 (Slide 1.687) |
| Bishop | 2.075 | F&K 2.080 | 1.759 | F&K 1.766 |
| Spencer | 2.071 | F&K 2.073 | 1.757 | F&K 1.761 |
| Morgenstern–Price | 2.071 | F&K 2.076 | 1.756 | F&K 1.764 |
Case 3 adds F&K's piezometric line, read from the Slide2 model itself — the
vendor RS2 "Slide2 Import" of Slide #21 carries it verbatim in its piezos
block. The line enters the crest face at el. 40, descends to meet the ground at
the slope toe (140, 20) and runs along the toe bench: coordinates
(0, 40) — (140, 20) — (180, 20).
| Method | XSLOPE (water table) | F&K | Slide |
|---|---|---|---|
| Ordinary | 1.693 | 1.693 | 1.716 |
| Bishop | 1.829 | 1.834 | 1.833 |
| Spencer | 1.827 | 1.830 | 1.831 |
| Morgenstern–Price | 1.826 | 1.832 | 1.831 |
XSLOPE reproduces Fredlund & Krahn's own Ordinary-method value exactly in both the ru case (1.606 vs 1.607) and the water-table case (1.693 vs 1.693), where Slide reads 1.687 and 1.716; the rigorous methods agree with both F&K and Slide to within 0.006.
VP22: Slope, (2) materials, weak layer, composite surface
Slide #22: the Fredlund & Krahn (1977) slope of #21 with a 1-ft weak seam (c'=0, φ'=10°) between el. 16 and the impenetrable base at el. 15. This is the corpus's composite-surface benchmark. F&K's circle — center (120, 90), R = 80 — bottoms out at el. 10, five feet below the base, so it cannot be used as a circle at all: the slip surface descends on the arc until it meets the base, runs horizontally along the weak seam, and climbs back out on the arc. Here 30 of the 59 slices sit on the seam.
Two cases: dry, and ru = 0.25 in both materials.
Input files: vp022a.xlsx (dry), vp022b.xlsx (ru = 0.25)
| Method | XSLOPE (dry) | Published (dry) | XSLOPE (ru) | Published (ru) |
|---|---|---|---|---|
| Ordinary | 1.297 | Slide 1.300; F&K 1.288 | 1.037 | F&K 1.029 (Slide 1.121) |
| Bishop | 1.380 | Slide 1.382; F&K 1.377 | 1.121 | Slide 1.124; F&K 1.124 |
| Spencer | 1.379 | Slide 1.382; F&K 1.373 | 1.122 | Slide 1.124; F&K 1.118 |
| Morgenstern–Price | 1.370 | Slide (GLE) 1.372; F&K 1.370 | 1.112 | Slide (GLE) 1.114; F&K 1.118 |
Every method agrees with Slide to within 0.004 except the Ordinary method with ru, where XSLOPE (1.037) reproduces Fredlund & Krahn's own published value (1.029) rather than Slide's (1.121). The Ordinary method has no unique treatment of pore pressure — it takes N' = W·cosα − u·Δℓ from equilibrium perpendicular to the base, which on the near-horizontal seam drives N' far down — and the published values themselves split on it. The three methods that satisfy real equilibrium all agree.
VP23: Slope, (3) materials
Slide #23: Low (1989) slope over two undrained layers; the lower layer's cu grows linearly 15->30 kPa from y=4 to y=0 (xslope 'cp' option: Su = c + cp*(r_elev - y)). Circular search. Slide2: Ordinary 1.370, Bishop 1.192; Low 1.36 / 1.14; Kim (2002) 1.17.
Input files: vp023.xlsx
| Method | XSLOPE | Published |
|---|---|---|
| Ordinary | 1.357 | Slide 1.370; Low 1.36 |
| Bishop | 1.130 | Slide 1.192; Low 1.14; Kim 1.17 |
Published Bishop values themselves spread 1.14–1.19 on this deep φ=0 problem.
VP24: Slope, (3) materials
Slide #24: Low (1989) three-layer undrained slope (phi=0). Circular search. Slide2: Ordinary 1.439, Bishop 1.439; Low reference 1.44 both.
Input files: vp024.xlsx
| Method | XSLOPE | Published |
|---|---|---|
| Ordinary | 1.435 | Slide 1.439; Low 1.44 |
| Bishop | 1.435 | Slide 1.439; Low 1.44 |
Geometry follows the RS2 vendor .fez: three equal 4.5 m layers (crest y = 13.5, bench
y = 7.5, slope break x = 33.5).
VP25: Prandtl bearing mechanism on a 60° slope (Chen & Shao 1988)
Slide #25 / Chen & Shao (1988): the classical plasticity problem — a weightless, frictionless 10-m slope at 60° (c = 49 kPa, γ = 10⁻⁶) loaded by the critical strip load q = 149.31 kPa over 10 m of crest, evaluated on the Prandtl slip surface (theoretical FS = 1.0). The surface is built analytically: a 45° active wedge from the load's right edge, a circular fan of radius 10/√2 centered on the load's left edge (tangent to both straight segments), and an exit through the face at Slide's printed endpoint (0.773, 1.340).
Input files: vp025.xlsx
| Method | XSLOPE | Published |
|---|---|---|
| Spencer | 1.052 | Slide 1.051; Chen & Shao 1.05; theory 1.0 |
| Morgenstern-Price (half-sine) | 1.069 | Slide GLE 1.009 (custom interslice function fit to the theoretical distribution) |
VP26: Prandtl bearing mechanism on level ground
Slide #26: the classical Prandtl footing problem — a weightless c = 20 soil (γ = 10⁻⁶, φ = 0) on level ground, loaded by a strip UDL of 102.83 over the crest. That load is exactly the ultimate bearing capacity c·Nc = 20·(2 + π) = 102.83, so the theoretical factor of safety is 1.0 by construction. The evaluation runs on the printed Prandtl surface (an active wedge, a logarithmic-spiral/circular fan, and a passive wedge), extracted with its end segments extended past the ground line.
This is the corpus's canonical level-ground bearing problem: its two ground crossings
sit at the same elevation, which the flat-arc facing rule now handles. The surface itself
is symmetric, so the facing is set by the load — offset to the loaded side — via the
right_facing override the rule exposes.
Input files: vp026.xlsx
| Method | XSLOPE | Published |
|---|---|---|
| Spencer | 1.043 | theory 1.0; Slide2 Spencer 0.941 |
| Morgenstern-Price (half-sine) | 1.051 | — |
| Lowe & Karafiath | 1.017 | — |
| Janbu (corrected) | 1.095 | — |
XSLOPE's methods bracket the exact theory FS of 1.0 (0.98–1.10), with Spencer at 1.043; Slide2 reads 0.941, ~10% below theory. The gap is a genuine interslice-convention difference on this degenerate flat-ground mechanism, not a discretization artifact — Spencer is stable from 8 to 200 slices, and densifying the analytic arc moves it away from Slide, toward theory. The lock is XSLOPE's own Spencer value, referenced against both anchors. The RS2 strength-reduction rendition of the same problem (RS2-21) independently converges on the theory value from the continuum side. Also SLOPE/W §2.16 — the same Prandtl problem in the GeoStudio corpus.
VP27: XSTABL slope with undulating bedrock and auto-Hu pore pressures
Slide #27 / XSTABL v5 reference manual (Sharma 1996), via Malkawi et al. (2001): a two-material slope over undulating bedrock (polygon-mode bottom), a zero-strength cap layer, and a water table, with soil 1 carrying distinct moist/saturated unit weights (116.4/124.2 pcf). Slide and XSTABL both apply the phreatic-inclination correction (u reduced by cos² of the local phreatic slope); building this problem added the matching piezometric-line Type flag (piezo | phreatic, template v13) to xslope. Evaluated on the specified circle (59.52, 219.21, R=157.68); all geometry vertices are labeled in Slide's figure, and the water table was pixel-traced (±2 ft).
Input files: vp027.xlsx
| Method | XSLOPE (phreatic Type) | Slide | XSTABL |
|---|---|---|---|
| Bishop | 1.369 | 1.396 | 1.397 |
| Janbu | 1.365 | 1.391 | 1.392 |
| Spencer | 1.375 | 1.402 | 1.403 |
| Morgenstern-Price | 1.371 | 1.398 | 1.399 |
| Corps #2 | 1.388 | 1.414 | 1.416 |
| Lowe & Karafiath | 1.386 | 1.411 | 1.413 |
A uniform −1.9% across all six methods (−3.0% with the plain static-head u=piezo), consistent with a small systematic difference in the digitized water table rather than any method-level disagreement — the method-to-method spread matches Slide/XSTABL exactly. The manual's tension-crack variants (analyses 3–4) are not built.
VP28: Excavated slope and embankment, probabilistic analysis
Input files: vp028a.xlsx (Congress St. Cut, shallow mode) · vp028b.xlsx (embankment, interface mode) · vp028c.xlsx (embankment, deep mode)
Chowdhury & Xu (1995) evaluate probabilities of failure for two slopes: the Congress Street Cut (Ireland 1954) — three frictionless clays under a sand cap whose strength is excluded — and an embankment on a soft clay foundation, each with slip circles tangent to two different layer boundaries. Slide's manual prints the critical circle (center and radius) for every case; those circles are evaluated here as fixed surfaces with Bishop's method, and reliability uses the Taylor-series procedure on the same surfaces.
| Case | XSLOPE FS | Slide FS | C&X FS | XSLOPE TSPM β_ln / PF | XSLOPE MC β_ln / PF | Slide RI_ln / MC PF | C&X PF |
|---|---|---|---|---|---|---|---|
| Congress St., tangent clay-2 base | 1.129 | 1.128 | 1.128 | 0.768 / 22.1% | 0.761 / 21.9% | 0.650 / 24.6% | 26.6% |
| Embankment, tangent interface | 1.158 | 1.160 | 1.1625 | 0.787 / 21.6% | 0.794 / 20.8% | 0.799 / 21.2% | 20.2% |
| Embankment, tangent foundation base | 1.177 | 1.185 | 1.1479 | 0.798 / 21.2% | 0.783 / 21.1% | 0.820 / 19.9% | 19.7% |
The XSLOPE MC column is a 10,000-sample Monte Carlo run on the same fixed circles and the same normal input distributions the Taylor series uses (seeded, so the values are regression-locked). It is the adjudication of the cross-source disagreement below: our own Taylor series and Monte Carlo, given identical inputs, land on top of each other — σ_F 0.163 vs 0.164 and β_ln 0.768 vs 0.761 on the Congress St. circle, and within ±0.015 of β_ln on all three cases.
Input provenance — the vendor SLOPE/W model settles it. C&X's paper states no unit
weights, so the manual notes Rocscience chose the clay unit weights to reproduce the
published deterministic FS. The Seequent .gsz for this problem (SLOPE/W
§2.17, 20 analyses) carries the actual calibrated values SLOPE/W used:
sand cap γ = 21, all three Congress-St. clays γ = 22, and — the layer the Slide
manual leaves unstated below clay-3 — a bed unit, c′ = 200 / φ′ = 35°, essentially
impenetrable. It also puts every cohesion σ as a per-material perturbation, and those are
C&X's own published statistics (Example 1 clays σ = 20.4 / 8.2 / 13.2, etc.). Two
corrections follow. First, the embankment (Example 5) is not uncalibrated: the .gsz
specifies it fully (fill c′ = 10 / φ′ = 12° / γ = 20, foundation clay c′ = 40 / φ′ = 0 /
γ = 18, over the bedrock), which is exactly what vp028b/c carry — those are calibrated
inputs, not free parameters. Second, the deep-circle indeterminacy dissolves: the
.gsz places the clay-3 base at el. −12.19 and the Layer-3 circle is tangent there, so
it rides the clay-3 base with the strong bed untouched — the "0.19 m into an unstated
layer" was a hand-digitizing artifact of the coarser committed section, not a real
sensitivity. (One provenance seam remains in the committed files: vp028a carries a
sand↔clay-1 γ swap [sand 22 / clay-1 21] that tunes it to Slide's printed FS of 1.128;
the vendor's un-swapped γ's read 1.132, a 0.3 % difference.)
SLOPE/W's own solved FS and probability of failure for all ten cases are in the .gsz
too, and XSLOPE reproduces them on the identical (imported) circles with the vendor σ's:
| Case (C&X example, tangent layer) | XSLOPE Bishop | SLOPE/W (M-P) | XSLOPE TSPM σ_F | SLOPE/W MC σ_F | SLOPE/W MC PF |
|---|---|---|---|---|---|
| Ex 1 Congress St., clay-2 (= locked row 1) | 1.129 | 1.132 | 0.192 | 0.190 | 25.3% |
| Ex 1 Congress St., clay-3 (deep) | 1.113 | 1.116 | 0.188 | 0.186 | 26.2% |
| Ex 2 Congress St. (Su set B), clay-2 | 1.108 | 1.110 | 0.041 | 0.041 | 0.4% |
| Ex 2 Congress St. (Su set B), clay-3 | 1.061 | 1.063 | 0.028 | 0.028 | 1.3% |
| Ex 3 Congress St. (Su set C), clay-2 | 2.244 | 2.248 | 0.378 | 0.377 | 0.04% |
| Ex 3 Congress St. (Su set C), clay-3 | 2.135 | 2.138 | 0.353 | 0.347 | 0.02% |
| Ex 4 Congress St. (drained c′-φ′), clay-2 | 1.444 | 1.422 | 0.211 | 0.210 | 2.4% |
| Ex 4 Congress St. (drained c′-φ′), clay-3 | 1.549 | 1.504 | 0.192 | 0.195 | 0.5% |
| Ex 5 embankment, interface (= locked row 2) | 1.159 | 1.158 | 0.197 | 0.198 | 21.0% |
| Ex 5 embankment, foundation (= locked row 3) | 1.176 | 1.178 | 0.218 | 0.222 | 21.4% |
The σ_F reconciliation. Evaluated on SLOPE/W's own critical surfaces with the vendor's own cohesion σ's, XSLOPE's Taylor-series σ_F matches SLOPE/W's Monte-Carlo σ_F to ≈ 1% on every one of the ten cases (0.192 vs 0.190 on Congress St., 0.041 vs 0.041, 0.378 vs 0.377, …). This resolves most of the cross-source σ_F spread the locked table above records (XSLOPE Taylor 0.163 vs Slide/C&X ≈ 0.19–0.21): it was largely the surface, not the estimator or the input family. The locked row is evaluated on Slide's printed circle over a hand-digitized section — a slightly larger, differently-centred arc that propagates the same cohesion σ's into a smaller σ_F; on SLOPE/W's searched circle the same XSLOPE Taylor series lands on SLOPE/W's Monte Carlo. (The estimator-vs-sampling half of the earlier finding still holds — running XSLOPE's own Taylor series and Monte Carlo on one surface agrees to <1%; VP29 and VP36 reach it from the σ-input side.) Deterministic FS agrees within 0.3% on the φ = 0 cases; the wider 1.5–3% on the drained Example 4 is the Bishop-vs-M-P method difference on frictional soil. Examples 2–4 and the deep tangent modes are computable and vendor-anchored to the numbers above; because they re-run the same Congress-St. mechanism the locked cases already exercise, they are documented here rather than each minted as a separate regression lock.
VP29: Duncan's LASH terminal — TSPM reliability vs Monte Carlo
Slide #29 / Duncan (2000): the underwater trench failure at the Port of San Francisco LASH terminal — the example the Taylor-series reliability method (TSPM) was built on, and the method XSLOPE's reliability() implements. San Francisco Bay Mud with depth-growing undrained strength (su = 100 psf at el. −20 + 9.8 psf/ft — XSLOPE's cp option; the profile is confirmed against Duncan's Fig. 2(b)/D&W Fig. 13.1 average line), γ = 100 pcf (γ′ = 37.6), fully submerged below el. 0. Probabilistic inputs: σ_γ = 3.3, σ_cp = 1.2 (Slide's Table 29.2 rendering of Duncan's ±σ envelopes). Duncan's estimated slip surface is stored as a pixel-trace of the drawn surface, validated against the printed endpoints (Slide's printed "Axis Location" is the noncircular moment axis, not a circle center — a circle built from it lies up to 17 ft off the drawn surface at mid-span, though it reads a similar FS). reliability(search=False), added for this problem, evaluates the prescribed surface directly for F_MLV and every perturbation.
TSPM component comparison (fixed surface, Spencer):
| Component | XSLOPE | Duncan (2000) Table 5 | Slide (LHS Monte Carlo) |
|---|---|---|---|
| F, most likely values | 1.145 | 1.17 | 1.157 (mean 1.166) |
| ΔF, unit weight ±3.3 | 0.203 | 0.20 | — |
| ΔF, strength ±σ | 0.235 (rate ±1.2) | 0.31 (envelope shift) | — |
| σ_F | 0.155 | 0.18 | — |
| β_ln → PF | 0.936 → 17.5% | ≈0.9 → 18% | 1.088 → 13.96% |
Both sources are targeted and both land. The deterministic factor of safety brackets between them (−1.1% vs Slide, −2.2% vs Duncan) on Duncan's surface represented as a smooth least-squares arc (RMS 1.1 ft against the pixel trace of Slide's figure; both sources describe the surface as nearly circular). The probability of failure reproduces Duncan's own 18% almost exactly, with the unit-weight derivative matching his table term for term. The strength ΔF is smaller than Duncan's by construction — Slide's Table 29.2 renders his whole-envelope ±σ as a rate-only σ (±1.2 psf/ft), the only form expressible in a c/cp parameterization — which is also why Slide's Monte Carlo PF (14%) sits below Duncan's 18%.
Surface provenance: the arc is anchored at the trench corner (138, −120) rather than Slide's printed left endpoint, which is pulled 0.25 ft below the trench floor; the drawn surface in Slide's figure is partially occluded by a coordinate label near its entry, so that span is read at the label's edges. On the probabilistic side, note that the same slope carries three published probabilities of failure — 14% (Slide MC), 18% (Duncan 2000 TSPM), 30–33% (D&W 2014 §13.5.6, wider 2σ-rule envelope): two TSPM analyses by the same author differ by more than TSPM differs from Monte Carlo, so the σ-input choice, not the estimator, dominates probabilistic comparisons.
VP30: Reinforced embankment, (4) materials, tension crack, geosynthetic
Input files: vp030a.xlsx (circle A) · vp030b.xlsx (circle B)
Borges & Cardoso (2002)'s first geosynthetic-reinforced embankment on soft clay: a 2 m symmetric embankment, 10.6 m crest, 2:3 (V/H) faces, on a 5 m saturated clay layer over a rigid stratum, with one unanchored geosynthetic level (T = 200 kN/m, force parallel to the sheet) at the fill base. The paper's other two embankments are also built: Case 2 as VP31, covered by SLOPE/W §2.18, and Case 3 as VP32.
The two sources are complementary. The manual prints the materials (Table 30.2) and the reinforcement but leaves the geometry to an unlabeled Figure 30.1; the paper supplies the geometry (§4.1) and, in Table 10, both published circles outright — center (1.0, 1.0), R = 5.74 (A) and R = 5.24 (B). They cross-check to the digit (circle A: MO 631.38 / MR 1114.70 against the manual's 631 / 1115), and MRR = 200.00 on every circle fixes the datum — 200 kN/m on a 1.0 m arm puts the geosynthetic at y = 0.
| Circle | XSLOPE (Bishop) | Slide2 | Borges & Cardoso |
|---|---|---|---|
| A (R = 5.74) | 1.679 | 1.69 | 1.77 |
| B (R = 5.24) | 1.650 | 1.66 | 1.74 |
Bishop is the method the manual specifies for this problem — it "best simulates the moment based limit-equilibrium method the authors use" — and it lands within 0.7% of Slide on both circles. The locked values include the geosynthetic at full capacity: removing it drops Bishop to 1.359 / 1.262, a ΔF of +0.320 / +0.388 — the paper's own decomposition to the third decimal (MRR/MO = 200/631.38 = 0.317 and 200/521.66 = 0.383). The soil-side moments agree with Table 10 to under 1% (driving 635.9 vs 631.38, clay arc 845.0 vs 849.25), so the three published anchors reconcile completely: Borges' 1.77 is the uncracked arc plus the geosynthetic, Slide's 1.69 and XSLOPE's 1.679 are the cracked arc plus the same geosynthetic, and the crack costs −0.090 of FS — which is the published 1.77 − 1.69 spread, computed rather than asserted.
The tension crack is the whole problem. Both circles have their center below the crest,
so the arc's uphill end is buried at its equator and the daylight point sits above it
(circle A enters the crest at y = 2.0 with Yo = 1.0); the arc they bound exceeds a
semicircle. Slide resolves this by auto-cracking the reverse-curvature portion, and the manual
attributes its own gap to the source to exactly that. XSLOPE never synthesizes a crack from
curvature — the equivalent is an explicit tcrack_depth, which clips at a proper offset
surface. The principled depth is not tuned: the reverse-curvature portion is the arc above
the equator, and the equator lies at Yo, so the crack depth is
ycrest − Yo = 1.0 m, which is what both files carry. The answer is
flat for any crack from 0.90 to 1.25 m, because the arc is near-vertical where the crack cuts
it — the insensitivity is the check that the model is right rather than fitted.
Borges' 1.77 / 1.74 are not reproduced, and cannot be. They come from a moment-based limit equilibrium method integrating the whole arc, overhang included. Between the crest entry and the equator that surface doubles back 89 mm, so one x-position carries two depths — a method of vertical slices cannot represent it at all. This is not a guard that could be relaxed; it is what slicing is. The published spread is itself instructive: Slide 1.69 / 1.66 against Borges 1.77 / 1.74 is the cost of the crack, and XSLOPE reproduces the cracked branch.
Spencer is not locked here, and the disagreement is measured, not mysterious (1.192 / 1.080 against Bishop's 1.679 / 1.650, with Janbu refusing outright and Corps / Lowe & Karafiath inflating to 2.8–4.6). The crack-shortened arc exceeds a semicircle — base angles run from +83° at the crack face to −74° at the exit — so the horizontal projections of the base normals nearly cancel: the whole mass carries only ≈68 kN/m of net horizontal driving force at F = 1, a third of the 200 kN/m the geosynthetic mobilizes. Horizontal force equilibrium is close to the null space of the problem, and any FS built on it is a ratio of two cancelling sums; Janbu says so plainly ("net horizontal driving force is non-positive"). Spencer's constant interslice inclination can transmit the concentrated horizontal force entering at the near-vertical end only by hanging ≈240 kN/m of interslice tension at the crack face with a negative normal on the cohesionless sliver — a root that satisfies both equations while the thrust line leaves the soil, and that never converges: 1.19 → 1.38 as the slices refine from 60 to 960, then no solution at all. The two controls isolate the cause. Soil-only, the geometry is benign (Bishop 1.359, Spencer 1.358 on circle A); and the same 200 kN/m spread along the arc instead of concentrated at the entry returns Spencer to 1.683, beside Bishop. Complete equilibrium is satisfiable at the moment answer: Morgenstern–Price with a half-sine interslice function — side forces flattening exactly where the horizontal force enters — converges with all base normals positive at 1.670 / 1.632, within 0.6% of Bishop. For φ = 0 circles the moment-equilibrium FS is the complete-equilibrium value (Duncan, Wright & Brandon 2014, pp. 89, 96–97), which is why the manual prescribes Bishop and only the Bishop comparison is regression-locked. On VP32 — same paper, same reinforcement model, no crack — none of this arises: the arc is an ordinary sub-semicircle and Bishop and Spencer agree to three decimals.
One note on the materials: the Case-1 clay profile has a middle layer whose undrained strength decreases with depth (8.49 → 4.725 kPa), unlike the monotonically increasing profiles in Cases 2 and 3. The paper explains it — the top metre consolidated during construction (~14 kPa of effective volumetric stress), so its strength was computed at the raised stress, leaving it stronger than the layer beneath.
Sources: Slide Slope Stability Verification Manual §30; Borges & Cardoso (2002), Geotextiles and Geomembranes 20(6), 395–421.
VP32: Reinforced embankment, (7) materials, geosynthetic
Input files: vp032a.xlsx (case 1, circle A) · vp032b.xlsx (case 1, circle B) · vp032c.xlsx (case 2, circle C)
Borges & Cardoso (2002)'s third geosynthetic-reinforced embankment: two fill stages (a 7 m and an 8.75 m crest) of granular fill over five soft clay layers, with a T = 200 kN/m geosynthetic at the fill base (interface friction 30.96°, force parallel to the reinforcement). Slide2's figures for this problem carry no coordinates; the geometry here comes from the RS2 manual's fully labeled figures for the same problem, which print every vertex, the clay layer boundaries, and the three published circles.
| Case | XSLOPE (Bishop = Spencer) | Slide2 | Borges & Cardoso |
|---|---|---|---|
| H = 7, circle A | 1.218 | 1.23 | 1.25 |
| H = 7, circle B | 1.216 | 1.22 | 1.19 |
| H = 8.75, circle C | 0.981 | 0.98 | 0.99 |
VP33: Dike, (5) materials, probabilistic analysis, water table
Input files: vp033.xlsx
El-Ramly, Morgenstern & Cruden (2003)'s simplified probabilistic model of a Syncrude
tailings dyke: a cohesionless section (tailing sand over glacio-fluvial sands and tills,
all φ = 34°) resting on a presheared disturbed clay-shale with φ = 7.5° ± 2.1°. The
critical mechanism rides the clay-shale: Slide's drawn circle (center (327.5, 394),
R = 124) is tangent to el. 270 — about nineteen meters below the model base (the vendor
.fez places the base near el. 289, gently sloping) — so the surface is composite,
truncated at the base and running flat inside the weak band.
This is the composite-surface option exercised
on a published benchmark.
| XSLOPE (composite) | Slide | El-Ramly et al. | |
|---|---|---|---|
| Bishop, Slide's circle | 1.320 | 1.305 | 1.31 |
| Bishop, critical search | 1.261 | — | — |
Modeling notes: Slide assigns three piezometric lines to different materials; XSLOPE's
single piezometric line uses the lowest (the one Slide assigns to the glacio-fluvial
sand) everywhere — applying each of Slide's lines everywhere brackets the factor of
safety within 1–3%, so the simplification is well inside the digitizing tolerance. The
clayey till's properties are not printed in the manual; the geometry and material zonation
(including the clayey till's φ = 7.5°, matching the clay-shale, and the diagonal wedge cut
that separates the two) follow the RS2 vendor .fez for this problem. The published
probability of failure
(1.5–1.6×10⁻³ by Monte Carlo) is reported here without a regression lock: it rests on
the paper's spatial-averaging variance treatment, which a single slope-scale σ does not
reproduce. The size of that gap is now measured rather than asserted. Running the
probabilistic analysis on the point-scale σ (φ = 7.5° ± 2.1° along the clay-shale) both
ways — Taylor series and a 10,000-sample Monte Carlo — gives PF ≈ 2.2% (β_ln ≈ 2.02) and
PF ≈ 3.5% (β_ln ≈ 2.03) respectively: the two estimators agree with each other, and both
sit roughly twenty times above El-Ramly et al.'s 0.15%. That factor is exactly the
variance reduction El-Ramly obtain by averaging φ over the length of the slip surface
(their autocorrelation model), a spatial-variability feature XSLOPE does not carry — so
the missing ingredient is a correlation-length treatment, not the estimator. Faking it
with a smaller lumped σ is declined.
VP34: Dam, (3) materials, probabilistic analysis, water table
Input files: vp034.xlsx
Wolff & Harr (1987)'s reliability model of the Clarence Cannon Dam (Salt River, Missouri): Phase I fill placed to el. 548 with a cutoff trench to rock, a Phase II shell to the crest at el. 659, a vertical chimney drain under the crown, and a flat water table at el. 557. The model uses polygon zones (the drain is a rectangular inclusion inside the shell). Geometry is digitized from the Slide model's vertex dots; Slide's model reads a few feet off the labels in W&H's original figure (crest ~659 vs El. 654, water table ~557 vs El. 550) and is used as-built here since the factor-of-safety targets are Slide's. The unit weight γ = 150 pcf is Slide's published choice, tuned to reproduce W&H's factor of safety.
The analysis evaluates W&H's prescribed noncircular surface: 45° from the crest edge through the shell and drain, along the base of the Phase I fill (el. 516), exiting the downstream face at the waterline.
| XSLOPE | Slide | Wolff & Harr | |
|---|---|---|---|
| Spencer | 2.423 | 2.383 | — |
| Morgenstern–Price / GLE | 2.384 | 2.333 | 2.36 |
Morgenstern–Price lands within 1% of W&H's 2.36 and 2.2% of Slide's GLE, within the tolerance of the pixel-traced geometry.
On the probabilistic side, this problem sits outside the Taylor-series method's
domain: W&H's inputs give the Phase I fill a φ standard deviation (7.87°) larger
than its mean (6.34°), so the F(φ−σ) evaluation would use a negative friction
angle, and reliability() declines the input. A hand Taylor series with a
one-sided φ derivative and W&H's correlation coefficients gives β 1.54 / PF
6.2×10⁻² under their normal-FS treatment, against W&H's point-estimate 4.55×10⁻²
and Slide's Monte-Carlo 3.55×10⁻³ — the two published values themselves differ by
13×, the sampling treatment of the φ ≥ 0 bound on a COV-124% variable dwarfing
the estimator choice. Monte Carlo is the right tool past that boundary, and XSLOPE's
reliability_mc now demonstrates it: sampling each parameter normally and truncating
the negative φ draws at zero — exactly the φ ≥ 0 bound the published samplers apply —
a 10,000-sample run on W&H's noncircular surface (Spencer) returns a mean FS of 2.54,
σ_F ≈ 0.81, and an empirical probability of failure of about 2% (2–3% depending on
whether the ~1% of realizations whose extreme low-strength draws drive Spencer to
non-convergence are counted as failures). That lands inside the 0.36%–6.2% band the
three published estimates span, confirming the case is reproducible once the estimator
is switched. It is reported rather than regression-locked: at COV 124% the admissible
subset shifts with solver convergence on the pathological draws, so the empirical PF is
not a stable lock target — the same reason VP33's PF is documented without a lock. The
deterministic factor of safety remains the locked benchmark, and the Taylor-series-domain
note stands, now demonstrated on both sides — TSPM correctly declines the negative-φ
evaluation, Monte Carlo carries it.
VP35: Dam, (5) materials, probabilistic analysis, reliability index
Input files: vp035.xlsx
Hassan & Wolff (1999)'s end-of-construction model of Cannon Dam, the benchmark for their central finding: the surface of minimum reliability index is not the surface of minimum factor of safety. Two clay fills with large strength scatter (Phase I φ = 8.5° ± 8.5°, Phase II c = 143.6 ± 79 kPa with ρ(c,φ) = −0.55), a vertical sand-filter strip under the crest, and a spoil-covered downstream toe, in polygon-zone geometry.
Hassan & Wolff's published surfaces are search products (their figures do not resolve the individual circles), so the comparison reproduces the procedure: a Bishop critical search at mean strengths (their surface A), and a direct minimum-β scan over downstream circles evaluating the Taylor-series β on each fixed candidate (their surface B). The benchmark — and the lock — is downstream-slope-specific: a global (grid-seeded) search finds a substantial upstream mechanism at Bishop ≈ 1.88, well below the downstream 2.53, on this dry end-of-construction model. Hassan & Wolff and Slide analyze the downstream slope, so the seeded search reproduces the published problem; the upstream face is simply outside the benchmark's scope. The c–φ correlations enter as the standard Taylor-series cross-terms (2ρ·(ΔF_c/2)·(ΔF_φ/2)); the regression tag locks the uncorrelated β.
| Quantity | XSLOPE | Slide | Hassan & Wolff |
|---|---|---|---|
| Critical FS at means (Bishop search) | 2.529 | 2.551 | 2.753 |
| β_ln on that surface | 6.71 (7.29 with ρ) | 10.95 | 10.36 |
| Minimum-β surface: β_ln | 3.353 (3.50 with ρ) | 4.351 | 3.987 |
| FS on the minimum-β surface | 2.97 | 2.820 | 2.352 |
All three programs agree on the structure: a mid-depth circle through the Phase II fill and upper Phase I carries roughly one-third the β of the FS-critical surface, so a design screened on FS alone would examine the wrong surface. The β magnitudes spread with the estimator at these extreme COVs — the Taylor series evaluates strength at φ − σ = 0° for the Phase I fill, a tail that truncated-normal Monte Carlo sampling rarely reaches — the same direction as VP36's spread at three times the COV. The manual notes its own inputs were partly inferred (its FS departs from Hassan & Wolff's by large margins on several of the paper's fixed surfaces C–H, which are therefore not reproduced here).
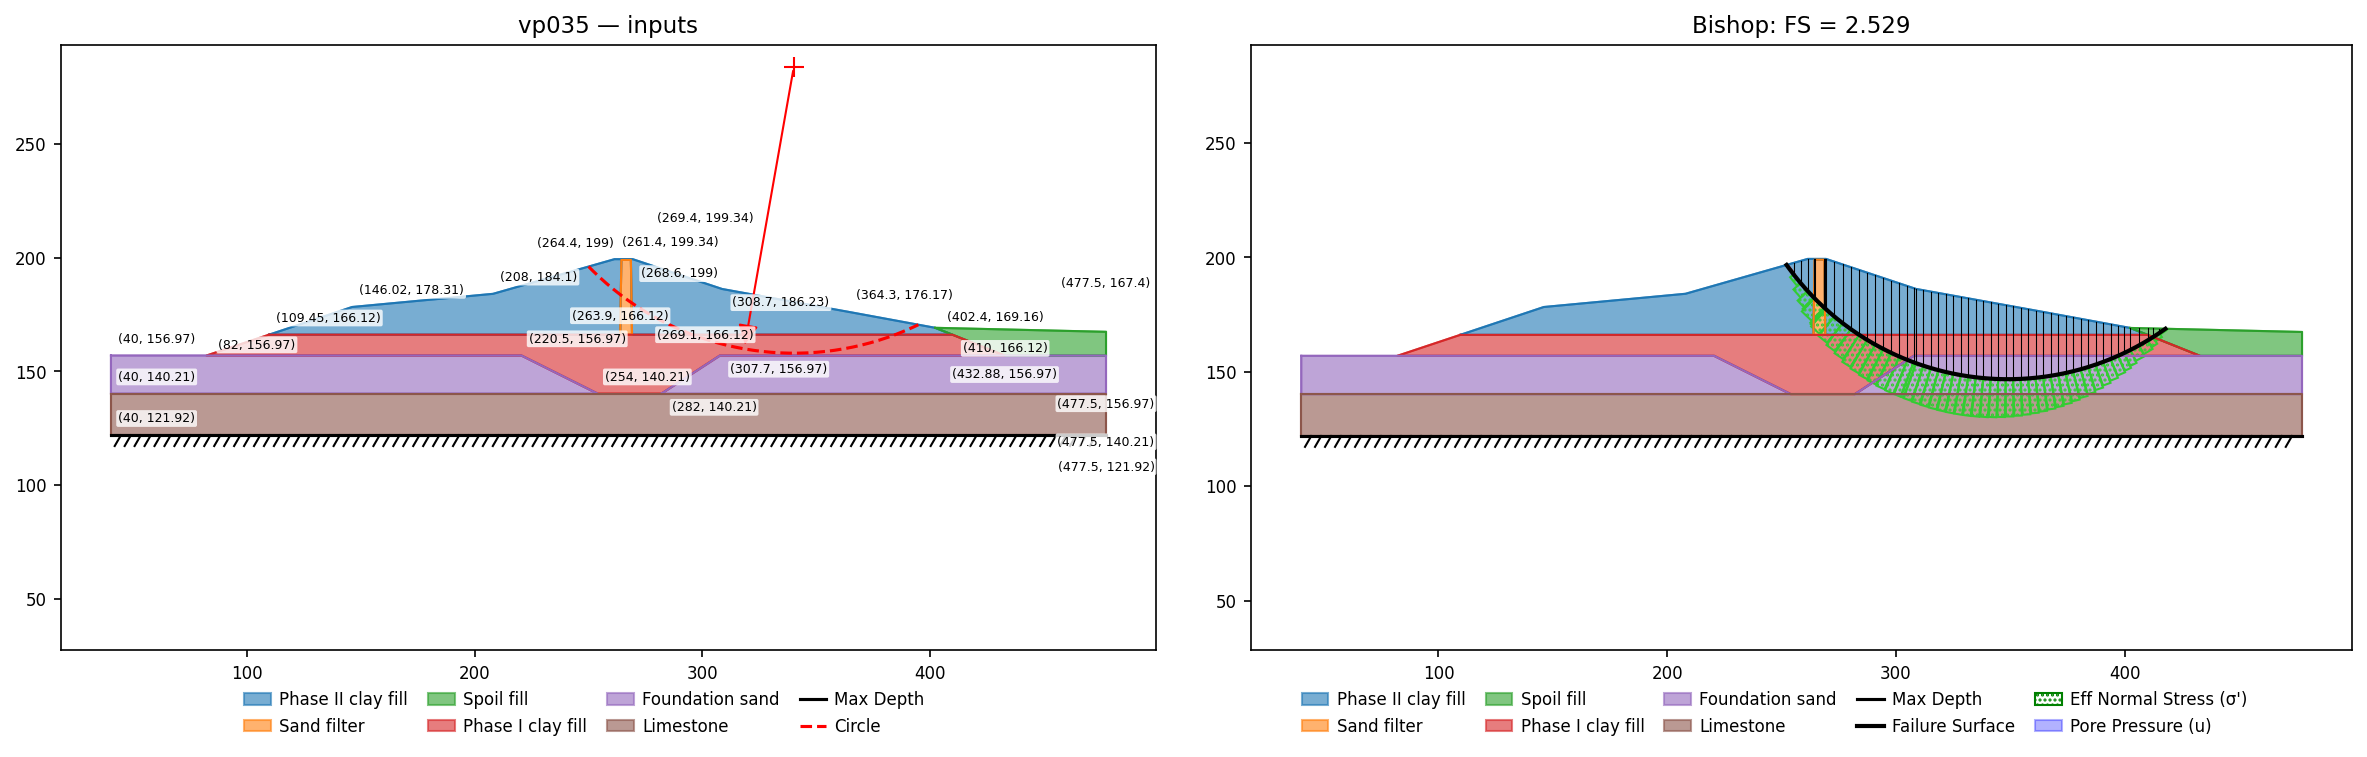
VP36: Slope, homogenous, probabilistic analysis, ru pore pressure, reliability index
Slide #36: Li & Lumb (1987) / Hassan & Wolff (1999) reliability benchmark: c'=18+-3.6, phi'=30+-3, gamma=18+-0.9, ru=0.2 (+-0.02, not perturbed by xslope's Taylor-series reliability - its contribution to sigma_F is small). Bishop deterministic FS 1.334 (H&W) / 1.340 (Slide); beta_lognormal on the deterministic surface 2.336 (H&W) / 2.482 (Slide).
Input files: vp036.xlsx
| Method | XSLOPE | Published |
|---|---|---|
| Bishop | 1.333 | H&W 1.334; Slide 1.340 |
| β_ln (reliability) | 2.263 | H&W (FOSM) 2.336; Slide (Monte-Carlo) 2.482 |
β estimates legitimately spread by estimation method; xslope does not yet perturb ru (σ = 0.02, minor).
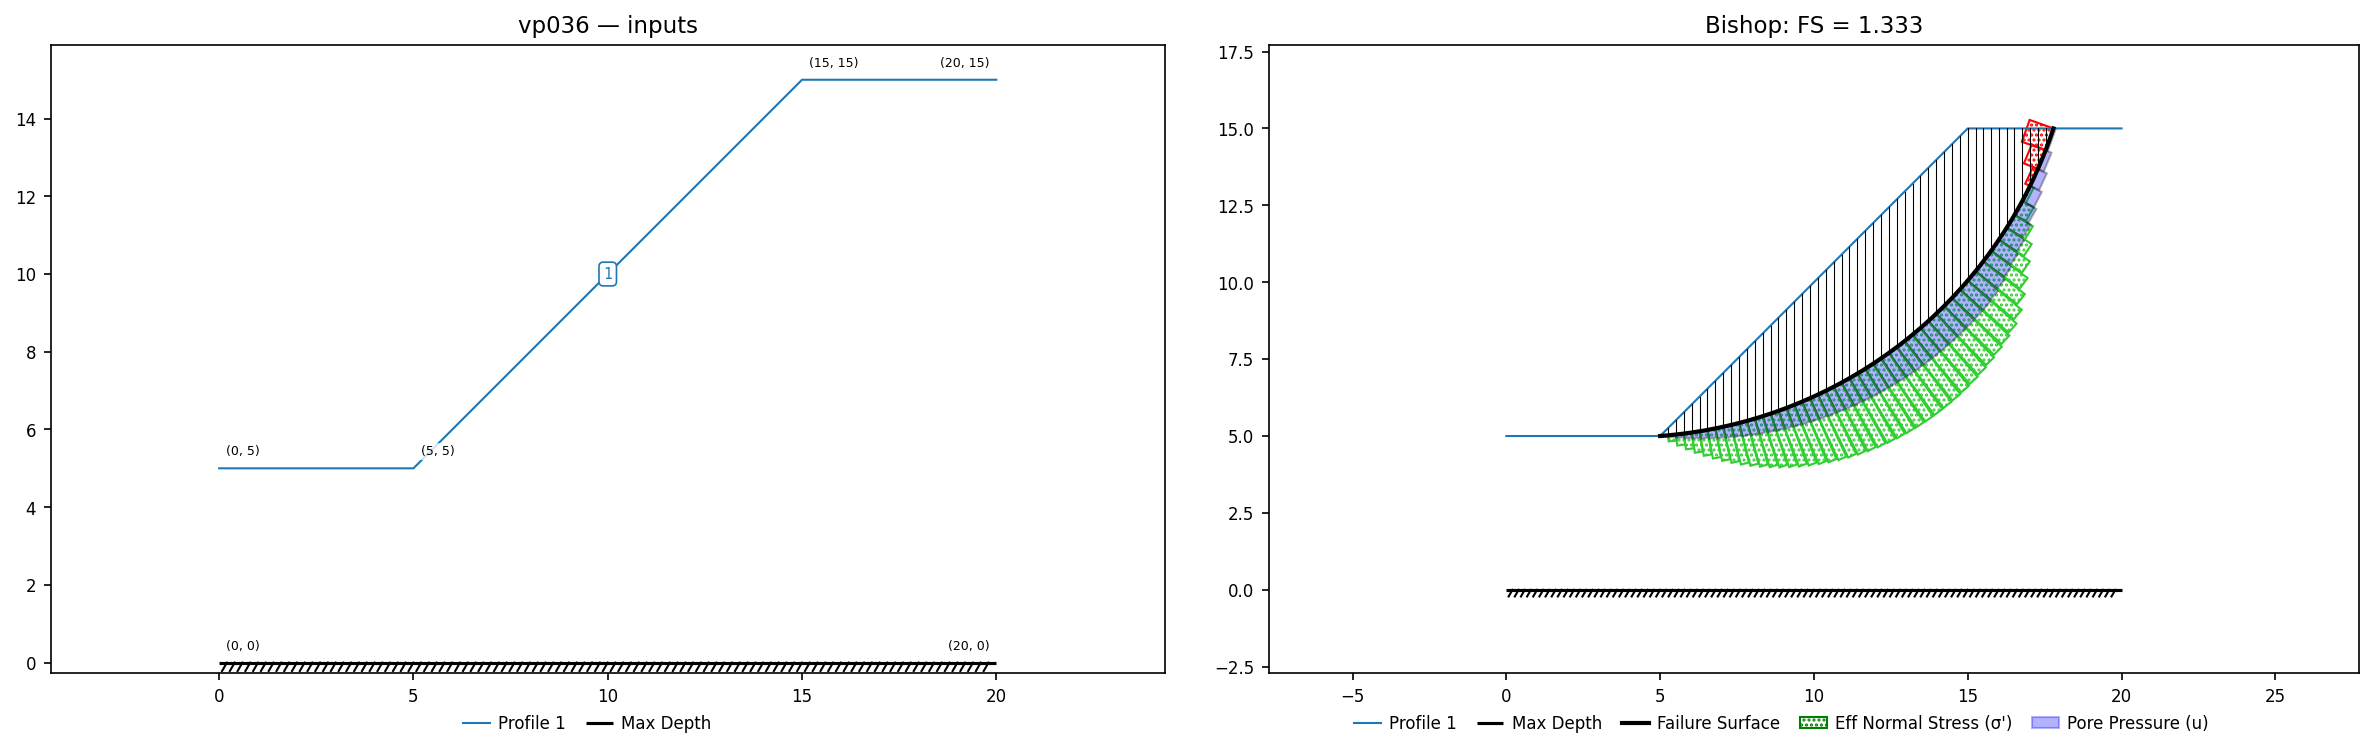
VP37: Cohesionless slope, crest surcharge, back-analysis of required support force
Slide #37 reproduces the "Reinforcement Example" of the XSTABL v5 reference manual (Sharma 1996, §3.8, Fig. 3.15), itself after Koerner (1991): a 12 m high, 45° cohesionless slope under a 40 kN/m² crest surcharge. The soil properties are printed on XSTABL's Fig. 3.15 — φ = 36°, γ = 20 kN/m³, c = 0 — which the Slide2 manual does not reproduce; the earlier "blocked" status was for exactly these missing values, now recovered from the XSTABL source. Geometry is read from Slide's coordinate-labeled Fig. 37.1: ground surface (0,5)–(5,5)–(17,17)–(40,17), domain base at y = 0, surcharge on the crest from the edge (17,17).
Input files: vp037.xlsx (base slope)
Base slope (unreinforced). On Slide's printed critical circle (center −11.410, 35.264, R 34.426; Fig. 37.3), and equally from a toe-focus, 2 m-minimum-depth search that lands on that circle unaided:
| Method | XSLOPE | Published |
|---|---|---|
| Bishop | 0.764 | Slide 0.764 (Fig. 37.3); XSTABL Fcrit 0.734 |
| Spencer | 0.764 | — |
Required support force (part a). XSTABL and Slide back-analyse the horizontal support (the resultant of a triangular 0→57.5 kN/m² face load, applied at ⅓ of the slope height, el 9 m) that raises the slope to FS = 1.5, reported as the maximum over all toe surfaces: Slide 351 kN/m, XSTABL 345 kN/m. Sweeping that support force in XSLOPE (a reinforcement line at el 9, re-searching the critical surface at each step) gives a required design force of ≈205 kN/m with a moment-credit ("active") support and ≈305 kN/m with a factored ("passive", 1/F) support; at the published force the passive design factor of safety is ≈1.56. XSLOPE does not reproduce 351/345 exactly: the published values come from XSTABL's support-force procedure (App. D.5, Eqs. D.38–D.41), which sizes the force from the effective normal forces evaluated at the target factor of safety, a more conservative crediting than a limit-equilibrium reinforcement line. The concentrated resultant also strains the interslice assumptions, as already noted for VP85. The regression therefore locks the base-slope factor of safety — which reproduces the source exactly — and documents the back-analysis rather than locking a force that the two methods compute differently.
Reinforced-zone length (part b) — the minimum length of an elevated-friction zone (φ_reinf = 56.04°) that holds FS = 1.5, published as Slide 7.6 m / XSTABL 7.5 m — needs a variable-length material zone and stays feature-gated.
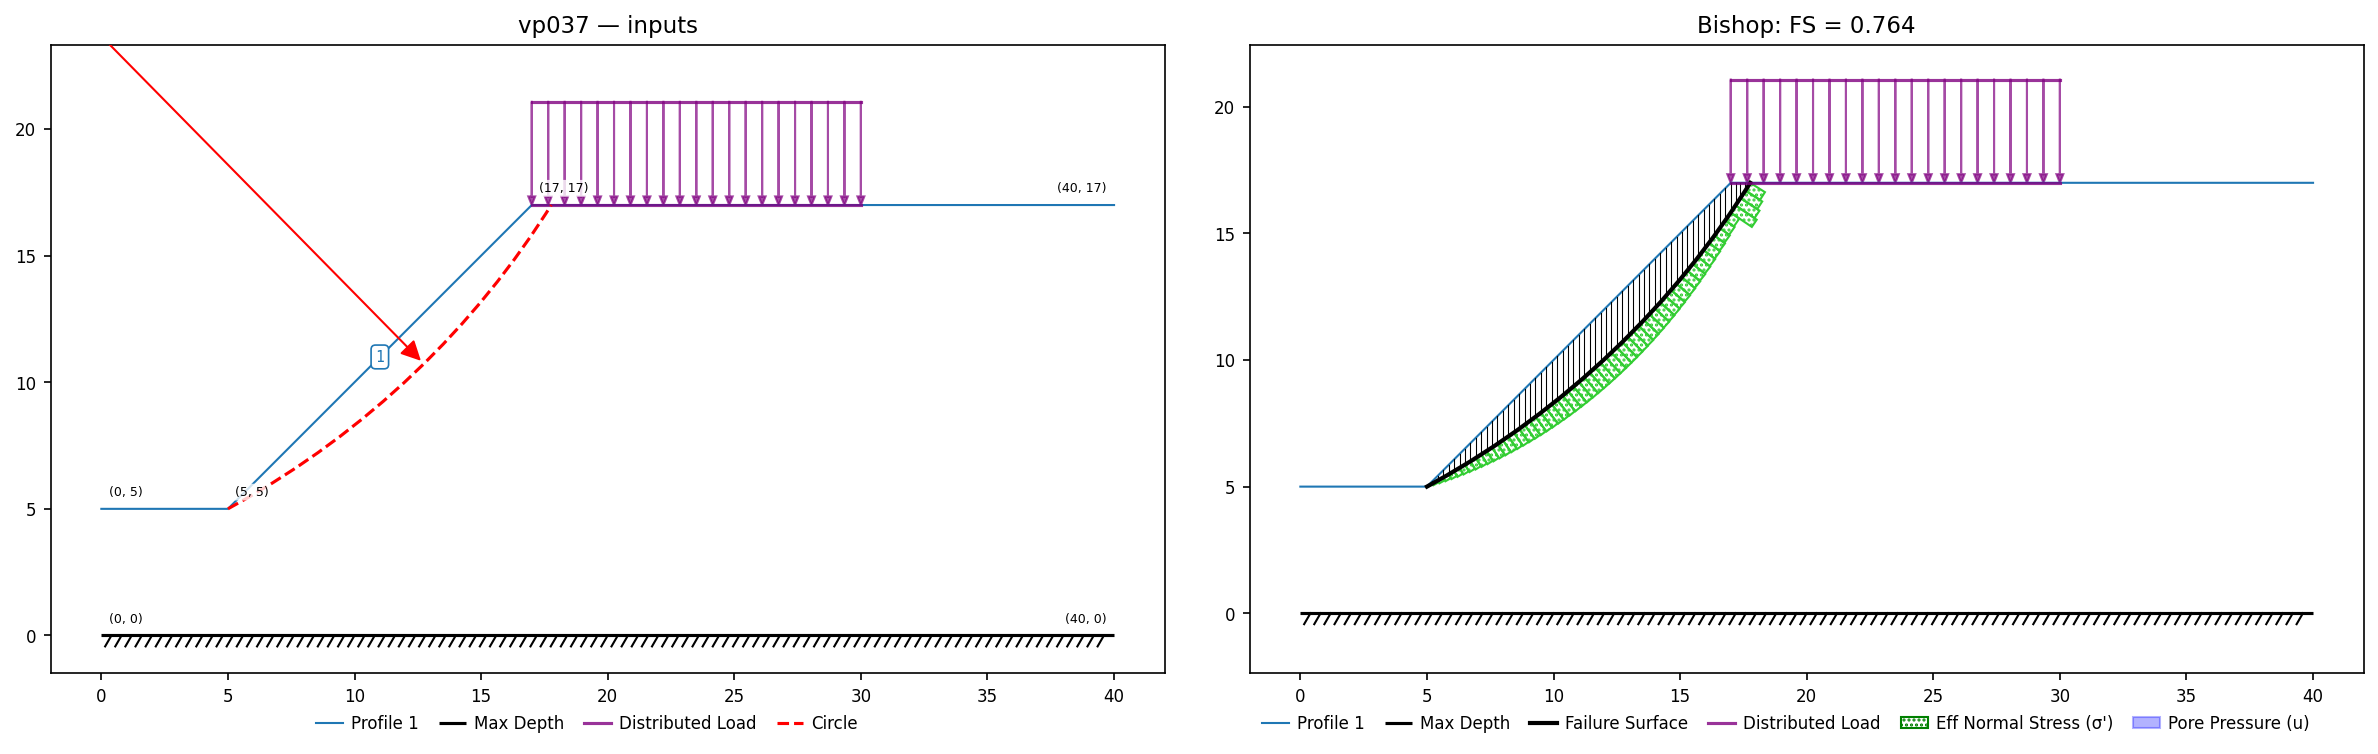
VP38: Excavated slope, FE groundwater seepage, matric suction
Slide #38 reproduces Ng & Shi (1998), a 28° cut slope in Hong Kong: a homogeneous soil (24 m over a 6 m bedrock band) in which the steady groundwater regime leaves the upper part of the cut unsaturated, and the negative pore water pressure there (matric suction) raises the shear strength. The stability is a conventional Bishop analysis on the FE seepage field, with the strength above the water table given by the extended (Fredlund) Mohr-Coulomb criterion:
The last term is an apparent cohesion from suction: with the pore-air pressure \(u_a = 0\), it is \((-u_w)\tan\varphi^{\,b}\) on any slice whose base sits above the water table. Material (Table 38.1): \(c' = 10\) kPa, \(\varphi' = 38°\), \(\varphi^{\,b} = 15°\), \(\gamma = 16\) kN/m³.
Input files: vp038a / vp038b / vp038c (right-side head \(H = 61 / 62 / 63\) m), each with its _mesh.json / _seep.csv seepage sidecars.
The seepage (our own FE solve). Geometry is read from the vendor RS2 mesh's external boundary — ground surface (0.13, 19.15)–(40.74, 40.6)–(50.95, 40.6)–(57.06, 49.31)–(97.89, 70.78), the domain closing down the right edge and along an impermeable base to the toe. XSLOPE solves the steady unsaturated field itself (u='seep'): constant total head \(H\) on the right (uphill) side, head 6 m on the left (toe) side, the ground surface a seepage/exit face, base and the far edges no-flow. The soil's relative permeability is Ng (1998)'s measured \(k\)-function, cast as a Gardner curve \(k_r(\psi) = 1/(1 + a\,|\psi|^n)\) with \(a = 7.479\), \(n = 2.908\) (a log-space fit to the RS2 .slw curve, \(k_s = 4.19\) m/day) — SWCC data, not a fitted knob (a van Genuchten cast of the same curve moves the factor of safety by < 0.005). The solved field carries a bounded matric suction above the water table (max ≈ 60–70 kPa on the trial surface, unlike a deep piezometric line's unbounded hydrostatic suction), so no suction cap is required.
The suction (our strength delivery). On the direct-surface tests the tag sets suction_phi_b = {Cut soil: 15}. generate_slices reads the signed seepage pressure at each slice base; where it is negative it prices the suction \(s = \max(0, -u_w)\) into an apparent cohesion \(c_\text{suction} = s\tan\varphi^{\,b}\), added to the resisting \(c\,\Delta\ell\) term, while the effective-normal term keeps \(u\) clamped at 0 — exactly the extended Mohr-Coulomb term with \(u_a = 0\). Below the water table the slice sees positive \(u\) and no suction credit, as it should.
Slide's critical surface. Slide prints its \(H = 61\) critical circle (Fig. 38.2): Bishop FS 1.621, center (47.490, 56.311), radius 16.087, endpoints (50.953, 40.601)–(63.120, 52.500) — a shallow circle entirely in the upper, unsaturated part of the cut, where the suction credit lives. Only \(H = 61\) has a figure; the critical geometry is head-invariant to that precision (the head boundary changes the pore field, not the slope), so all three cases carry this circle and are evaluated on it as a specified surface.
Results (Bishop simplified, on Slide's printed circle, num_slices=60):
| \(H\) (m) | XSLOPE | Slide | Ng & Shi (1998) |
|---|---|---|---|
| 61 | 1.612 | 1.621 | 1.636 |
| 62 | 1.533 | 1.538 | 1.527 |
| 63 | 1.413 | 1.407 | 1.436 |
XSLOPE reproduces the published Bishop values within 0.6% and tracks the physics: the factor of safety falls as the right-side head rises (more saturation, less suction). Turning the suction credit off drops all three to ≈ 1.35–1.41, confirming the apparent cohesion — not the effective-normal pressure — carries the difference from the published band.
Free search. The verification locks the specified surface, which is immune to the search-selection question. For the record, a free search with the suction credit does not land on Slide's shallow circle: it localizes to a somewhat deeper circle a few percent below the published value (H = 61: ≈ 1.57 vs 1.621), because a deeper surface trades away some suction credit for a longer saturated base. Slide's reported minimum is the shallow suction circle; the specified-surface comparison isolates the seepage-plus-suction physics from that difference in which circle each search selects.
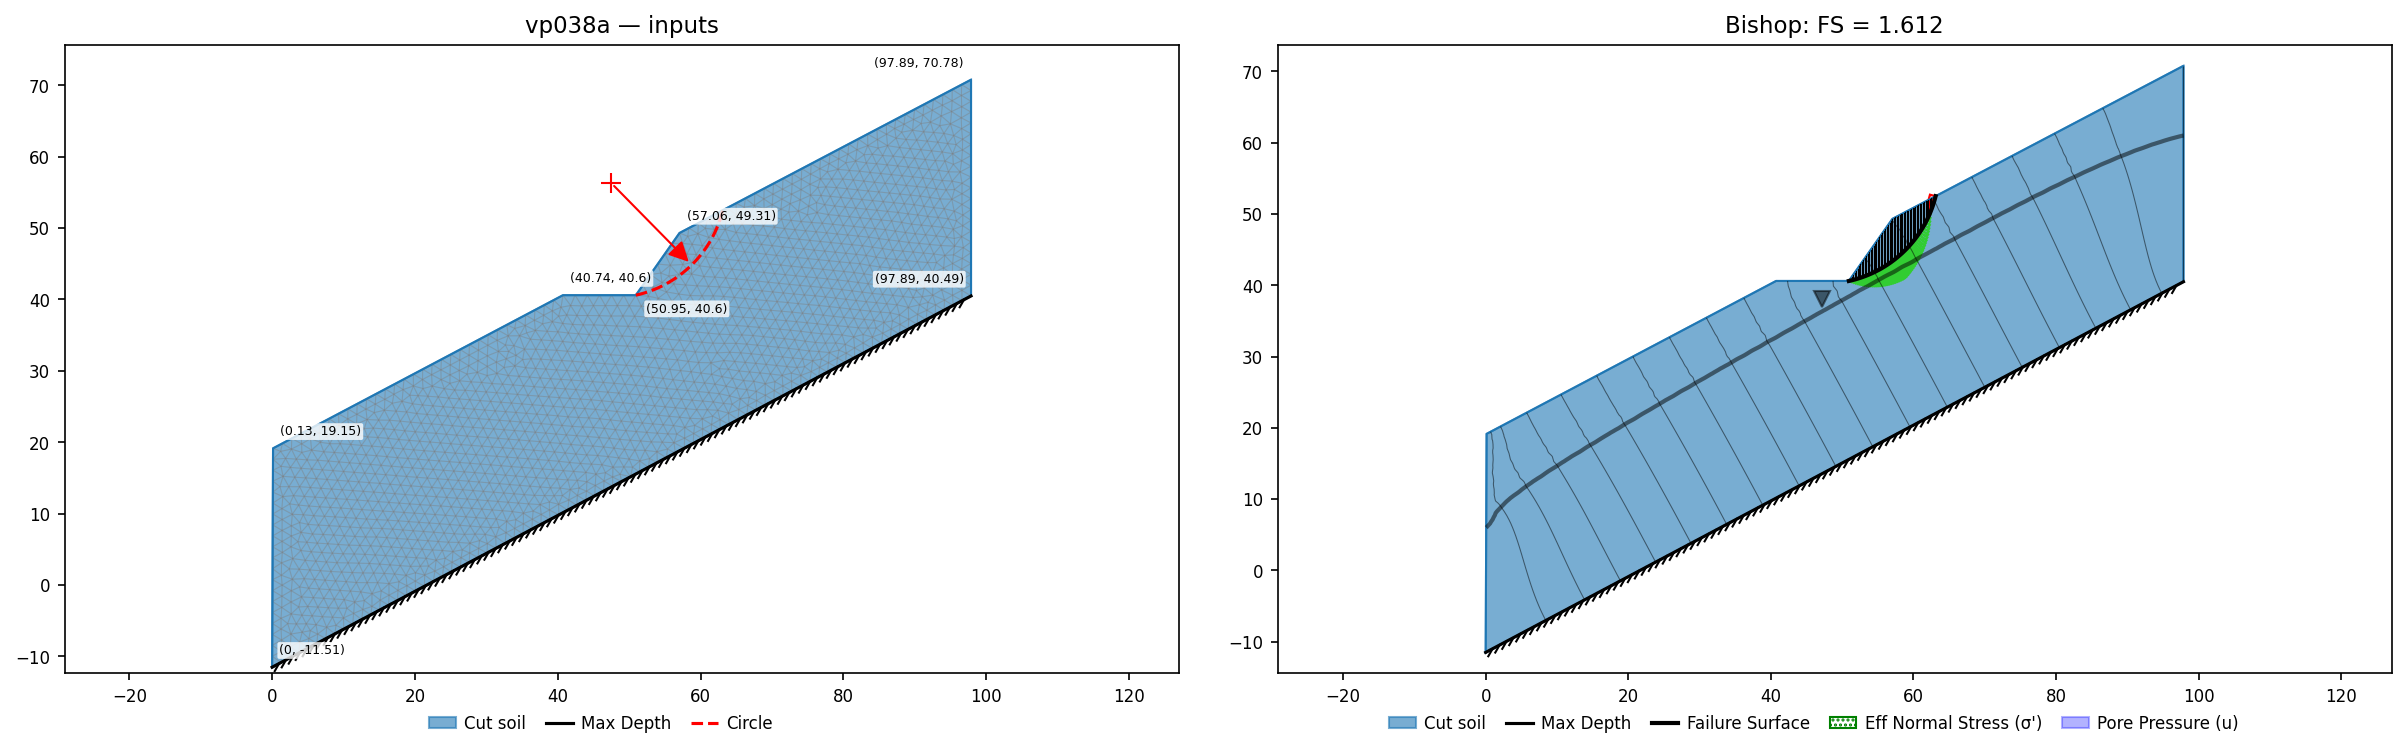
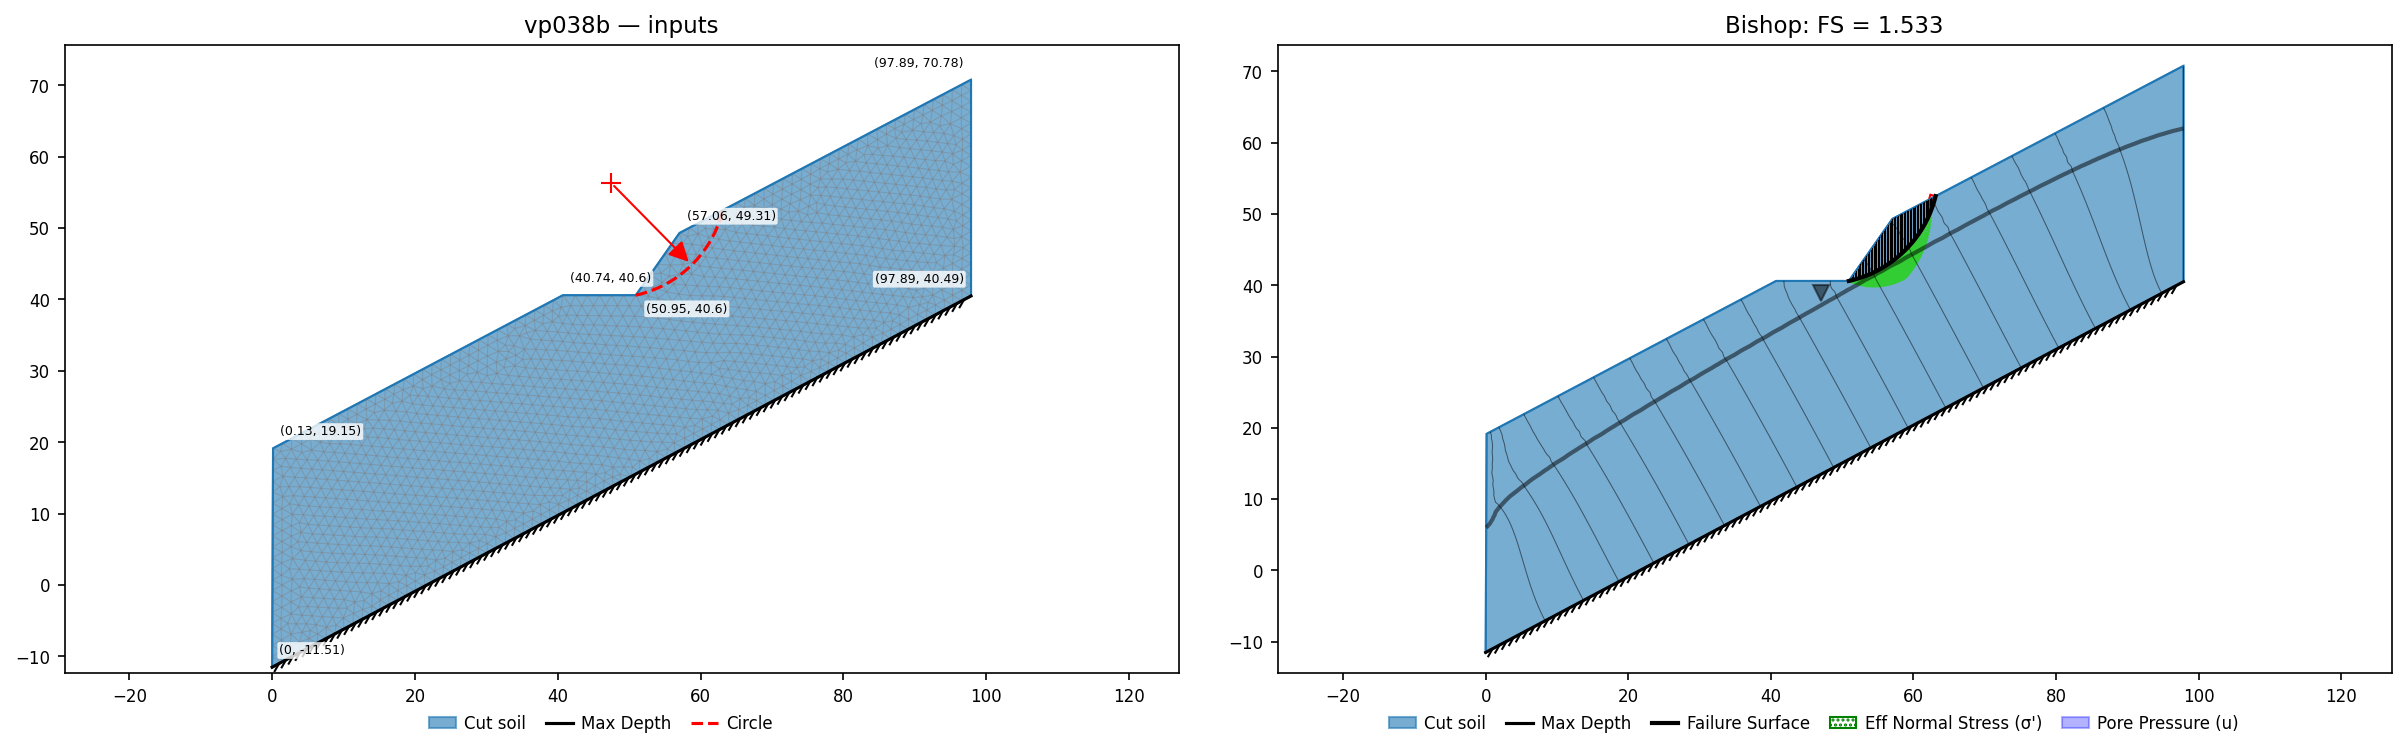
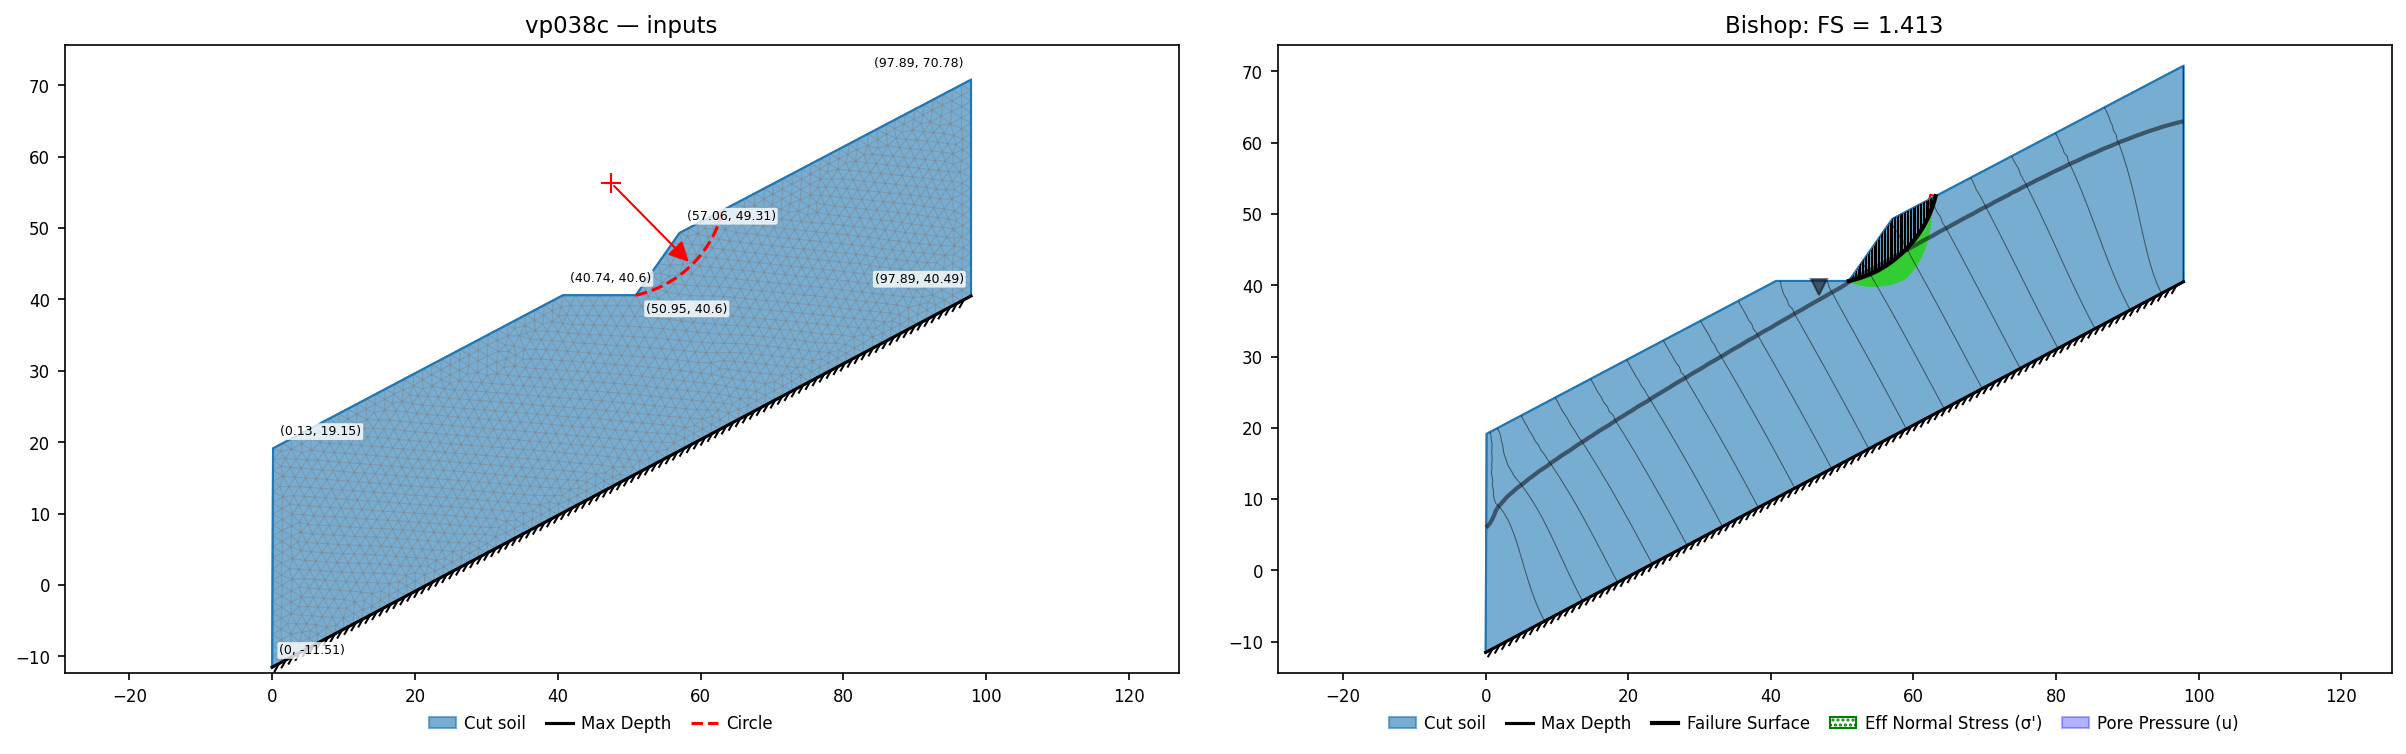
VP39: Reinforced embankment, (2) materials, tension crack, geosynthetic
Input files: vp039a.xlsx (clay fill, unreinforced) · vp039b.xlsx (clay, T=169) · vp039c.xlsx (sand fill, unreinforced) · vp039d.xlsx (sand, T=44)
Tandjiria (2002)'s required-reinforcement problem: a half-embankment (centerline at x = 0) on soft clay, analyzed as a clay fill (c′ = 20 kPa, φ = 0, water-filled tension crack) and as a sand fill (φ′ = 37°, dry crack). The unreinforced critical surface is located first; the geosynthetic force at the embankment base that restores FS = 1.35 on that surface is then computed (active application, force parallel to the reinforcement, per the source).
| Case | XSLOPE | Slide | Tandjiria (2002) |
|---|---|---|---|
| Clay fill, unreinforced (Spencer) | 0.968 | 0.975 | 0.981 |
| Clay fill, FS at T = 169 kN/m | 1.332 | 1.35 | — |
| Clay fill, required T for FS = 1.35 | 175 kN/m | 169 | 170 |
| Sand fill, unreinforced (Spencer) | 1.200 | 1.209 | 1.219 |
| Sand fill, FS at T = 44 kN/m | 1.343 | 1.35 | — |
| Sand fill, required T for FS = 1.35 | 46 kN/m | 44 | 45 |
The regression locks the unreinforced factors of safety and the factors of safety at Slide's published forces, each on the stored critical circle. The source's noncircular variants (Slide 0.935/1.188, required T 184/56) are not locked: XSLOPE's noncircular search returns seed-dependent local minima on this φ = 0 problem, and the noncircular reinforced evaluation is pending the reinforcement generalization noted for VP30.
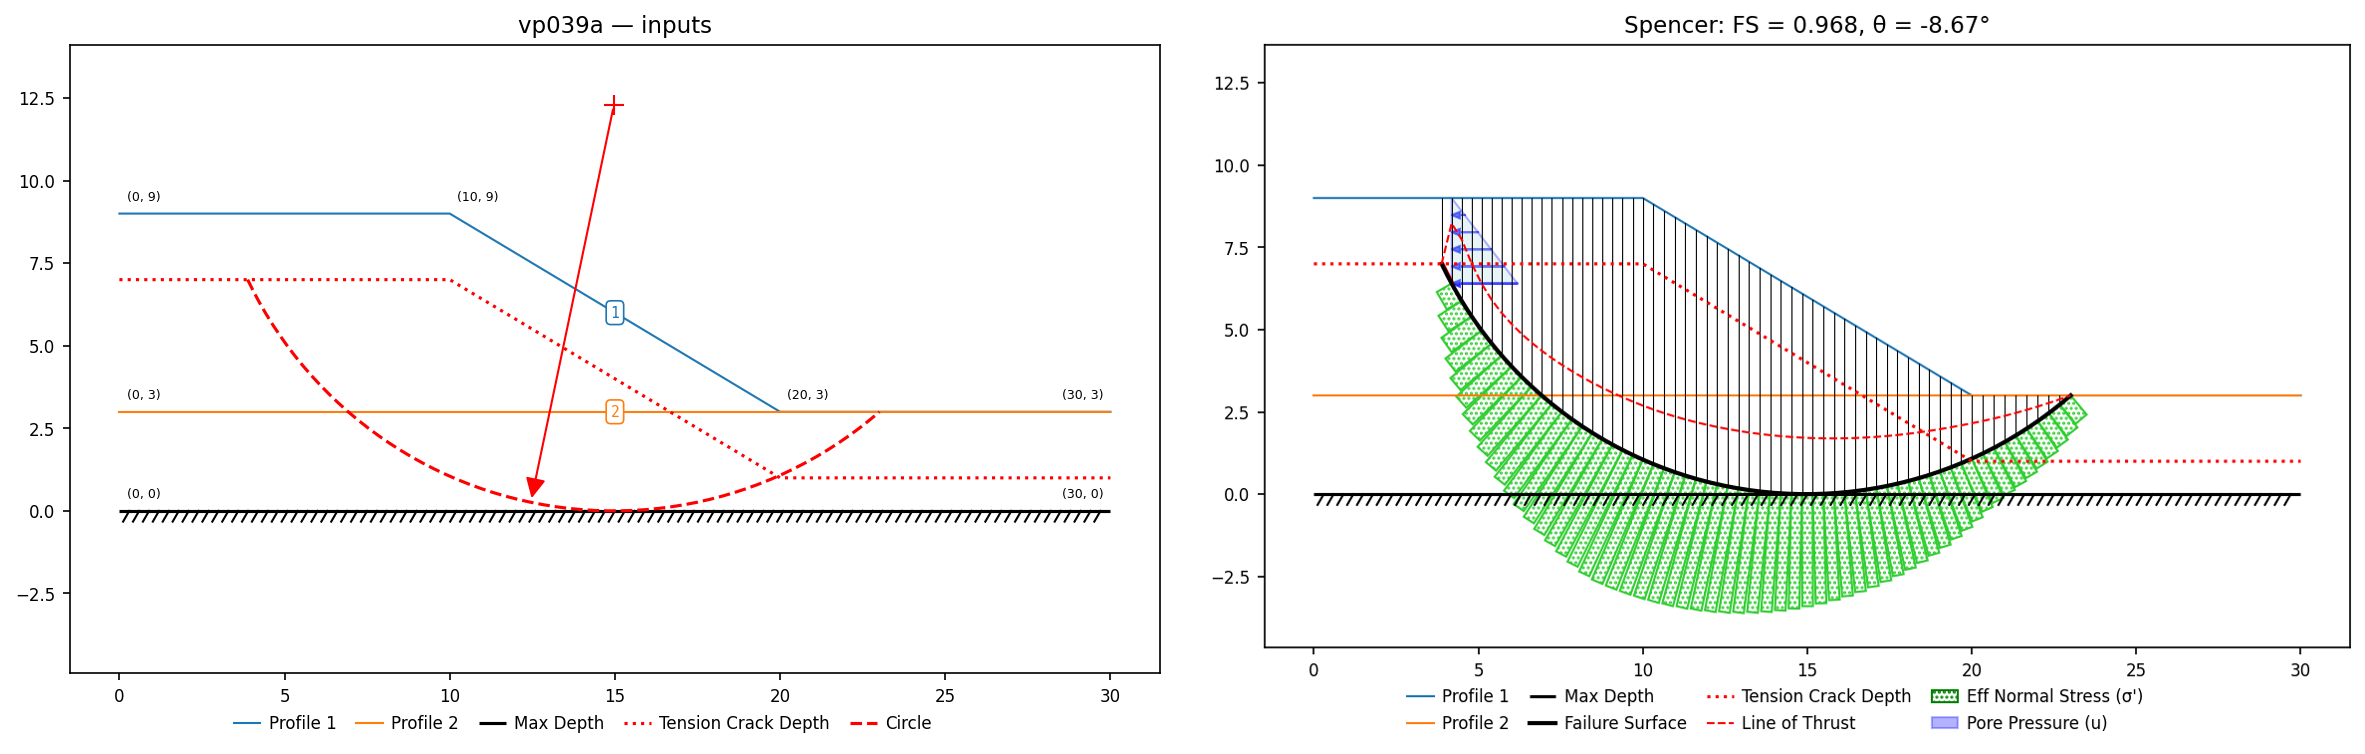
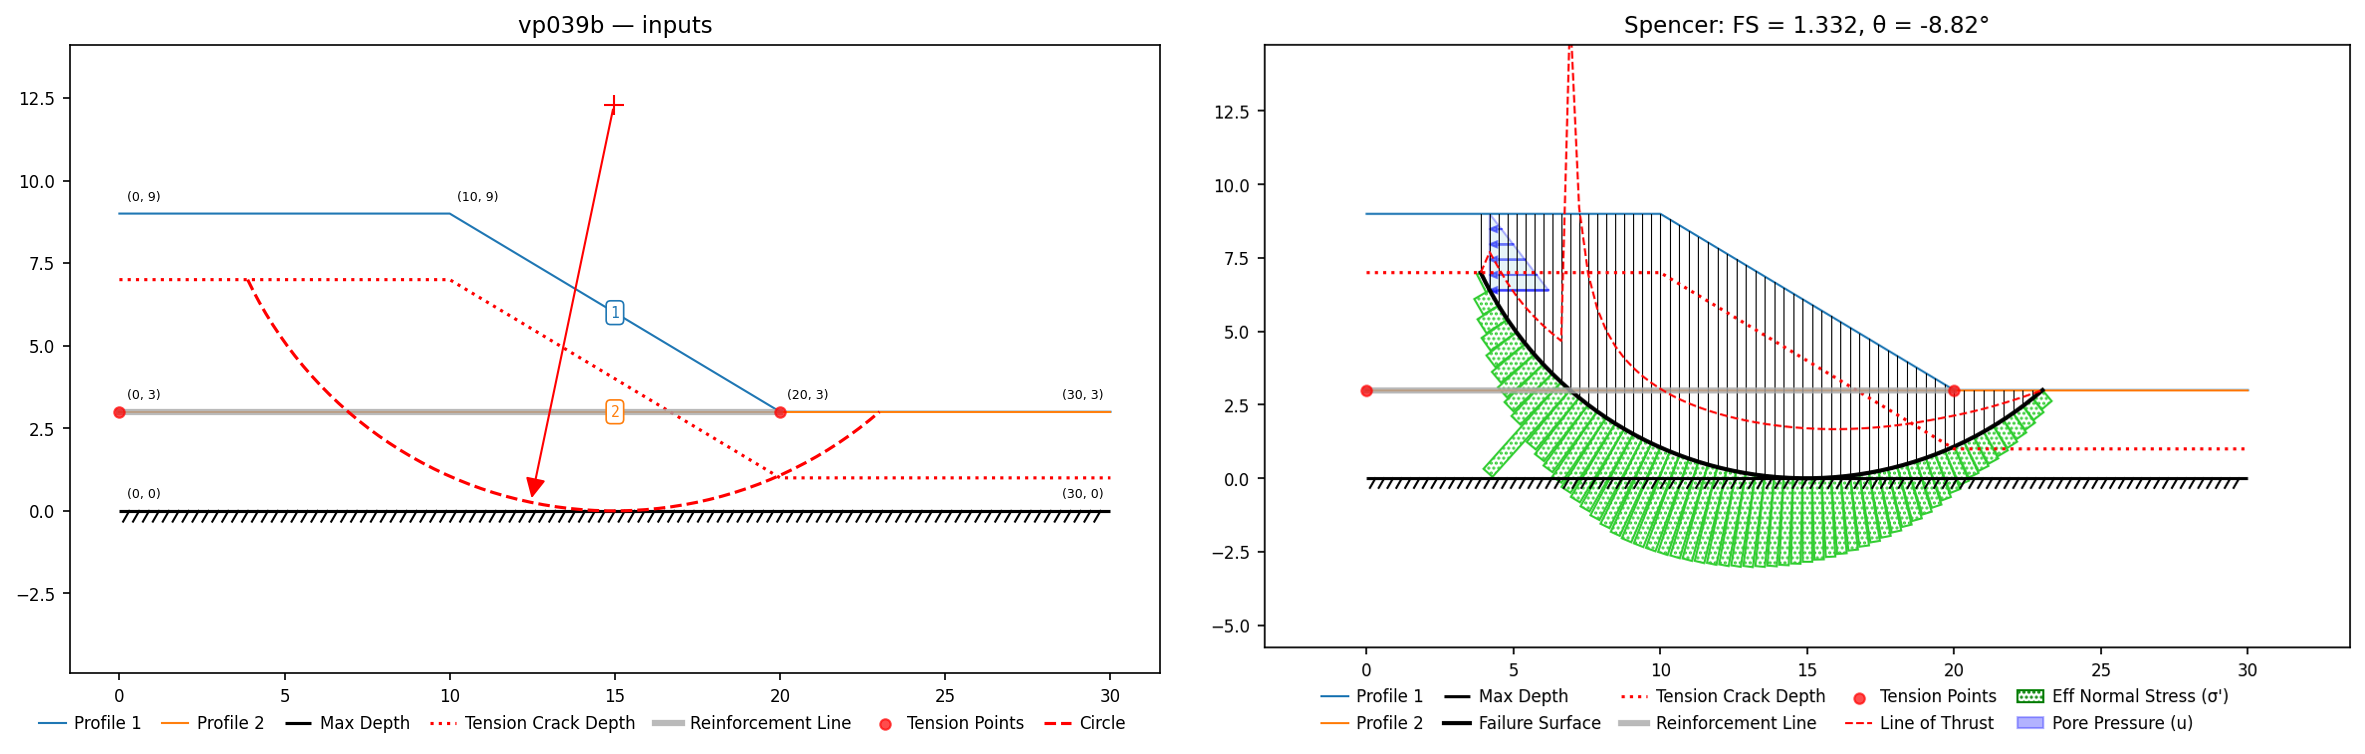
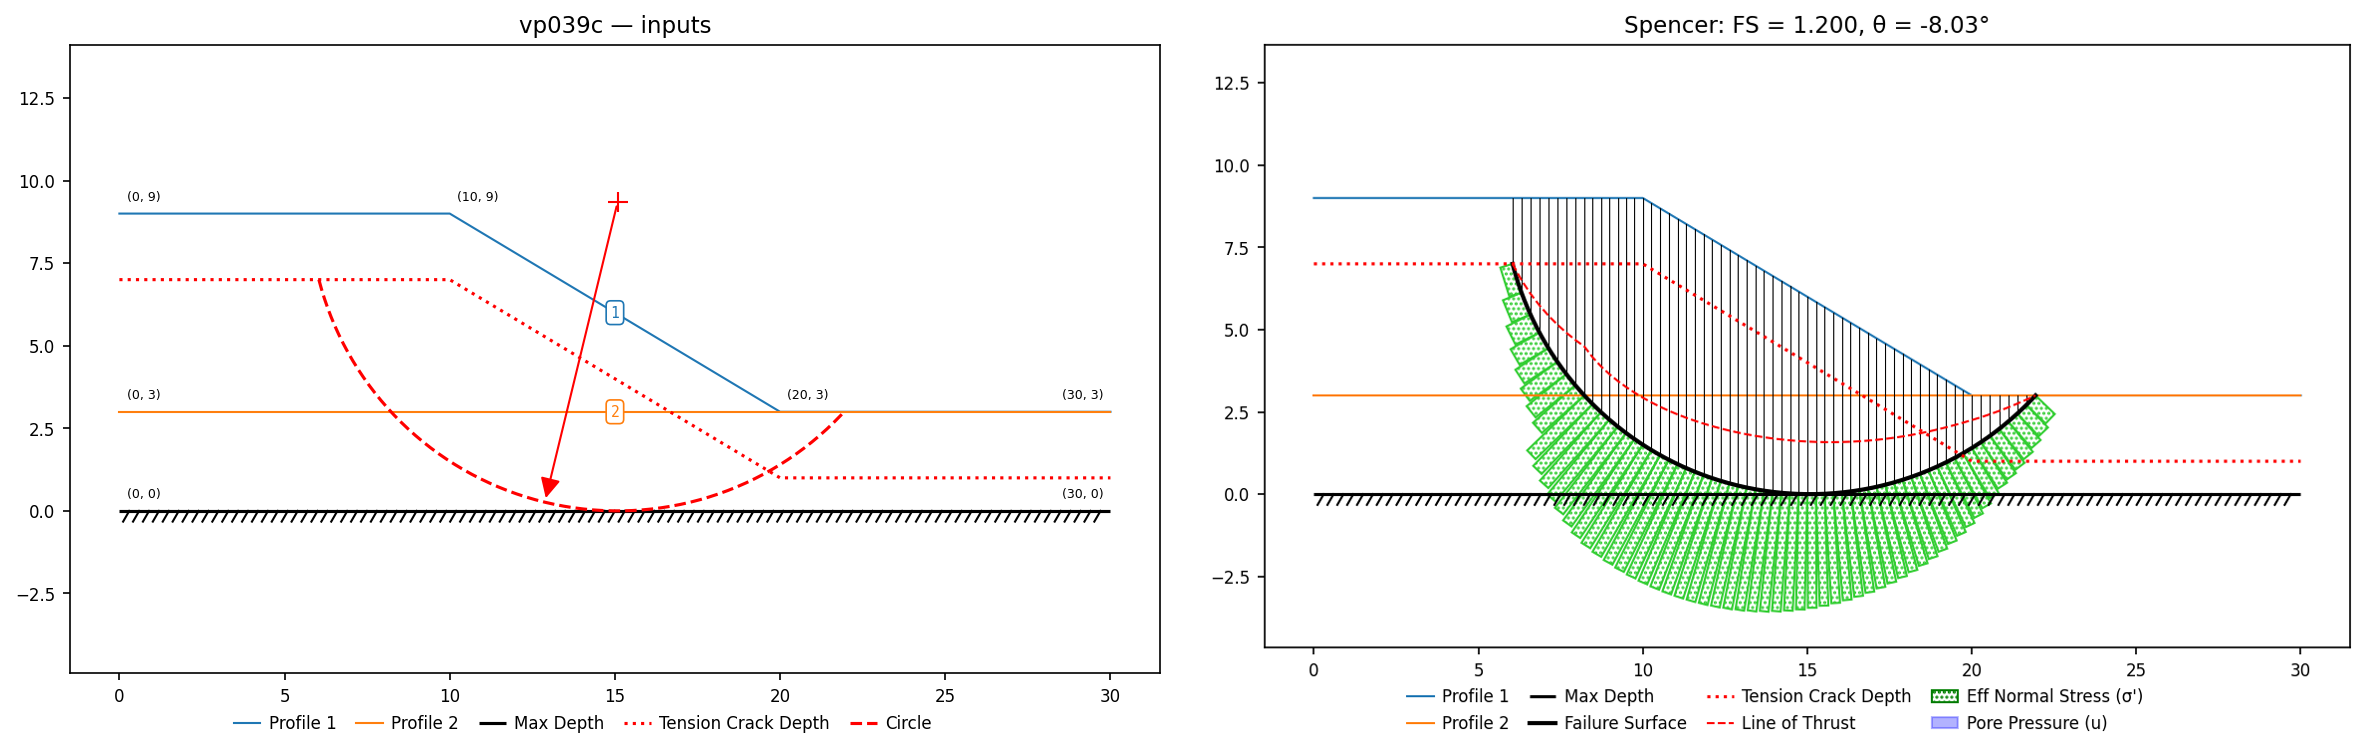
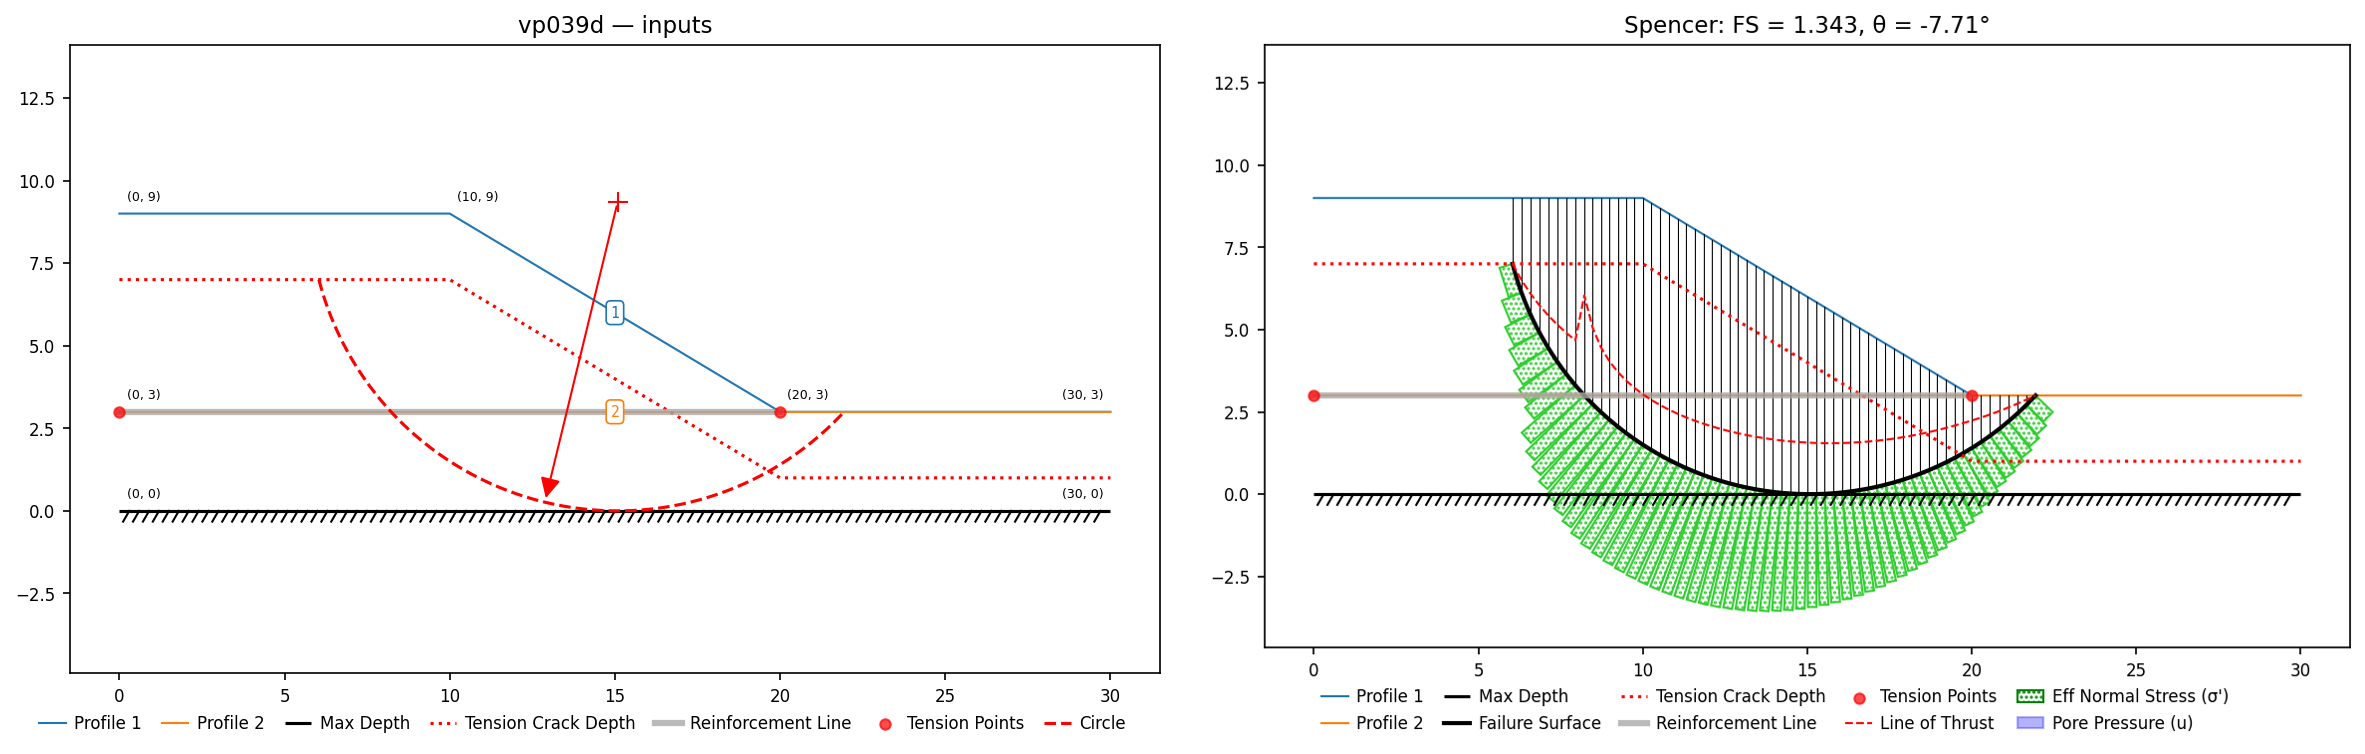
VP40: Slope, homogenous, sensitivity analysis
Input files: vp040.xlsx
Perry (1993, Fig. 10): a dry homogeneous slope with power-curve strength
τ = A·σ′ᵇ (A = 2, b = 0.7, γ = 20) evaluated on the specified five-segment surface —
and the corpus's first sensitivity benchmark: the manual sweeps A and b over ±15% of
their means (the "Rel. max/min" values 0.3 and 0.105) and publishes the FS-vs-parameter
curves. The XSLOPE sweep runs through sensitivity() on the fixed surface
(search=False, since the surface is specified), and the regression tags lock the base
case and both range endpoints for each parameter.
| Quantity | XSLOPE (Janbu) | Slide | Perry |
|---|---|---|---|
| FS on the specified surface | 1.003 corrected / 0.930 simplified | 0.944 | 0.98 |
| ΔFS over the A range (±15%) | −15.0% / +15.0% | −15.2% / +14.4% | ≈ ±13% |
| ΔFS over the b range (±15%) | −45.0% / +82.5% | −44.4% / +81.1% | −38% / +82% |
The relative sensitivities — the quantity this problem exists to verify — agree with Slide's Figure 40.3 within about a percent at every endpoint, and the A-sweep is exactly linear as theory requires (on a fixed dry surface every increment of strength scales with A). The absolute FS spread is the Janbu correction-factor convention for a power-curve soil: XSLOPE applies the c–φ correction curve (fo = 1.078) while Slide's tabulated value implies fo ≈ 1.015 on the same simplified result; the simplified factors themselves differ by 1.5%.
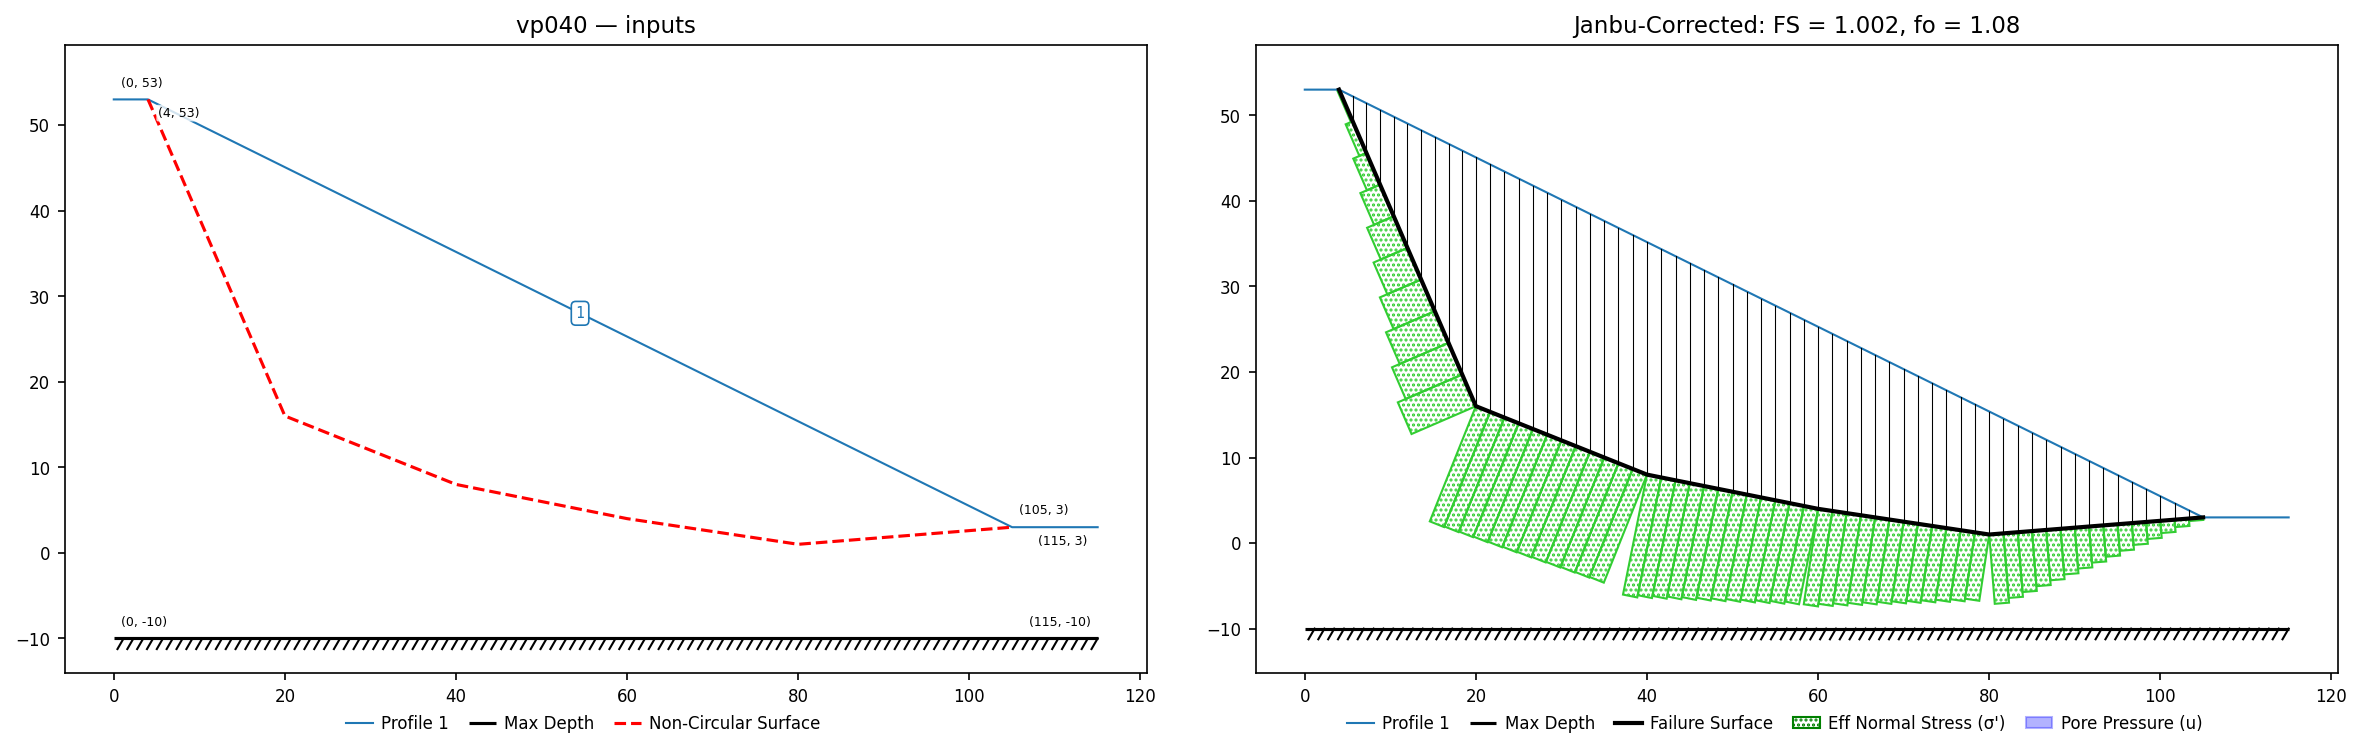
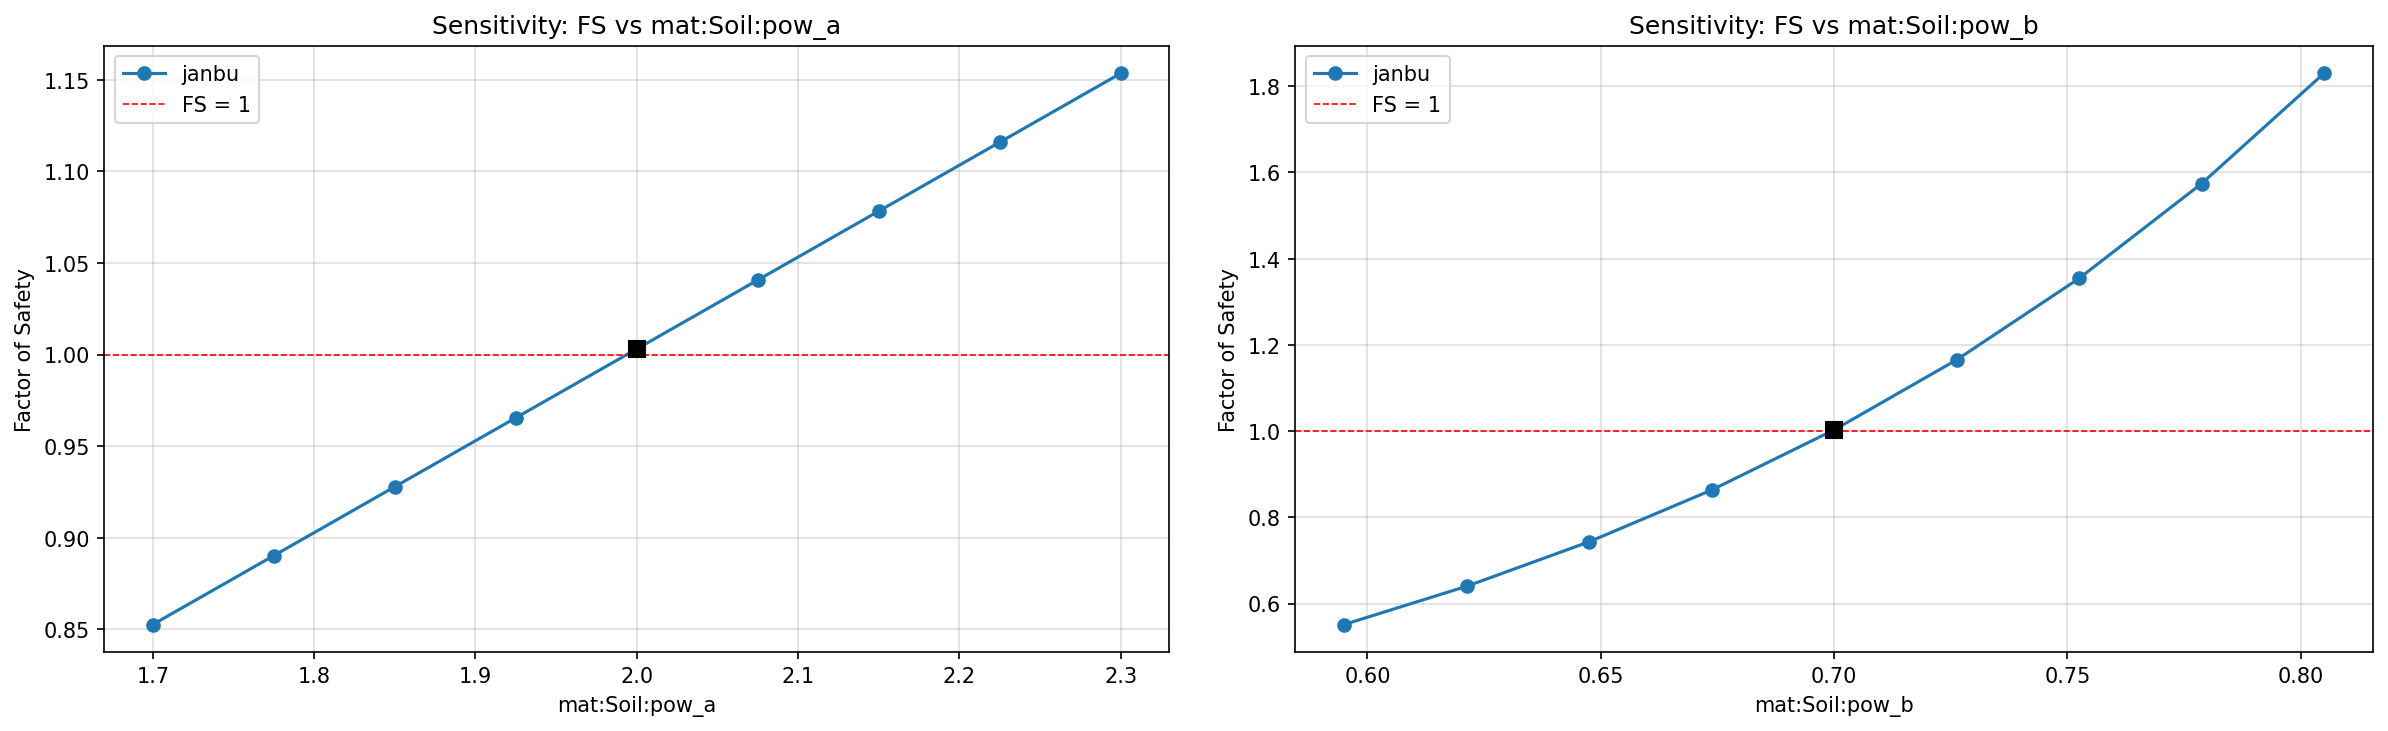
VP41: Slope, homogenous, ru pore pressure
Slide #41: Jiang, Baker & Yamagami (2003) homogeneous clay slope with power-curve strength tau = 1.4*(sigma')^0.8 and ru = 0.3 - exercises the v12 pow option and ru together. Slide2: Bishop 1.656, Janbu simplified 1.563; Charles & Soares 1.66; Baker 1.56-1.60; Perry 1.67.
Input files: vp041.xlsx
| Method | XSLOPE | Published |
|---|---|---|
| Bishop | 1.668 | Slide 1.656 (path search); Charles & Soares 1.66 |
| Janbu (corrected) | 1.660 | Slide simplified 1.563 |
| Spencer | 1.670 | — |
Published range 1.56–1.67.
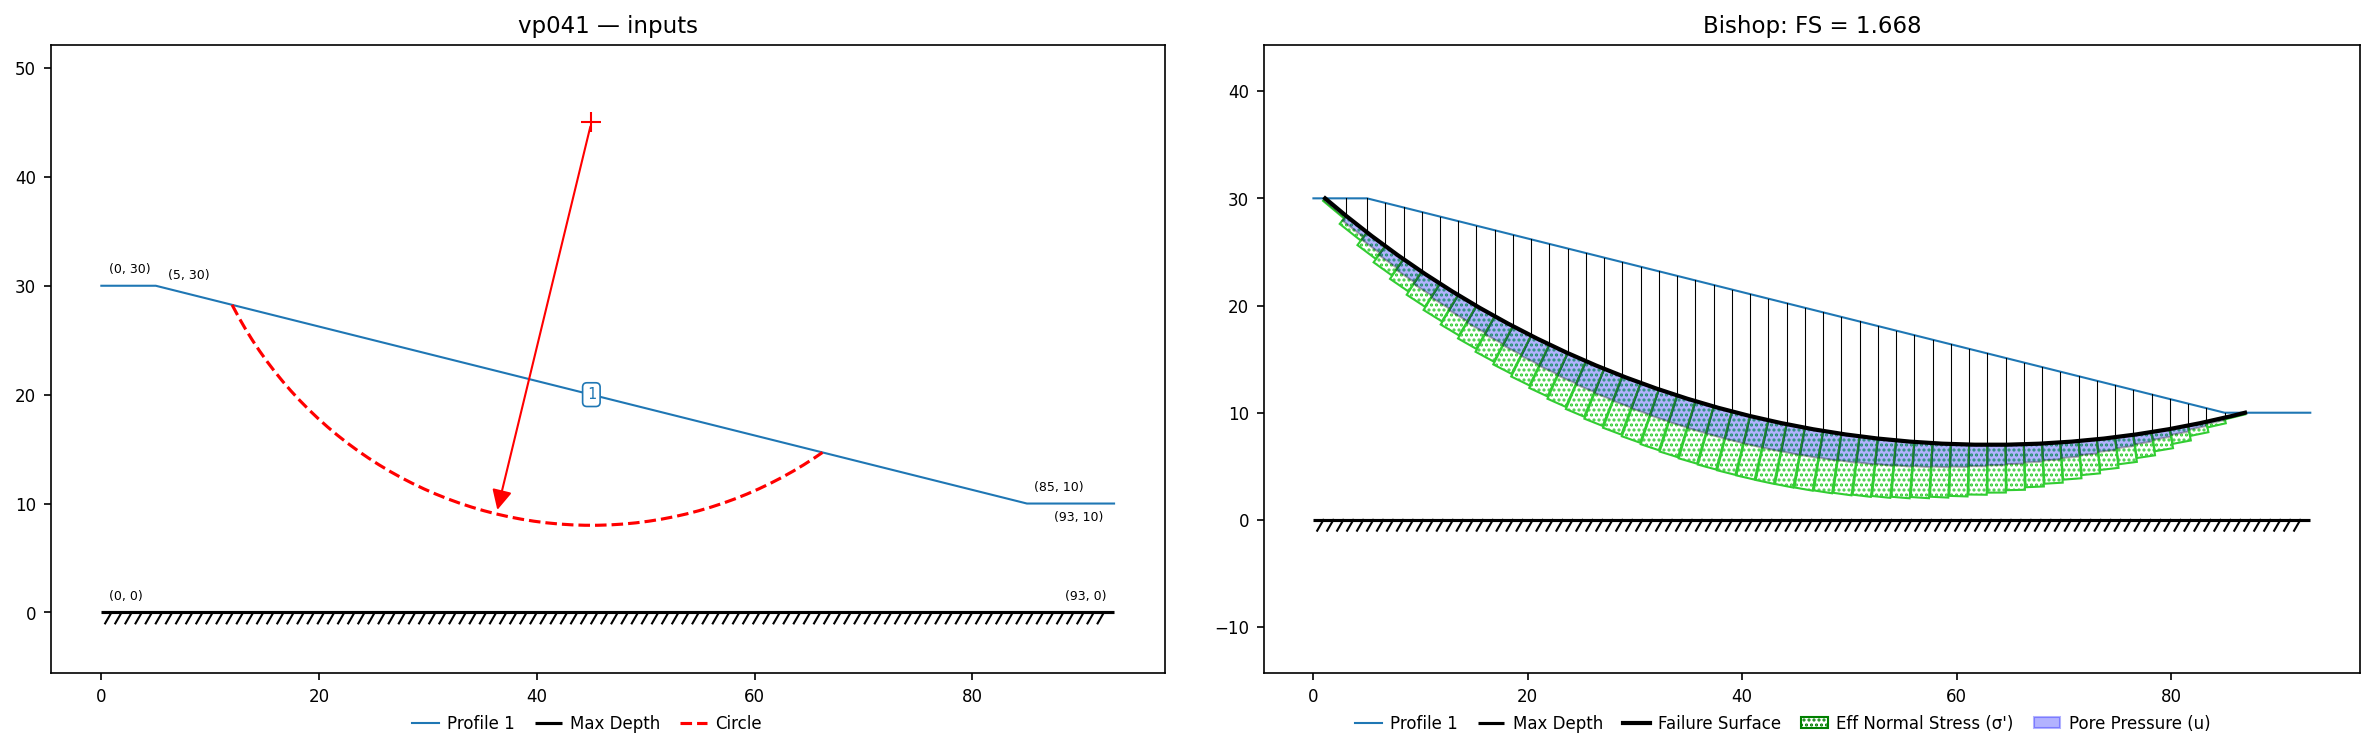
VP42: Baker & Leshchinsky safety-map dam — reservoir-loaded clay-core dam
Slide #42 / Baker & Leshchinsky (2001): the safety-map clay-core dam — granular fill (c' = 0, φ' = 40°, γ = 21.5) around a diamond core (c' = 20, φ' = 20°, γ = 20) on a hard base (c' = 200, φ' = 45°), a half-full upstream (right-side) reservoir, phreatic dropping through the core to a tailwater exit at the downstream toe, and a 5-m cracked layer at the crest modeled as a dry tension crack. Geometry is fully labeled in Slide's figure (all six core vertices); B&L's own Fig. 5(a) — the paper is in the reference library — supplies the phreatic (flat through the shell, descending through the core, half-height reservoir). The section is tiled directly as material-zone polygons matching the SLOPE/W .gsz region set (§2.25): the granular shell wraps both faces down to the foundation, so the downstream toe carries fill with continuous material coverage across the domain.
The paper states its method explicitly: pore pressures are "evaluated using the vertical distance between the phreatic surface and the slice center," and the material weights are total unit weights — the clay core is given as "{c′ = 20, φ′ = 20°, γT = 20} where {c′, φ′} are effective strength parameters and γT represents the total unit weight." It reports a global minimum Fmin = 1.91 by Spencer's method. So the published analysis uses total unit weights and explicit pore pressures from the phreatic surface — the same effective-stress convention XSLOPE uses. The vendor .gsz confirms it: identical geometry, the same three Mohr-Coulomb materials at their total unit weights, and — checked node-by-node along the failure surface — a piezometric line that matches XSLOPE's to within ~0.2 m over the submerged toe and reservoir (the zone carrying ~92% of the pore force).
What XSLOPE computes. Total unit weights, pore pressures from the piezometric line, and the reservoir as an explicit hydrostatic load on the submerged face. On the three published reference surfaces XSLOPE reproduces the published cluster:
| Surface (Spencer) | XSLOPE | Published / vendor |
|---|---|---|
| Slide's critical circle | 1.926 | Slide 1.925 |
| Baker's noncircular surface | 1.882 | Baker & Leshchinsky 1.91 |
| SLOPE/W's own critical circle | 1.939 | SLOPE/W own solve 1.934 |
Evaluated on SLOPE/W's own critical circle (center 234.9, 207.1, R = 204.4) the two programs agree to within 0.005 in Spencer FS on the same surface, same geometry, same water, with XSLOPE's total sliding-mass weight ≈ 56,020 against SLOPE/W's 56,127. The stored-circle result is regression-locked as VP42-circle (OMS 1.773, Bishop 1.882, Spencer 1.926, M-P 1.925) and Baker's surface as VP42-noncirc (Spencer 1.882, M-P 1.869).
Reservoir-load statics, validated. XSLOPE carries the reservoir as a hydrostatic traction normal to the submerged face. For a fully submerged still-water slope this treatment is exact: on an identical circle it reproduces the closed-form dry-buoyant-weight solution (γ′ = γsat − γw, no water, no load) to within 0.006 in Bishop and Spencer FS. The alternative of folding the ponded-water column into vertical slice weight is genuinely inequivalent — it differs by tens of percent and can drive the base into non-physical tension — so xslope keeps the water formulation explicit rather than buoyant. FS on this deep, mostly-submerged circle is sensitive to the phreatic (a uniform 1-m lowering of the line moves Spencer ≈ 0.075), which is why the line was audited against the vendor .gsz and matches to within ~0.2 m where it counts; the reservoir level (el 30) is pinned by the water surface and shared by both programs.
Input files: vp042.xlsx
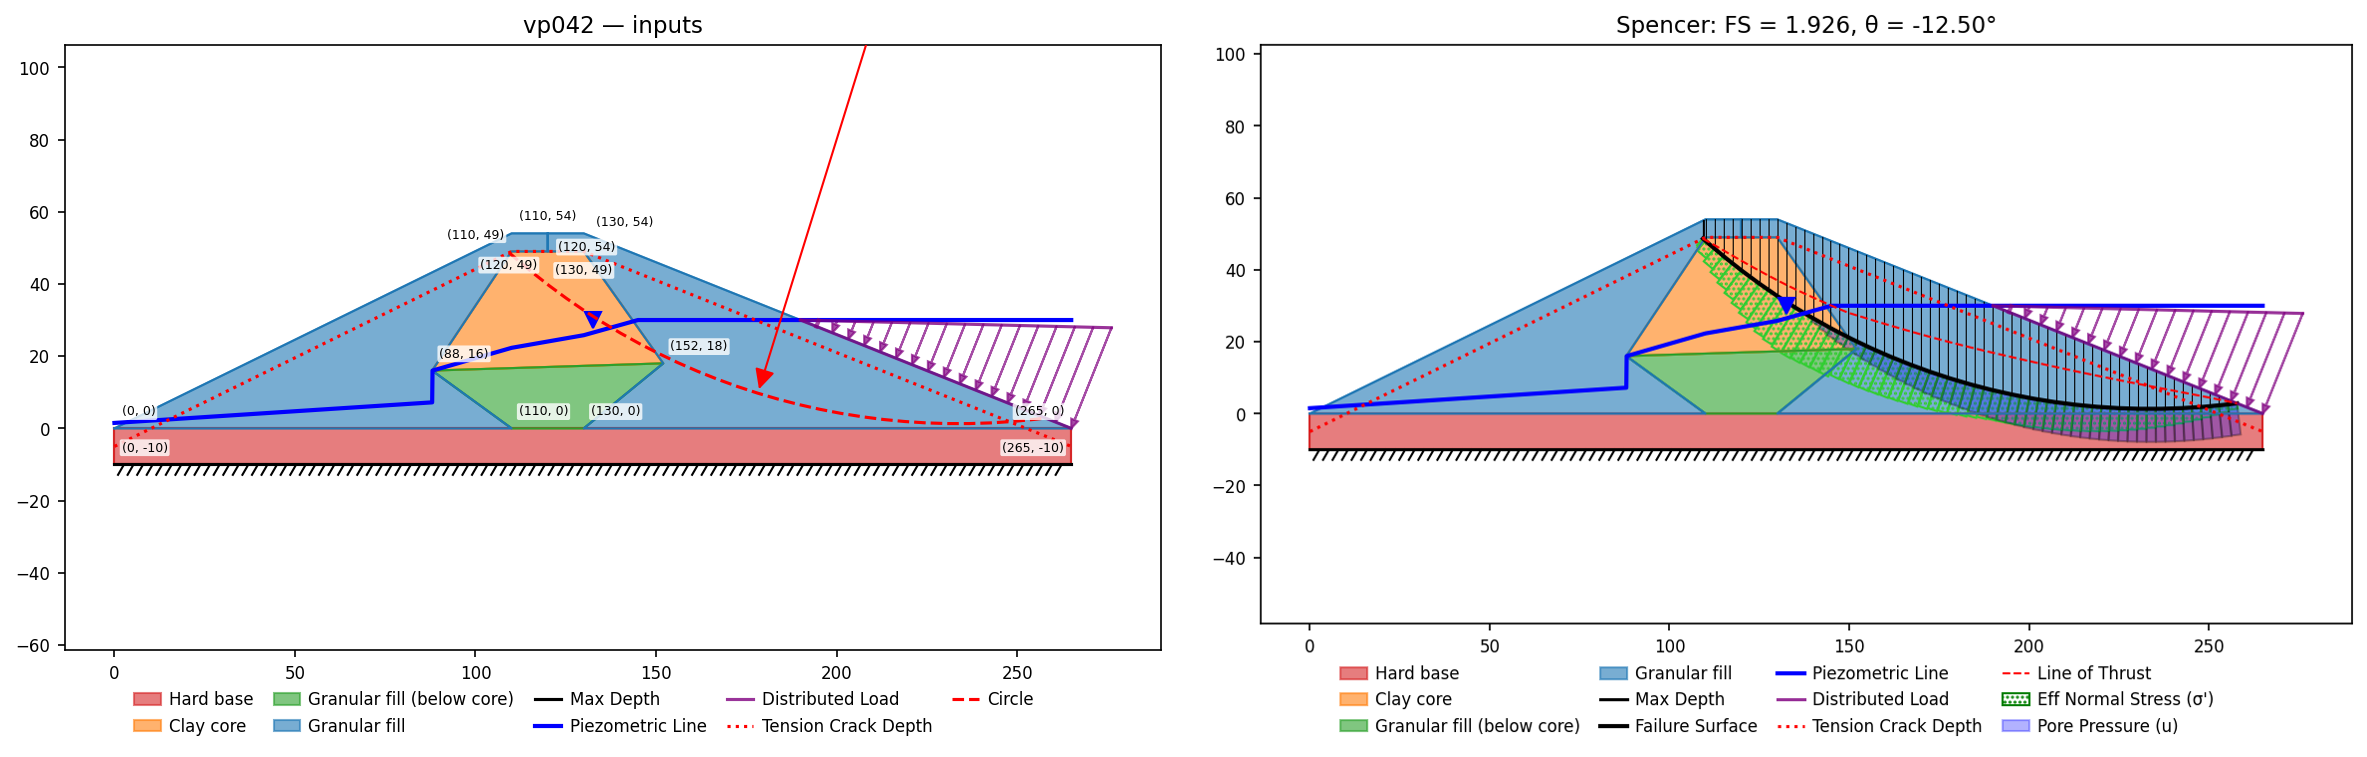
VP43: Slope, homogeneous — planar surface (Baker 2001)
Slide #43 / Baker (2001): the planar-slip-surface benchmark on a homogeneous, dry c′-φ′ slope (H = 10 m, c′ = 30 kPa, φ′ = 30°, γ = 20 kN/m³), with the factor of safety evaluated on planes through the toe as a function of where the plane daylights on the backslope. Baker's critical plane sits at X = x/H = 0.85, and Slide/RocPlane/Baker all report FS ≈ 1.35 (Slide circular 1.329).
The original build inferred a 3.0 m crest offset (face 73.3°) from the manual's unlabeled figure and read Spencer ≈ 1.43 — reproducible against the ≈ 1.35 references only with different soil properties, so the property table looked suspect. The SLOPE/W model for the same problem settles it: it stores the geometry exactly, with the crest offset at 2.5 m (face angle atan(10/2.5) = 75.96°). Rebuilt on that geometry, the critical slip plane runs from the toe (0, 0) to the daylight point (8.5, 10) — inclination 49.6°, matching Slide's reported ≈ 49.5° — and both endpoints lie on the ground surface, so no construction apron is needed. The discrepancy was a geometry-reading error, not a property-table error.
Input files: vp043.xlsx
| Method | XSLOPE | Slide / RocPlane / Baker |
|---|---|---|
| Spencer | 1.352 | RocPlane 1.351; Baker's Culmann ≈ 1.35 |
| Janbu (corrected) | 1.352 | Slide circular 1.329 |
Spencer and Janbu on the toe-to-(8.5, 10) plane both read 1.352, matching SLOPE/W's own solve of the identical plane (1.352, §2.26) and the RocPlane/Baker references. Morgenstern-Price, Corps, and Lowe-Karafiath decline this single straight plane: α is constant for every slice, and reaching equilibrium drives most interslice forces into tension, which the admissibility guard rejects — Spencer is the rigorous method that converges (same behavior as SLOPE/W §2.26).
Sources: Slide Slope Stability Verification Manual §43; GeoStudio SLOPE/W Verification Manual §2.26; Baker (2001); Baker & Leshchinsky (2001).
VP44: Slope, homogeneous — linear vs non-linear envelope (Baker ex. 1)
Slide #44 / Baker (2003) example problem 1: a straight 43° slope, H = 6 m, γ = 18 kN/m³, in compacted Israeli clays, analyzed with three strength models fitted to the same triaxial data: (a) the power curve τ = 1.107·σ′^0.86 (Baker's A = 0.58, n = 0.86, T = 0); (b) the experimentally fitted Mohr-Coulomb envelope c′ = 11.64 kPa, φ′ = 24.7° (Table I, iteration 0 of Baker's paper — this resolves the property-table ambiguity in the Slide manual); and (c) Baker's converged local-linear-approximation parameters c′ = 0.39 kPa, φ′ = 38.6°. The point of the example is the danger of extrapolating a linear envelope into the low-stress range: the M-C fit says FS = 1.5, the non-linear law says the slope is failing.
Input files: vp044a.xlsx, vp044b.xlsx, vp044c.xlsx
| Case | Method | XSLOPE | Published |
|---|---|---|---|
| (a) power curve | Spencer | 0.958 | Slide 0.960; Baker 0.97 |
| (b) Mohr-Coulomb | Spencer | 1.518 | Slide 1.536; Baker 1.50 |
| (c) LLA converged | Spencer | 0.980 | Slide 0.981; Baker 0.97 |
Baker states γ = 18 for all his examples; the Slide manual's table prints 19.5, which reconciles with neither program's results (γ = 19.5 gives Spencer 1.459 on case b). Slide's Janbu values are simplified/uncorrected, as in #45.
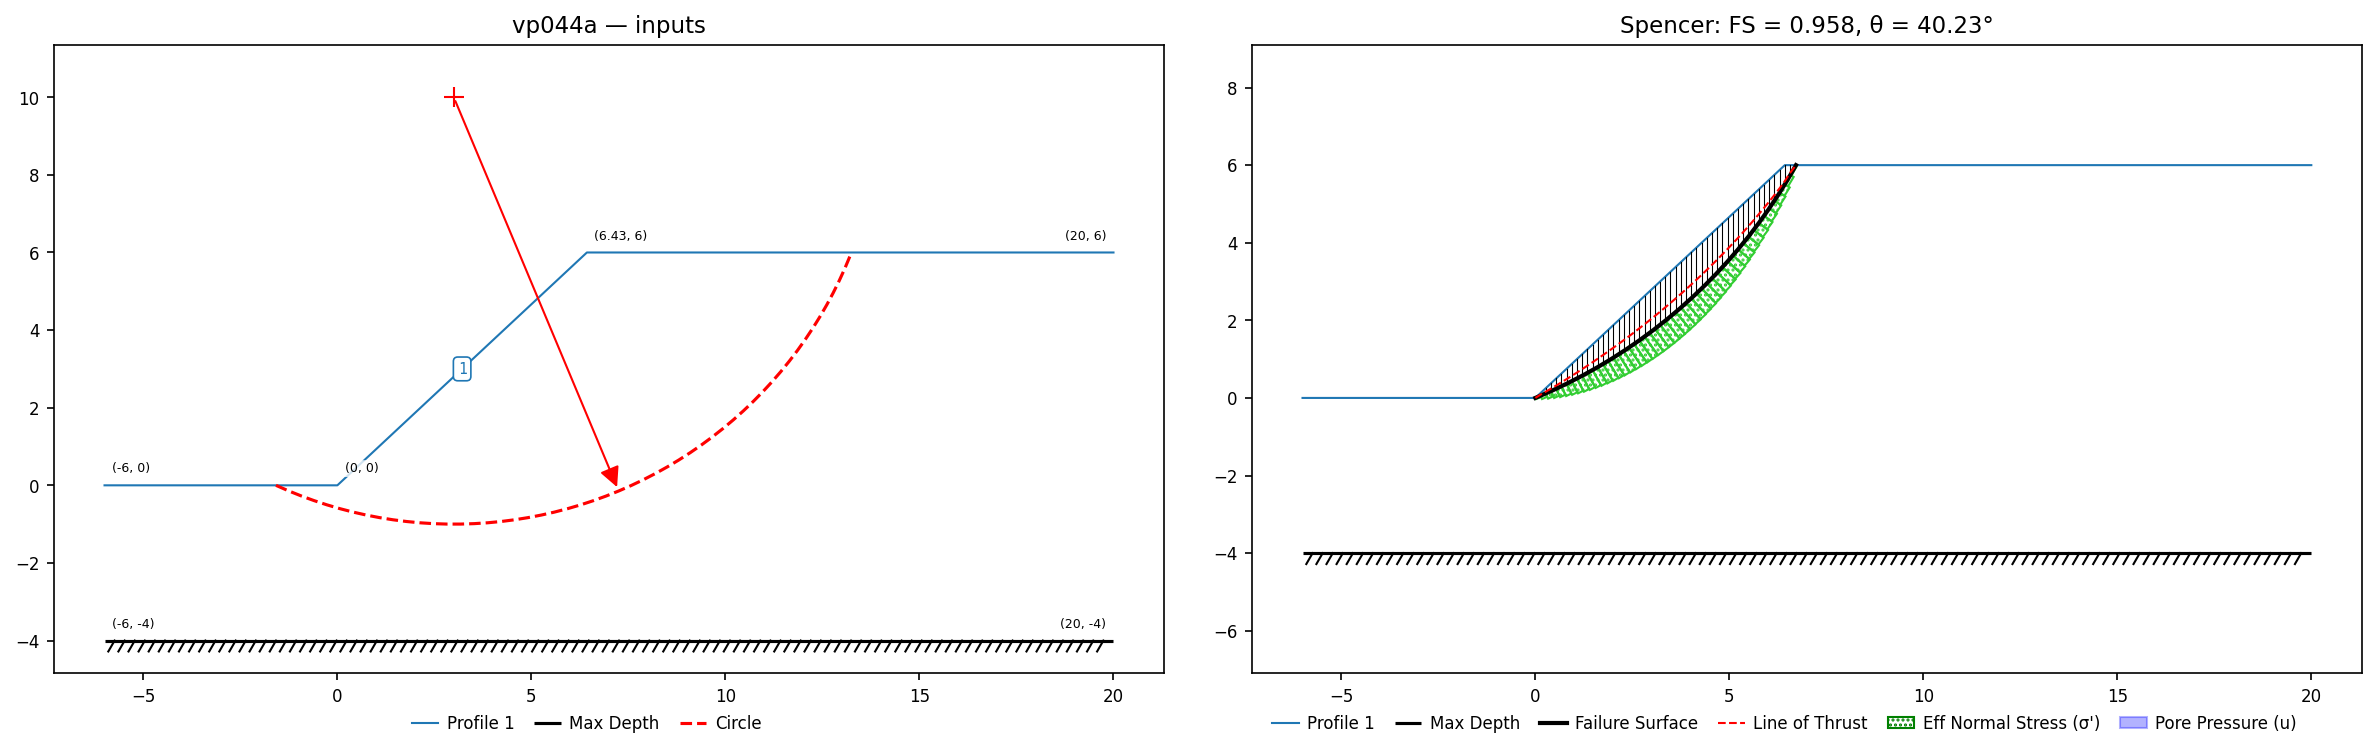
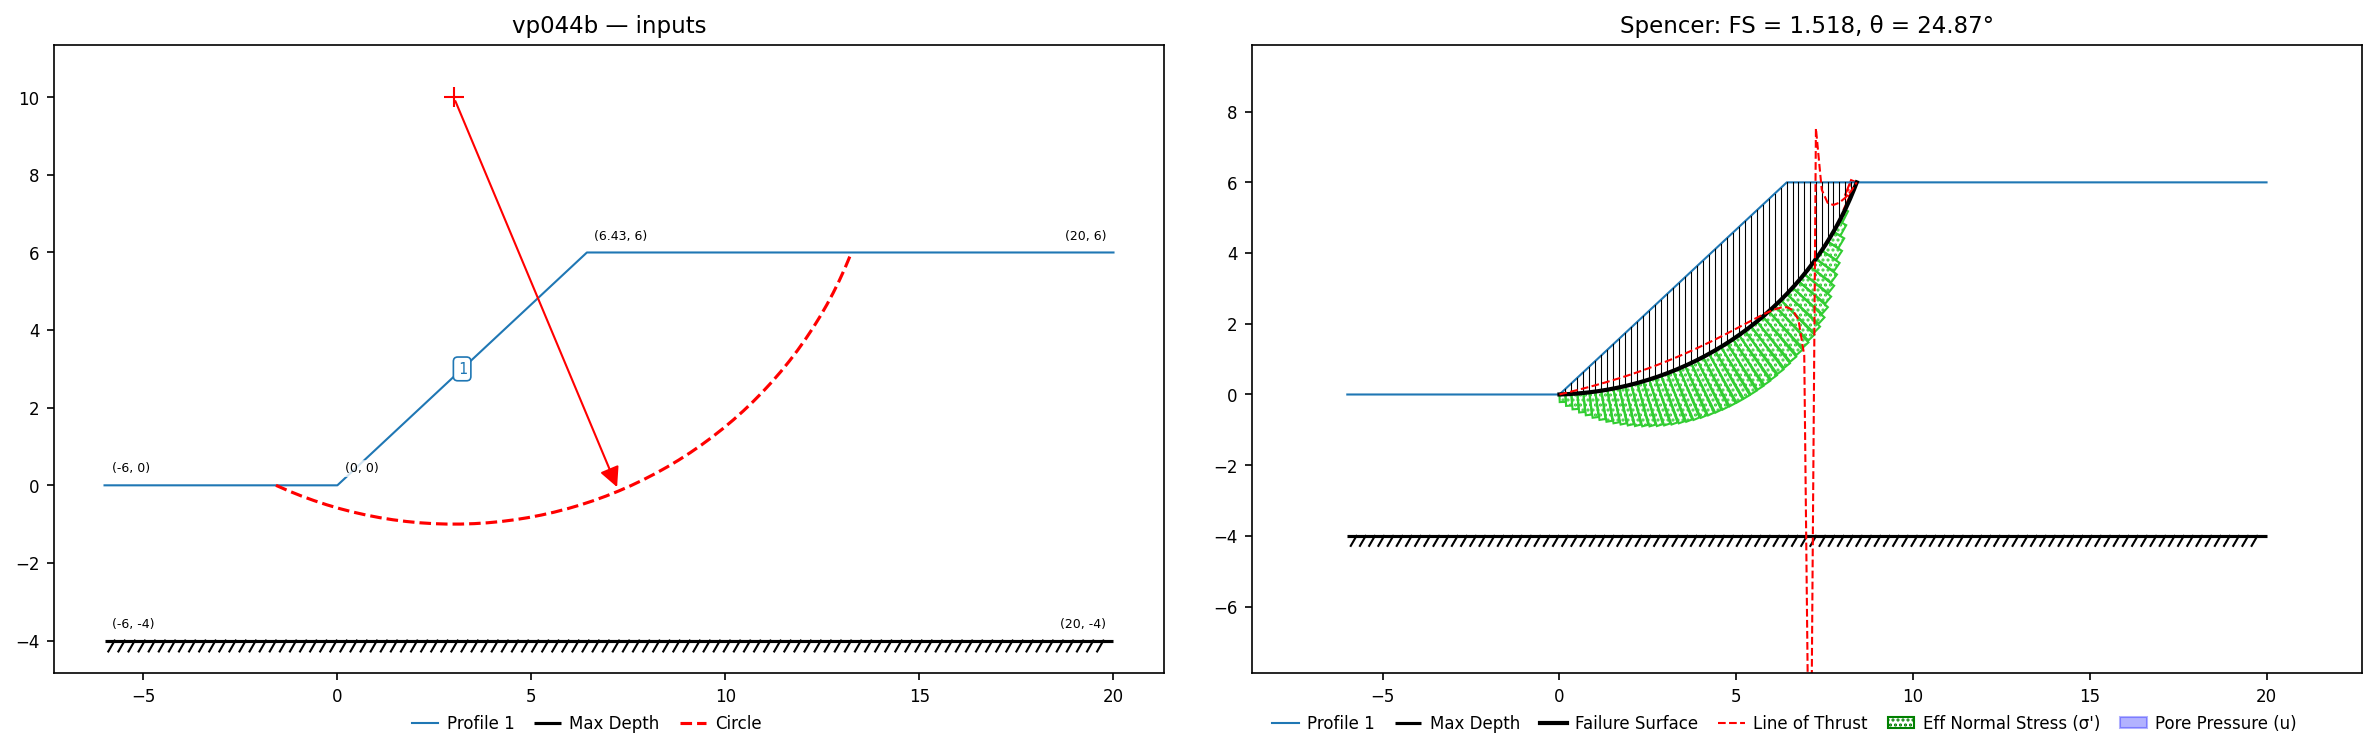
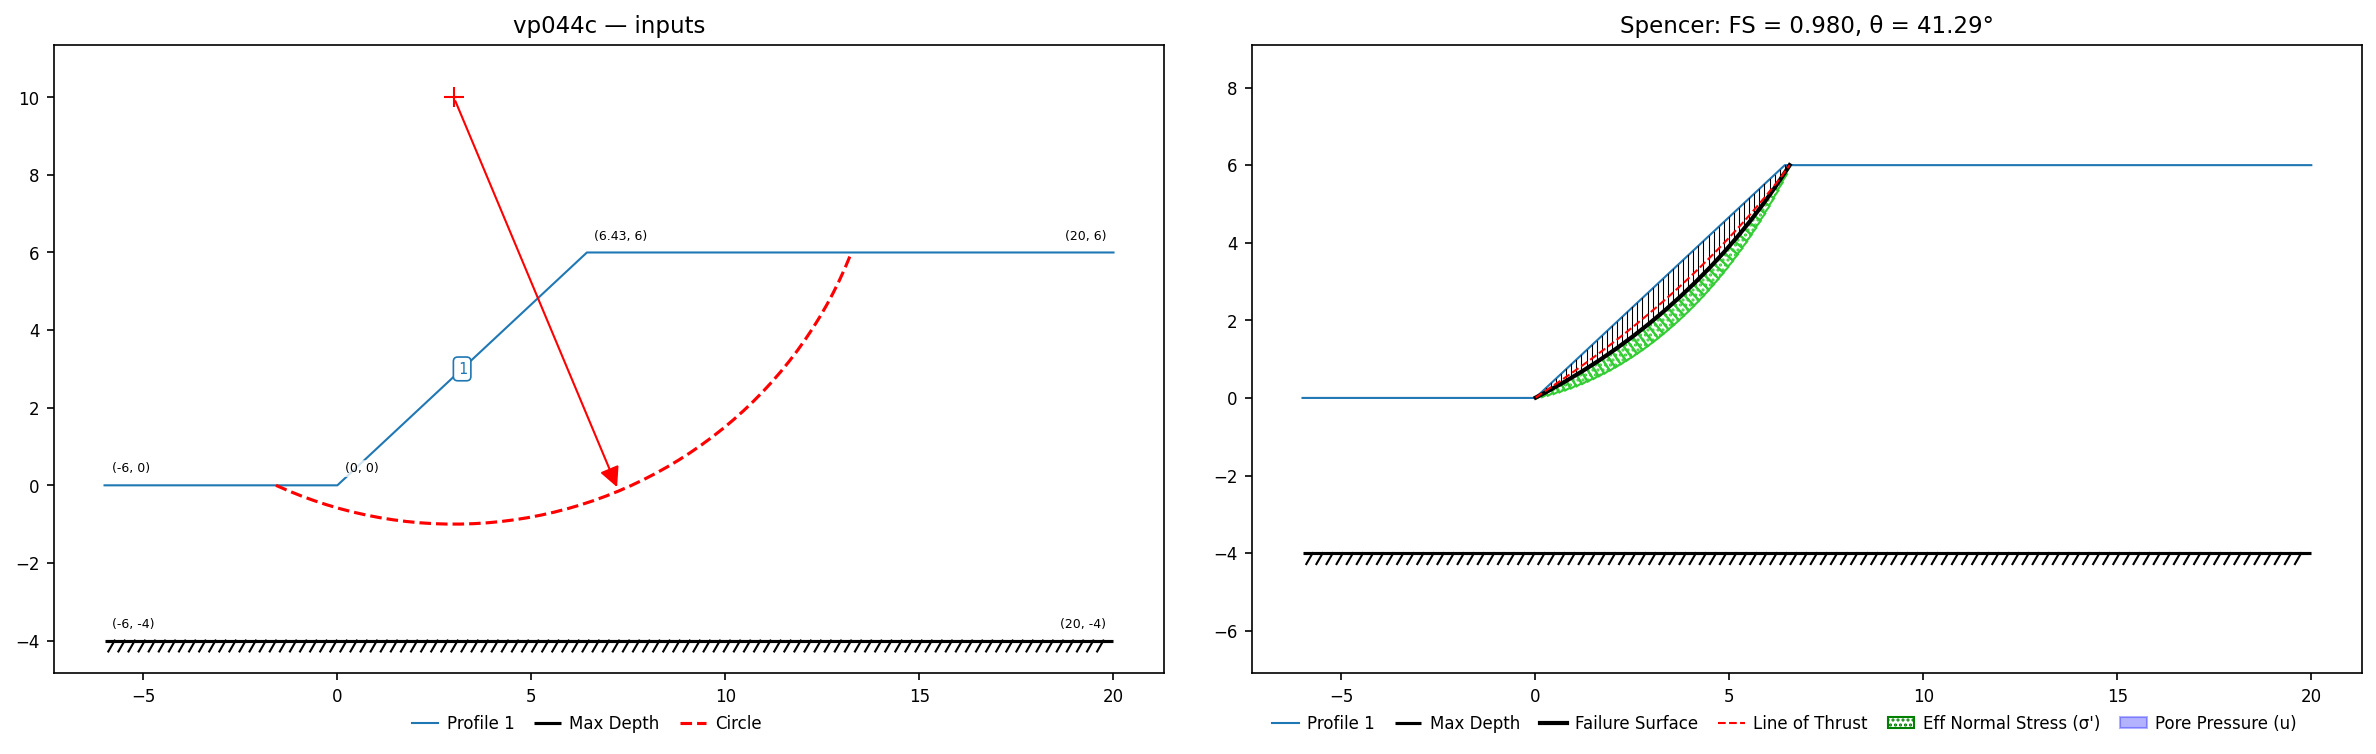
VP45: Slope, homogenous
Slide #45, Mohr-Coulomb case: c'=11.64, phi'=24.7, gamma=18. Slide2: Janbu simplified 2.662, Spencer 2.794.
Slide #45, power-curve case: tau = 1.107*(sigma')^0.86 (Baker's A=0.58, n=0.86, T=0). Slide2: Janbu simplified 2.559, Spencer 2.662; Baker's accepted values for this example are of the same order.
Input files: vp045a.xlsx, vp045b.xlsx
Mohr-Coulomb case
| Method | XSLOPE | Published |
|---|---|---|
| Spencer | 2.801 | Slide 2.794 |
Power-curve case
| Method | XSLOPE | Published |
|---|---|---|
| Spencer | 2.649 | Slide 2.662 |
Slide’s Janbu values are simplified/uncorrected; ours carry fo and agree once scaled.
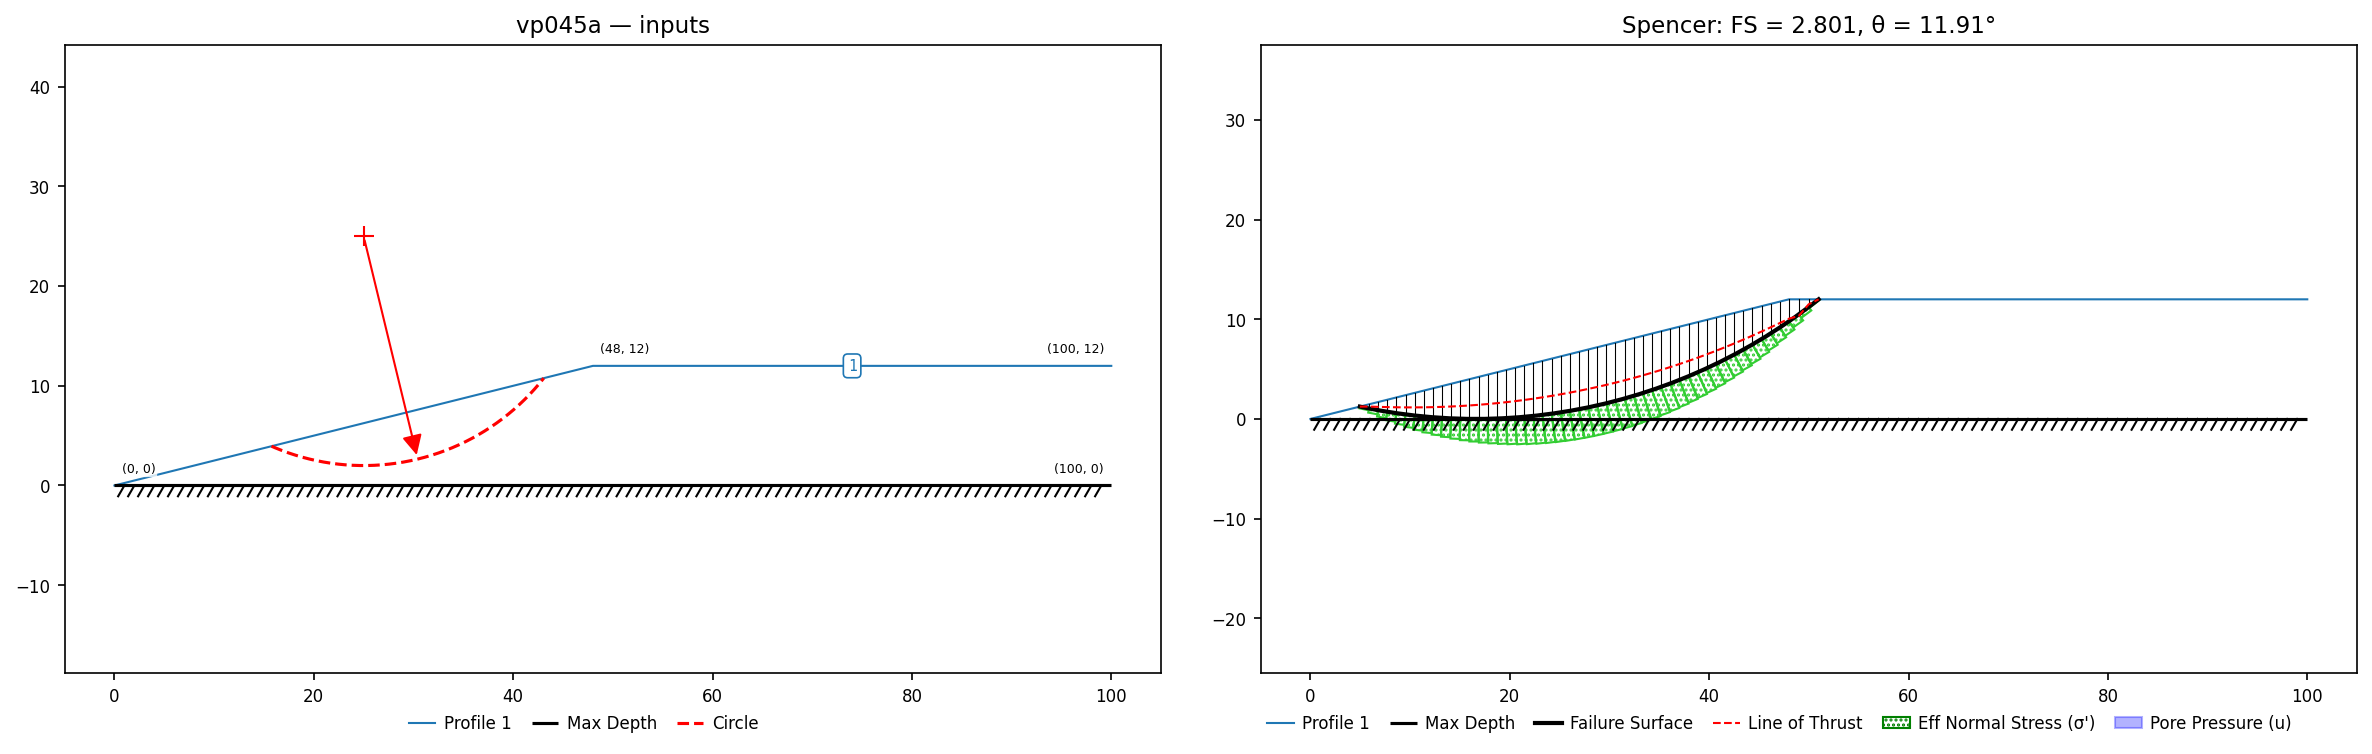
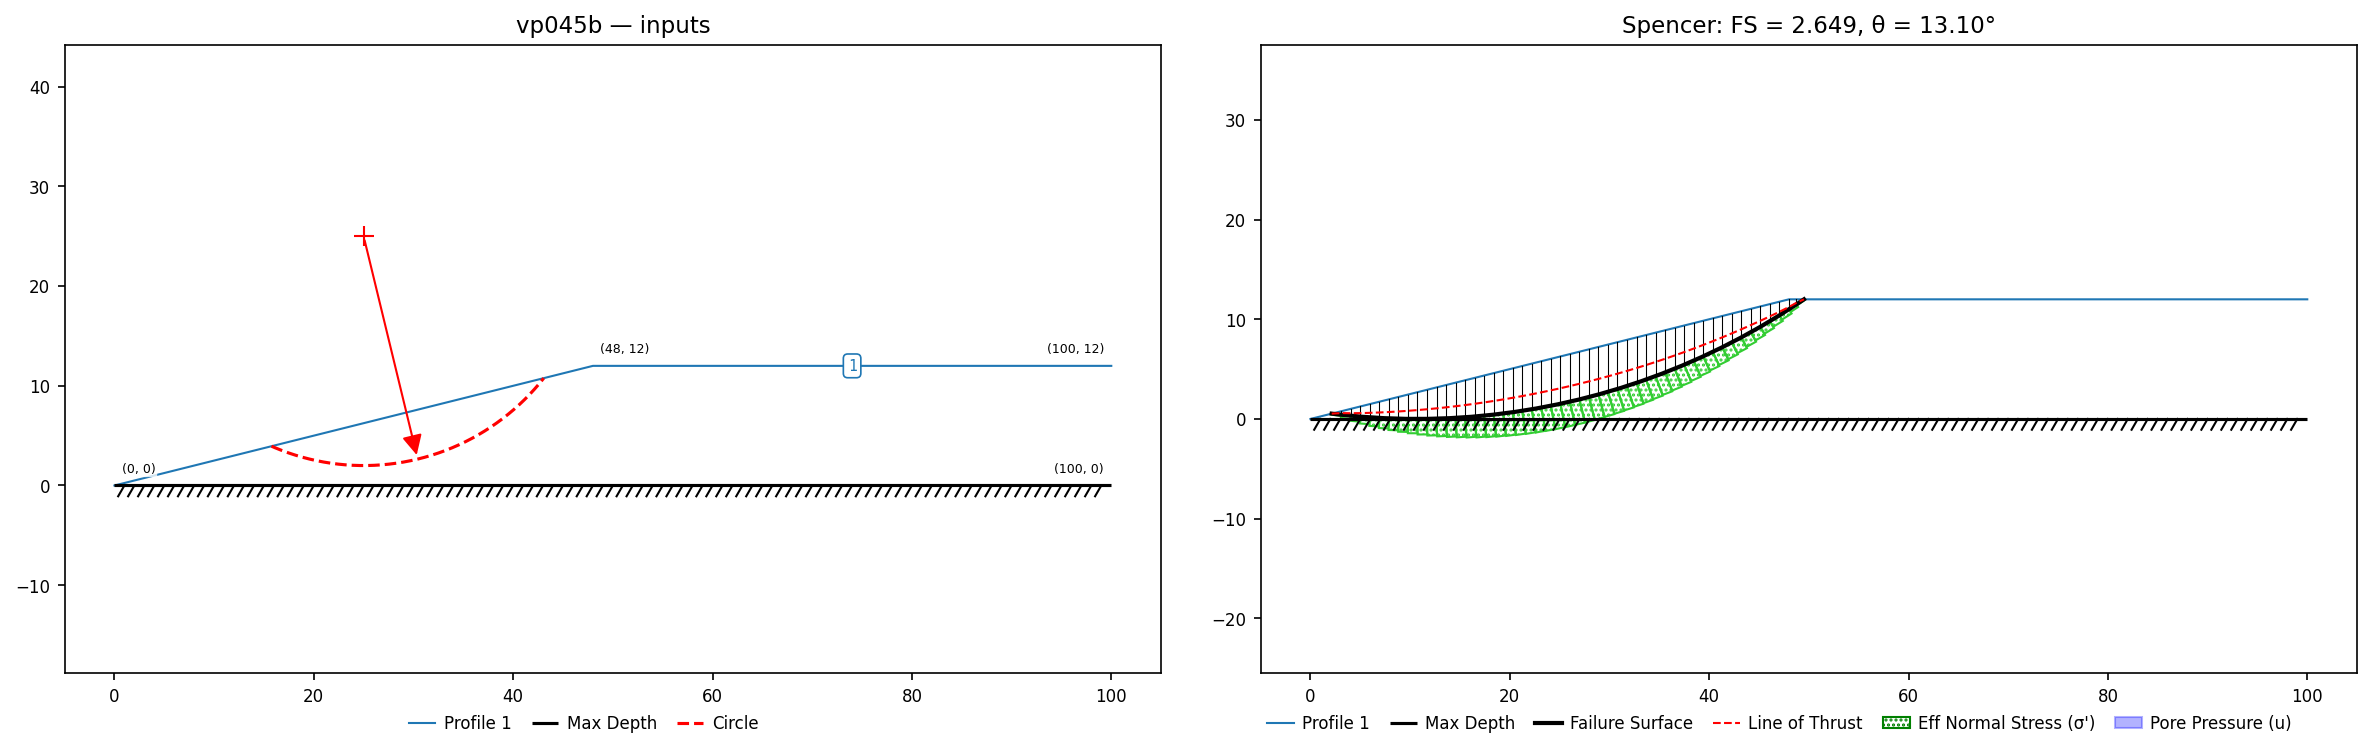
VP46: Baker (1993) three-stage dam — stages 1-2 built
Slide #46 / Baker (1993): a three-loading-stage validation dam — (1) end-of-construction with an empty reservoir, (2) steady-state seepage with a full reservoir, (3) rapid drawdown. The manual states outright that this is a validation problem: Baker's paper gives no numeric permeability (the natural and compacted clays are simply "approximately equal", with a 10:1 horizontal:vertical anisotropy, p. 32), so Rocscience estimated the seepage parameters, and the stage-3 undrained strengths live in Baker's own discrete functions (Compacted Clay.fn6 / Natural Clay.fn6). Stages 1 (dry) and 2 (steady-state seepage) are both built — stage 2 by solving the seepage first-principles from the conductivity ratios Baker publishes (below), the absolute value being FS-irrelevant. Stage 3 (rapid drawdown) stays gated on the undrained-strength field, which is printed only as a two-dimensional contour map no per-material 1-D function reproduces to lock tolerance.
A small compacted-clay embankment (crest el 101, toes at x = 80 and x = 128, both el 95) sits on a deep natural-clay foundation; downstream, the natural-clay ground drops on a 4H:1V face from (128, 95) to the toe bench (148, 90) and runs flat to x = 220. Geometry from Figure 46.1 (axis-tick-calibrated vertex extraction). Materials (Table 46.1): compacted clay c′ = 6.5 kPa, φ′ = 40°, γ = 18; natural clay c′ = 0, φ′ = 32°, γ = 18.
Input files: vp046.xlsx (stage 1, dry) / vp046b.xlsx (stage 2, steady seepage, with _mesh.json / _seep.csv sidecars)
The critical mechanism is the cohesionless (c′ = 0) downstream natural-clay face. For c′ = 0 the infinite-slope factor of safety FS = tan φ′ / tan β is depth-independent; on the 4H:1V face (β = atan(1/4) = 14.04°) that is the closed form tan 32° / tan 14.04° = 2.50 — the manual's "Theoretical FS = 2.5". XSLOPE's circular search rides that face (every slice base ≈ 14°) and lands on it:
| Method | XSLOPE | Published |
|---|---|---|
| Spencer (circular) | 2.500 | Slide 2.534; Baker 2.41; theory 2.5 |
| Bishop (circular) | 2.500 | — |
XSLOPE reproduces the theoretical infinite-slope value exactly. Slide's published Spencer 2.534 is a minimum-depth-5m noncircular random search, which rides a 5-m slab slightly off the pure infinite-slope minimum and so reads ~1.4% high; Baker (1993) 2.41 sits ~3.6% below theory. XSLOPE brackets both, on theory.
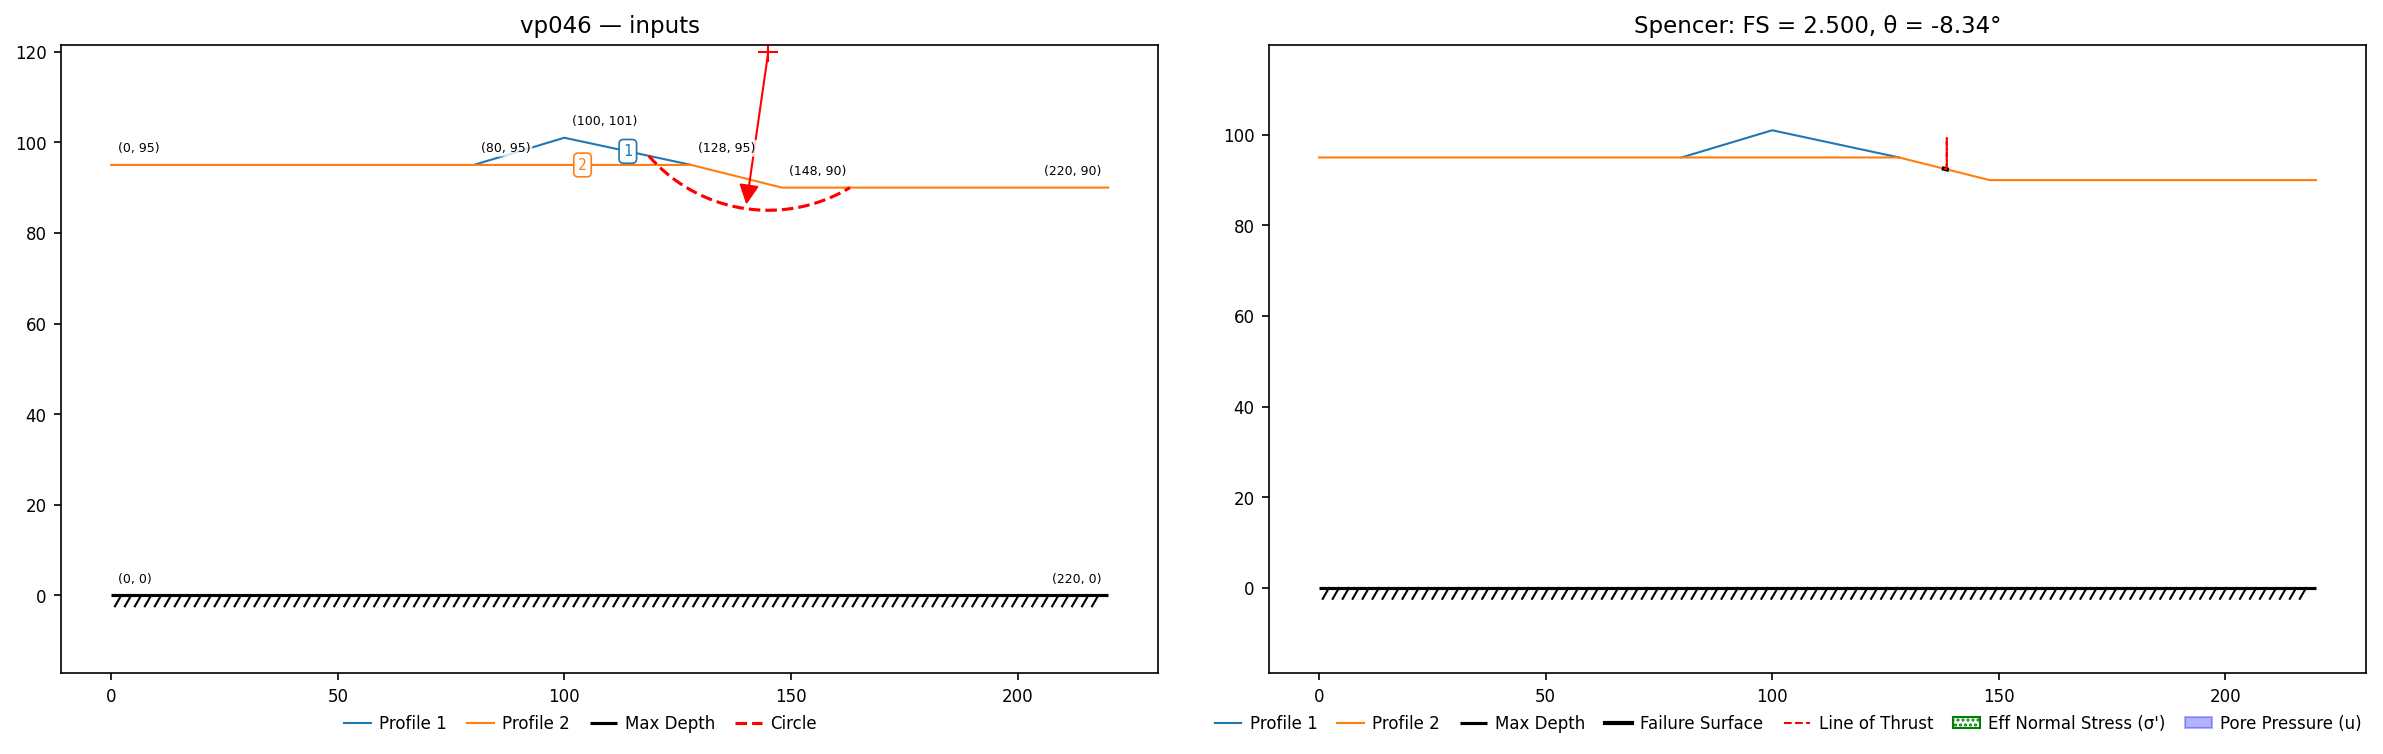
Stage 2 — steady seepage, full reservoir (built). With the reservoir full at el 100 the pore pressures come from a steady FE seepage field XSLOPE solves itself (u='seep', _mesh.json / _seep.csv sidecars, the same route as VP38): total head 100 on the submerged upstream boundary, head 0 on the base (the regional water table at el 0), the dry downstream ground an exit face, and the reservoir water carried as a distributed load on the submerged face. The conductivities are the ratio quantities Baker does publish — the natural and compacted clays equal, with a 10:1 horizontal:vertical anisotropy (p. 32) — and a steady head field depends only on those ratios, so the factor of safety is independent of the absolute conductivity: solving at Ks = 7×10⁻⁵ and at 7×10⁻⁶ m/s gives an identical FS (the absolute value sets the flow rate, not the field). The one field-relevant estimated input is the natural-clay unsaturated fringe (manual Table 46.1 Gardner a = 0.06, n = 2); halving or doubling a moves FS by ≈ ±2%. The search targets the upstream (reservoir) slope — the slope Baker's whole analysis is about, and the one Slide's inherited search limits ("Limits are as they were before") select; a global grid instead rides an unsupported downstream-toe mechanism the published analyses do not report.
| Method | XSLOPE | Published |
|---|---|---|
| Spencer (circular) | 7.086 | Slide 7.003; Baker 6.98 |
| Bishop (circular) | 7.093 | — |
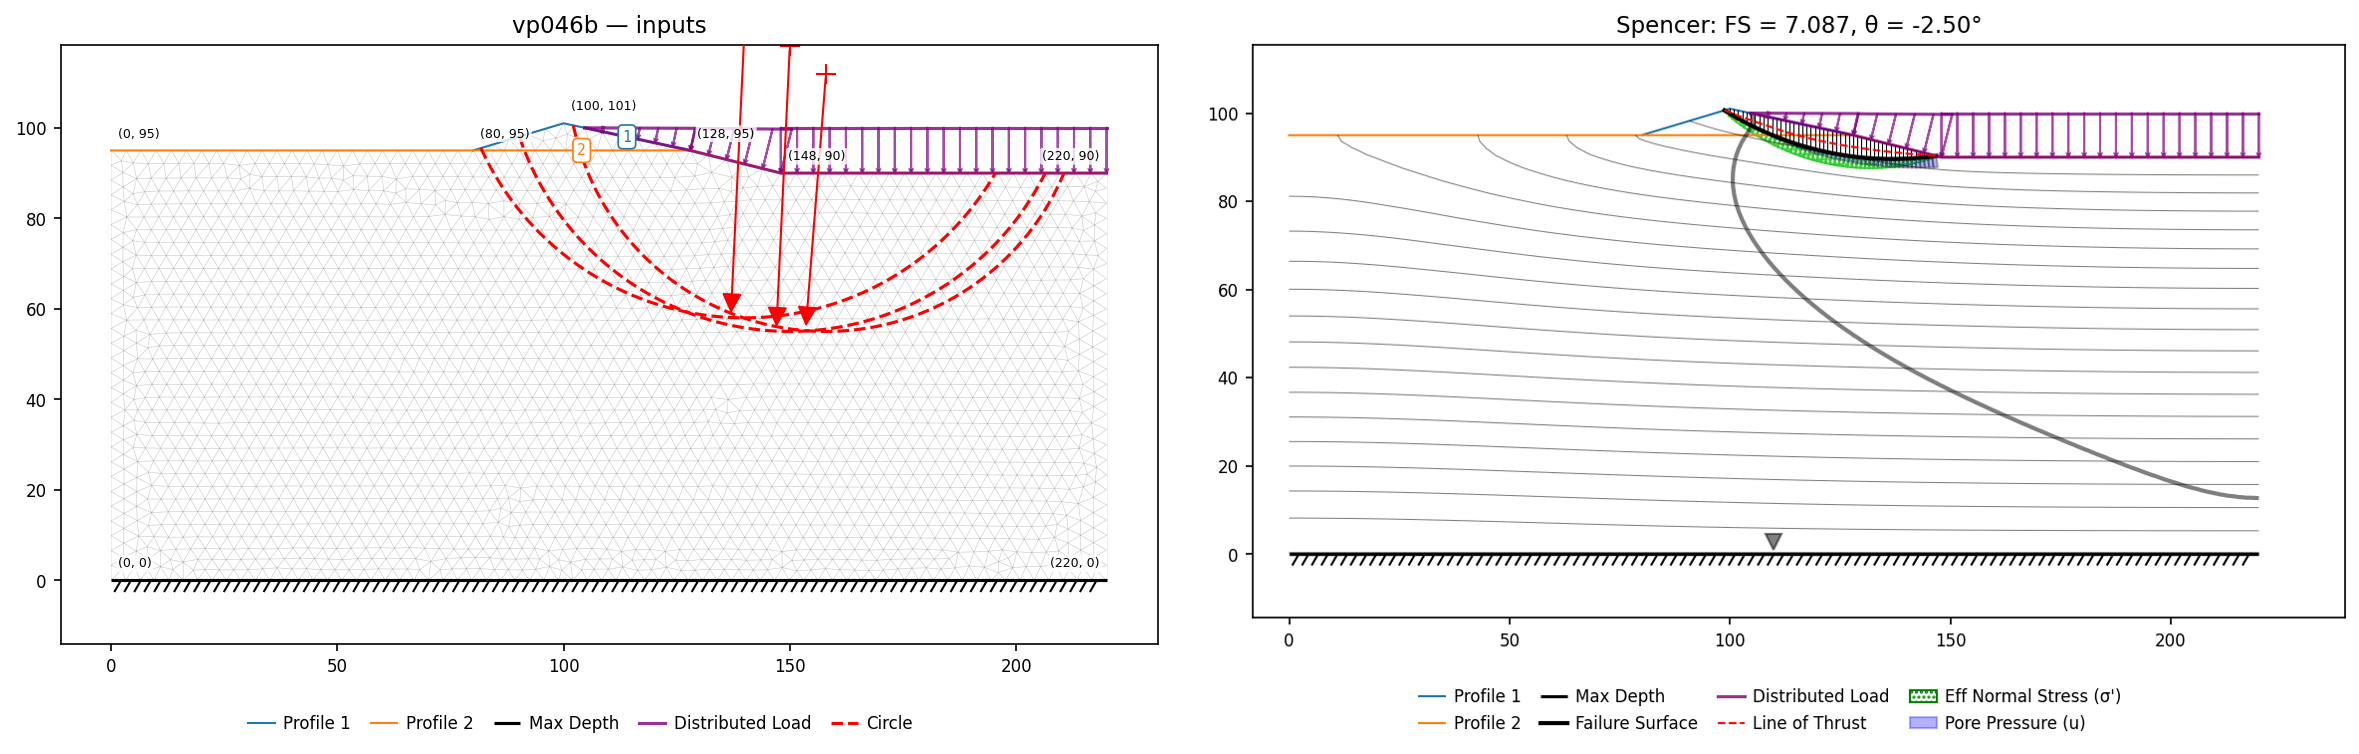
Stage 3 — rapid drawdown (gated: representation error swamps the target). The direct/undrained analysis needs the undrained-strength distribution S(x,y), which Baker generates point-by-point with his STRNGH routine (from the Fig. 11 stress paths and the FLAC steady-state effective stresses) and prints only as the Fig. 14 contour map (20–120 kPa). That field is genuinely two-dimensional: at the reservoir bottom the near-surface strength is ≈ 5–10 kPa, yet under the embankment surcharge, at the same elevation, it is ≈ 60 kPa — a ~6× horizontal variation the critical drawdown surface samples end to end. Reducing it to the per-material 1-D functions XSLOPE (or Slide's .fn6) can carry is under-determined: a single cu-vs-elevation cp fit digitized from Fig. 14 swings the factor of safety from 1.10 (anchored to the reservoir-bottom profile) to 3.11 (anchored under the embankment), and 2-zone stepped fits that honour the surcharge give 2.40–2.70 as the zone split moves ±5 m. The representation choice moves FS by far more than the ±10–15% a lock could tolerate, and reaching Slide's 2.181 / Baker's 2.18 would mean tuning the anchor to the target rather than reading it off the figure — so stage 3 is left gated, its data digitized transparently (scratch only) but not locked. Slide's own 2.181 is itself a manual extraction of the same figure via the install-only .fn6 functions (absent from every held archive; the RS2 .fez "Slide2 Import" set skips #046, and the RS2-native "#046 (cz=…)" is a different cohesion-with-depth problem under RS2's own numbering).
The paper corroborates every stage's published factor of safety — Baker Fs = 2.41 (empty reservoir, §6.4.1), 6.98 (steady state, §6.4.2 + Table I), 2.18 (rapid drawdown, §6.4.3.1 + Table I) — bracketing Slide's 2.534 / 7.003 / 2.181.
VP47: Soil-nailed wall in clay (Amherst test wall)
Slide #47 / Sheahan & Ho (2003): 6 m vertical cut in undrained Amherst clay (cᵤ = 25 kPa, γ = 18.9 kN/m³), two nail rows at 20° declination (L = 4.9 m, tensile 118 kN, plate 86 kN, bond 15 kN/m, sₕ = 1.5 m) and the shotcrete facing weight applied as a 14.6 kN/m vertical line load at the crest. The wall failed in the field test; the published analyses sweep planar surfaces through the toe. Nails are modeled axial/passive with the FHWA-style capacity envelope (plate strength at the head, bond-strength taper at the tip).
Input files: vp047.xlsx
| Method | XSLOPE | Published |
|---|---|---|
| Janbu, critical plane (44.5°) | 0.899 | Slide 0.890 (simplified = corrected); Sheahan trial wedge 0.887 |
Sheahan adds the nail tension unfactored; that convention (appl=active) gives 0.893. The tabulated 0.899 uses Slide's nail default (passive).
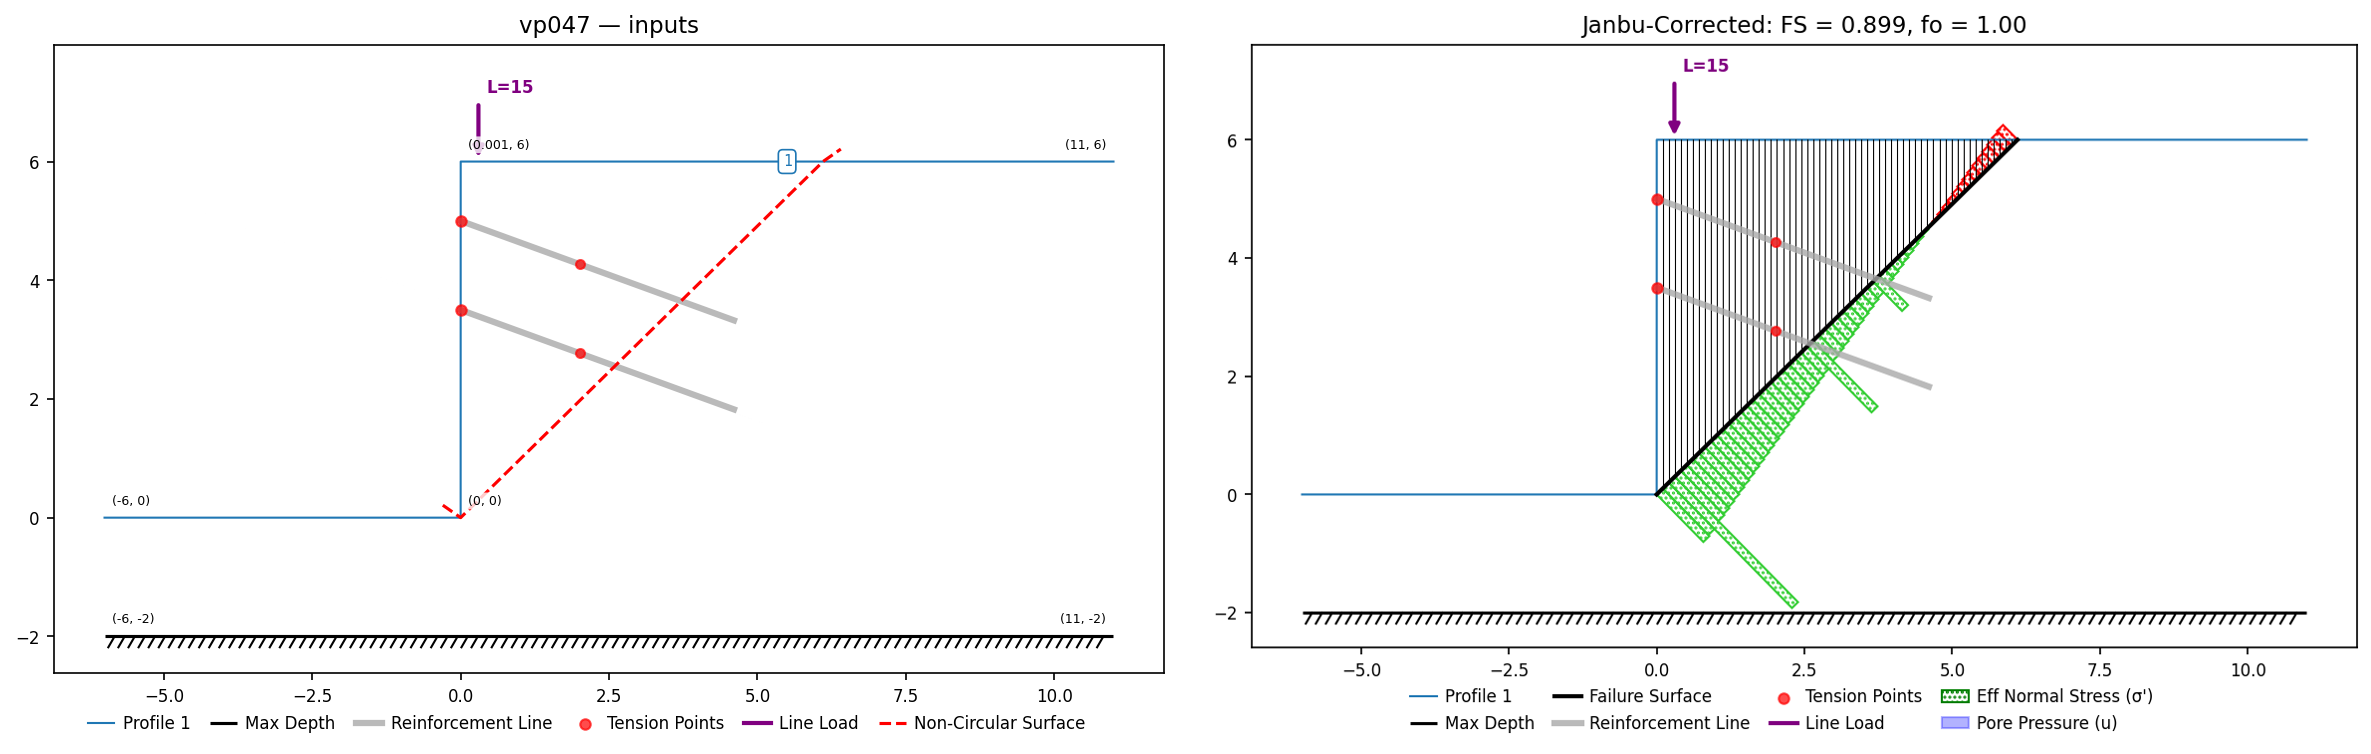
VP48: Soil-nailed wall in sand (Clouterre test wall no. 1)
Slide #48 / Sheahan & Ho (2003): the CEBTP Clouterre full-scale wall — 7 m cut in Fontainebleau sand (c′ = 3 kPa, φ′ = 38°, γ = 20 kN/m³), seven nail rows at 10° declination (lengths 6/8/7.5/8/8/8/6 m from the paper's Fig. 4a, sₕ = 1.15 m), shotcrete weight as a 13.2 kN/m line load. Following Sheahan, each nail carries a constant 15 kN tension (fully anchored ends in xslope). The benchmark evaluates planar surfaces through the toe at 45–70°:
Input files: vp048.xlsx
| Plane angle | XSLOPE Janbu | XSLOPE Spencer | Slide Janbu | Sheahan |
|---|---|---|---|---|
| 45° | 1.154 | 1.154 | 1.123 | 1.176 |
| 50° | 1.060 | 1.060 | 1.043 | 1.070 |
| 55° | 0.991 | 0.991 | 0.989 | 0.989 |
| 60° | 0.944 | 0.944 | 0.945 | 0.929 |
| 65° | 0.920 | 0.920 | 0.922 | 0.893 |
| 70° | — | 0.921 | 0.923 | 0.887 |
The stored surface (and test tag) is the 55° plane, where Slide and Sheahan agree exactly. Janbu's fixed-point iteration does not converge at 70° (Spencer shown). This problem exposed a family of right-facing axial-reinforcement sign errors (vertical force component, facing detection against a vertical wall face, and the Janbu correction-factor chord), all fixed and locked by a left/right mirror consistency test.
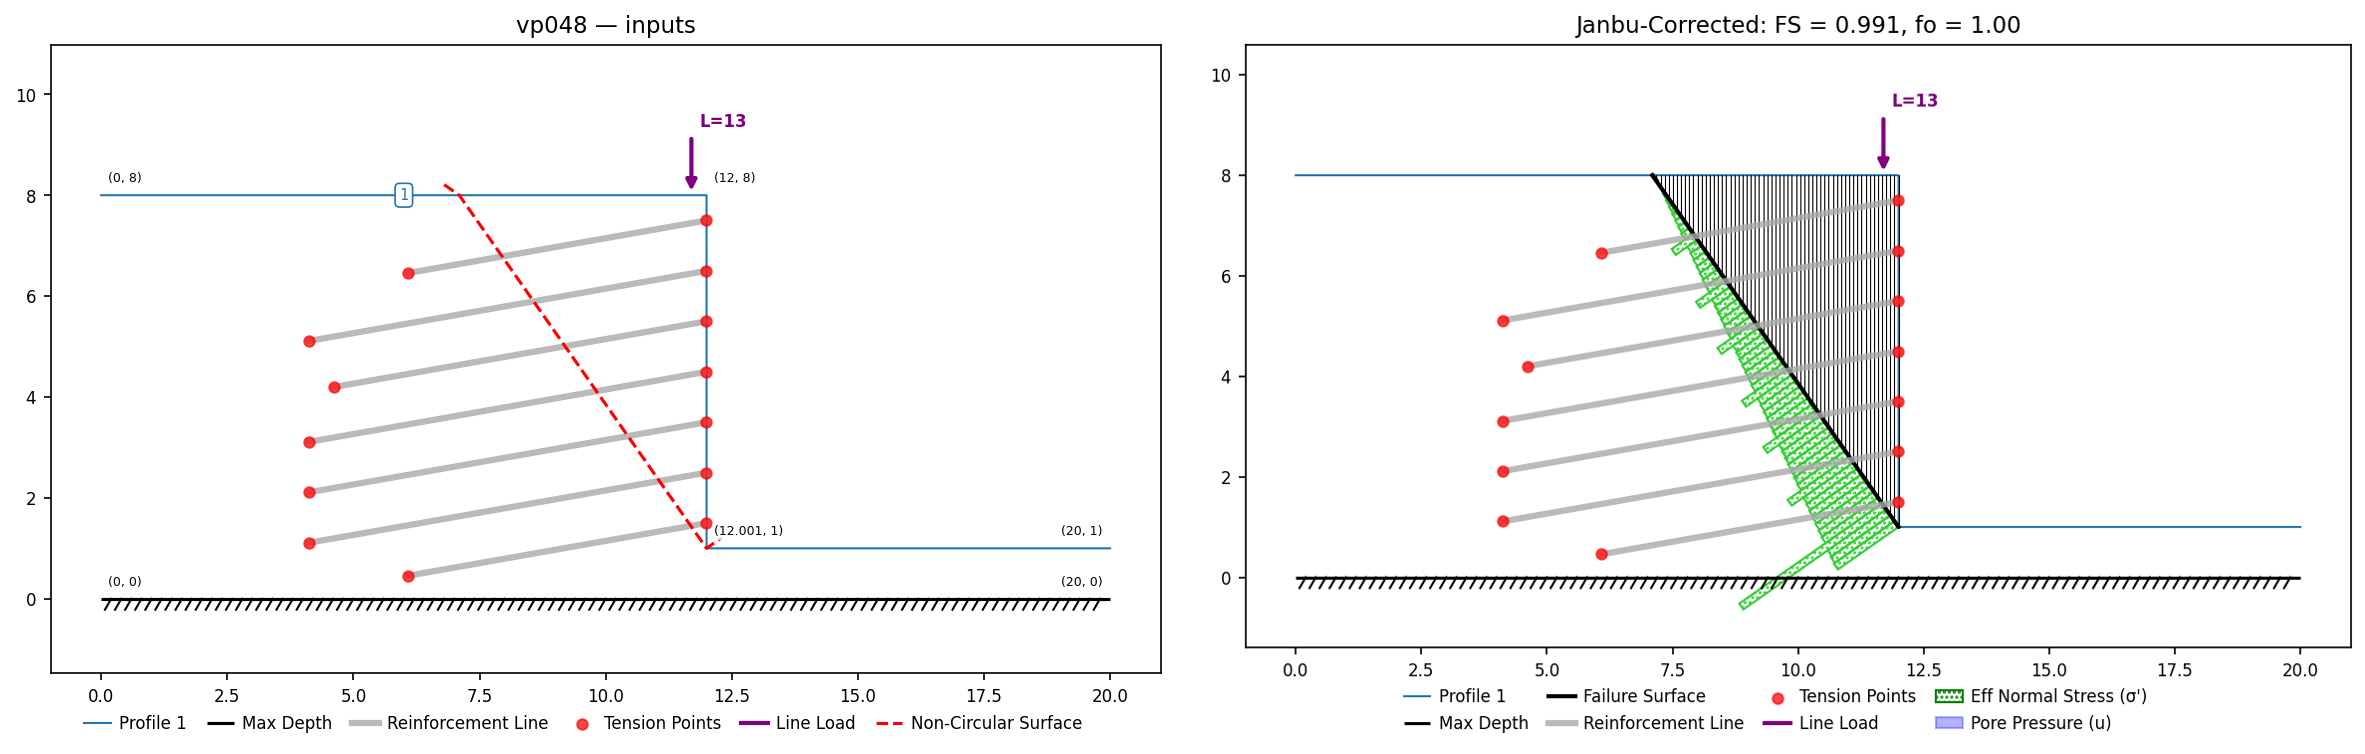
VP49: Retaining wall, grouted tiebacks, soldier piles
Input files: vp049.xlsx
From the Caltrans SNAILZ reference manual: a two-layer slope cut by a soldier-pile tieback wall, evaluated on the manual's given bilinear wedge from the wall toe (Slide prints its endpoints; the interior kink is digitized from the figure at (37.0, 33.6)). The two tieback rows carry different bar capacities (Table 49.2, tensile = plate, bond 13,571.68 lb/ft, 8-ft spacing); the soldier pile is modeled as Slide models it — a micro-pile at the wall face contributing 5,900 lb/ft of shear where the surface passes.
| XSLOPE | Slide | SNAILZ | |
|---|---|---|---|
| Janbu simplified | 1.434 | 1.446 | — |
| Janbu corrected | 1.469 | 1.479 | 1.52 |
Both tiebacks are tensile-governed at the given surface (bond capacity behind the crossing exceeds the bar capacity), so the digitized tieback lengths carry no factor-of-safety sensitivity. Spencer reads 1.439 on the same wedge (no published counterpart).
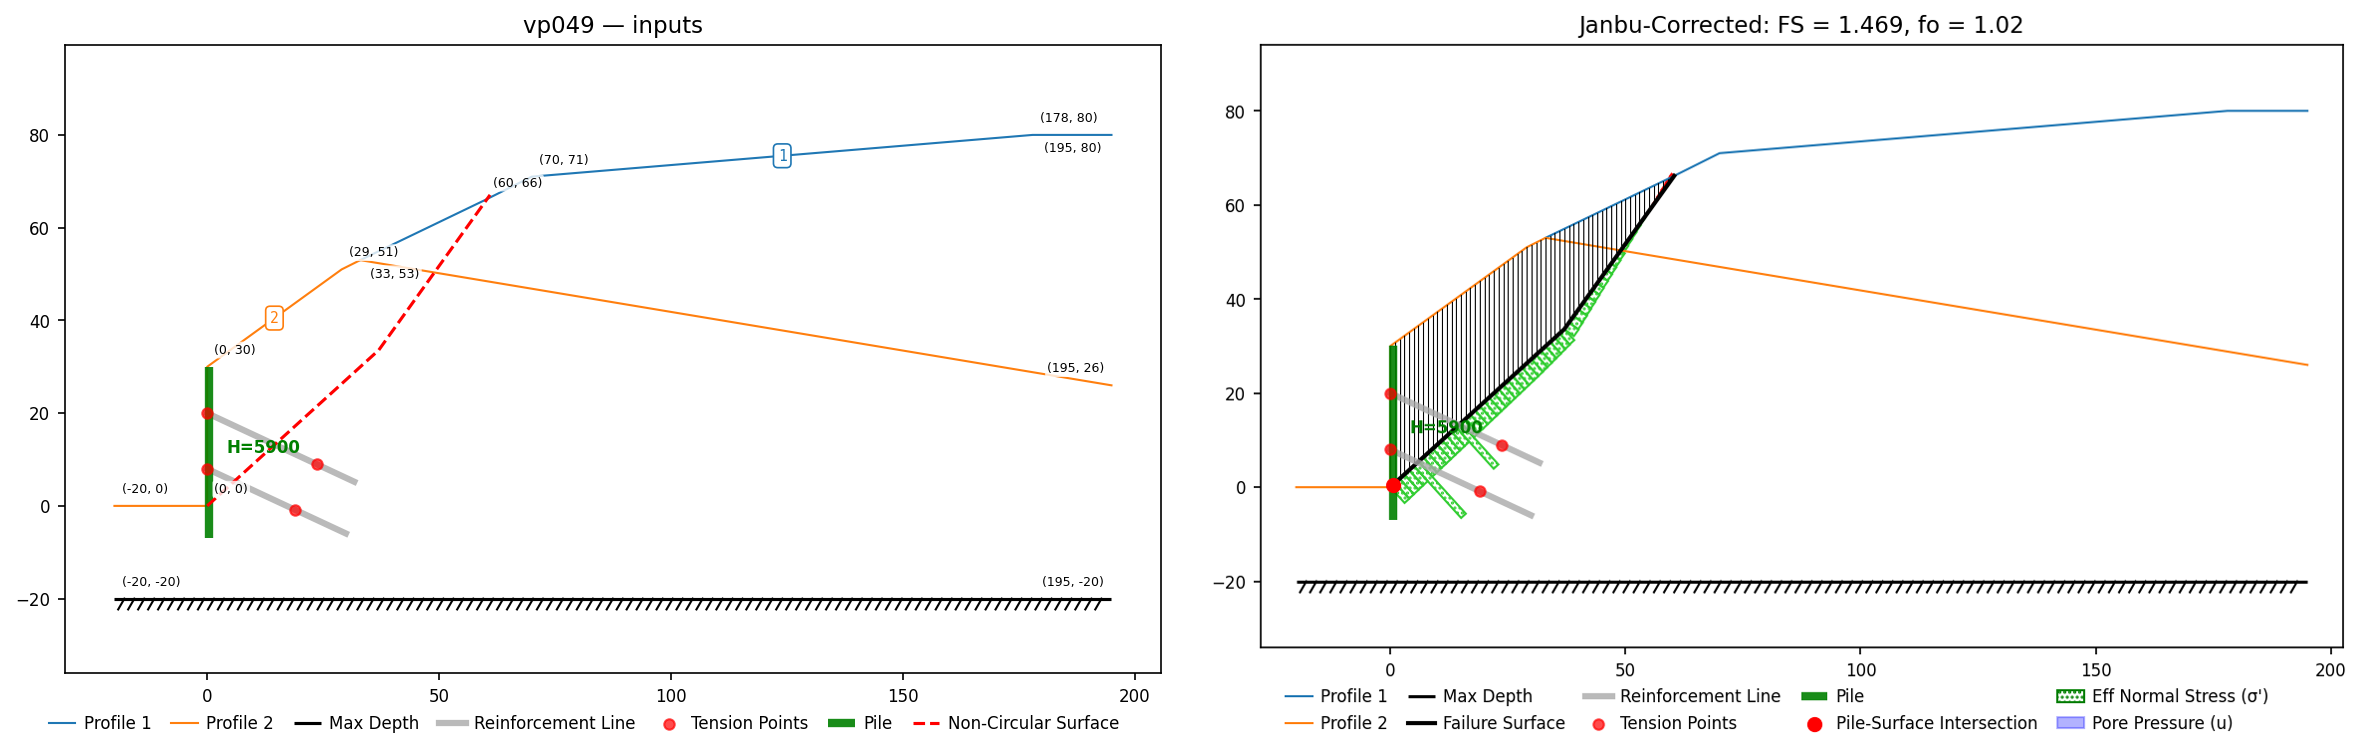
VP50: Reinforced slope, (2) materials, predefined slip surface, geosynthetic
Slide #50 (SNAILZ reference manual): nail-reinforced wall, 14 horizontal rows with per-row length/capacity/bond strength, evaluated on the printed deep wedge (-15.813,0)-(0,-5)-(41.722,25). Slide Janbu corrected 1.417; SNAILZ 1.46. Plate strength equals tensile strength, so the wall end is fully anchored (lp1=0); the embedded end tapers at the bond strength (lp2 = T/bond). Active application, imperial units.
Input files: vp050.xlsx
| Method | XSLOPE | Published |
|---|---|---|
| Janbu (corrected) | 1.448 | SNAILZ 1.46; Slide 1.417; SLOPE/W force 1.354 (×fo ≈ 1.44) |
| Spencer | 1.576 | SLOPE/W M-P 1.606 |
Tangent orientation with the force factored by FS (Slide’s nail defaults + SNAILZ convention); axial+active gives 1.675 — conventions dominate this comparison.
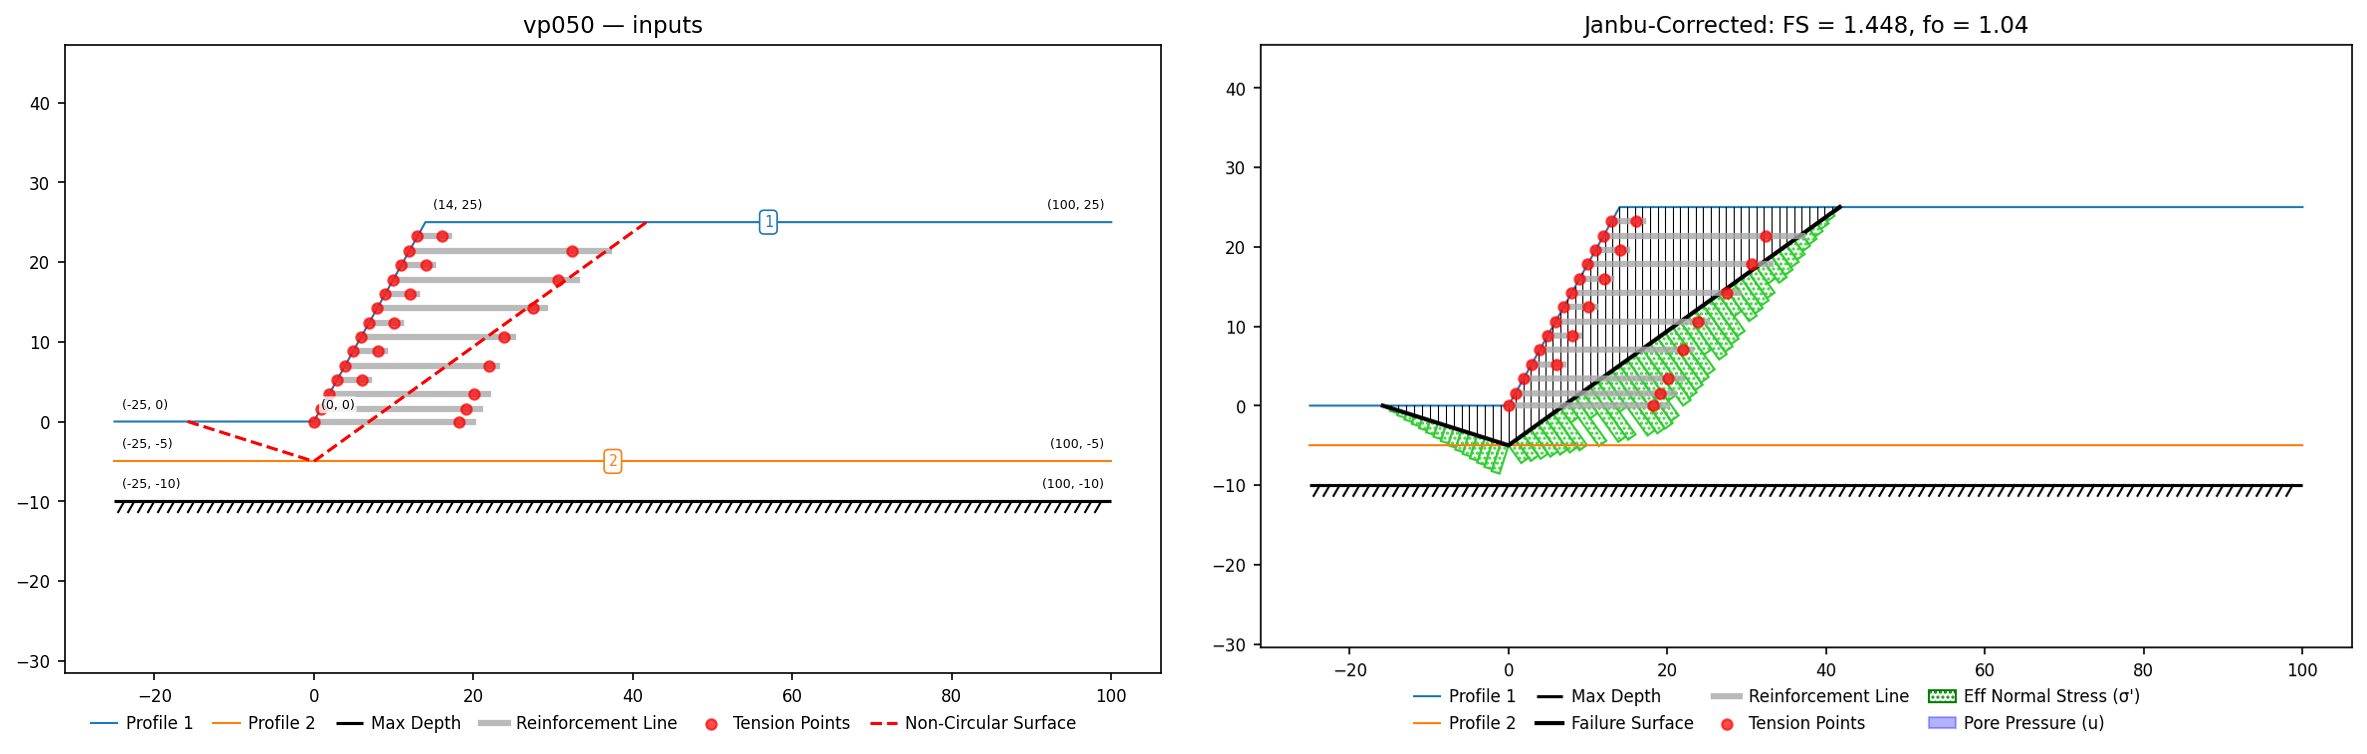
VP51: Slope, (4) materials, water table, tension crack, seismic
Slide #51 / GS 2.31: Zhu, Lee & Jiang (2003) four-layer slope, wet, k=0.1, 5 m dry tension crack, specified circle (18.058, 66.744, R=86) read from the printed info box (fig 51.2). Layer-4 properties from the GeoStudio manual (Table 85). The phreatic line is the one element read from the figure trace (anchored at (0,0)-(10,5) on the face, flat ~15.5 at the right); a +/-1 m sensitivity bracket moved Bishop by <0.01, and Bishop/Spencer/Janbu all match the two published programs' agreeing values. Slide/Zhu: OMS 1.145/1.066, Bishop 1.278/1.278, Janbu simp 1.112/1.112, Corps#2 1.422/1.377, Lowe 1.288/1.290, Spencer 1.293/1.293, GLE 1.304/1.303; SLOPE/W: 1.284/1.115/1.368/1.283/1.299/1.310.
Input files: vp051.xlsx
| Method | XSLOPE | Published |
|---|---|---|
| Ordinary | 1.069 | Slide 1.145; Zhu 1.066; SLOPE/W 1.284* |
| Bishop | 1.278 | Slide 1.278; Zhu 1.278; SLOPE/W 1.284 |
| Janbu (corrected) | 1.205 | Slide/Zhu simplified 1.112 (×fo ≈ 1.20) |
| Corps #2 | 1.404 | Slide 1.422; Zhu 1.377; SLOPE/W 1.368 |
| Lowe-Karafiath | 1.296 | Slide 1.288; Zhu 1.290; SLOPE/W 1.283 |
| Spencer | 1.294 | Slide 1.293; Zhu 1.293; SLOPE/W 1.299 |
| Morgenstern-Price | 1.304 | Slide 1.304; Zhu 1.303; SLOPE/W 1.310 |
Phreatic line calibrated against the two independently agreeing Bishop/Spencer anchors (±1 m bracket).
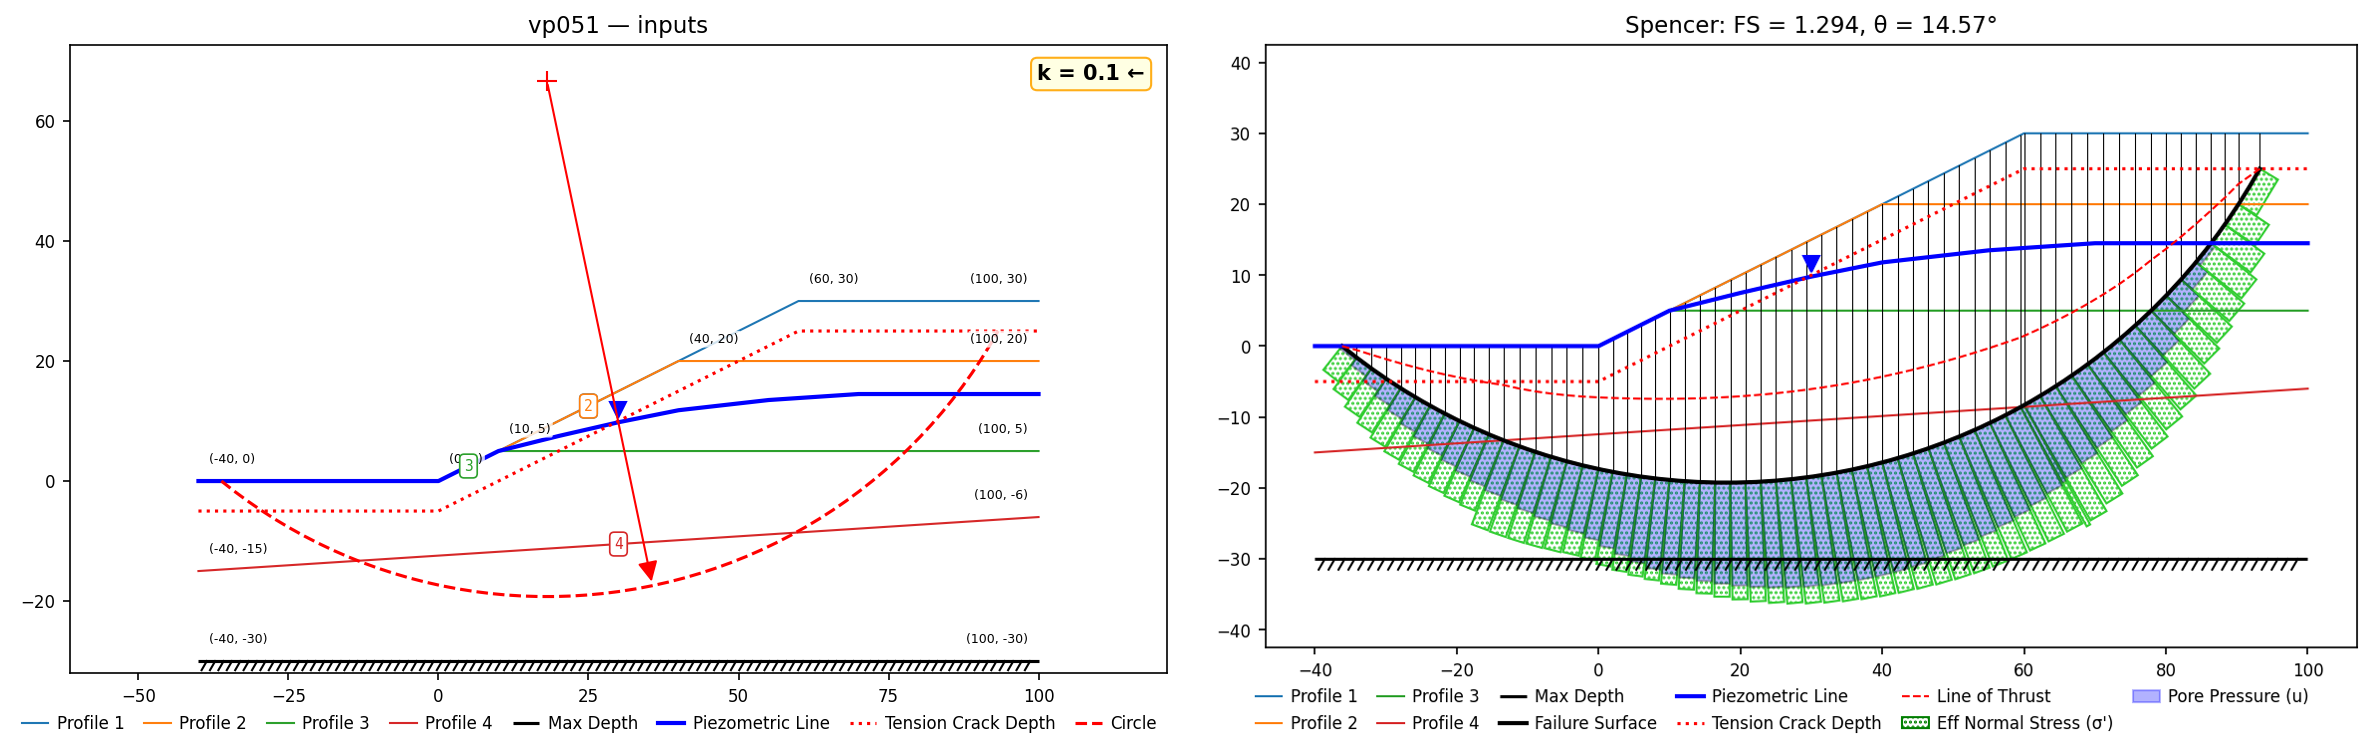
VP52: Slope, (4) materials, water table, tension crack
Slide #52, dry. Unconstrained circular search lands in the deep (surface 3) family: Slide grid search Spencer 1.804 / Zhu 1.836 on his specified deep circle (the manual's own Bishop shows a 1.804-vs-1.429 Slide-Zhu spread here, so the family band is wide).
Slide #52, wet (Table 52.2 water table). Deep family: Slide Spencer 1.189 / Zhu 1.211.
Input files: vp052a.xlsx, vp052b.xlsx
Dry — governing deep (surface 3) family
| Method | XSLOPE | Published |
|---|---|---|
| Bishop | 1.796 | Slide 1.804; Zhu 1.429 |
| Spencer | 1.797 | Slide 1.804; Zhu 1.836 |
Wet — governing deep (surface 3) family
| Method | XSLOPE | Published |
|---|---|---|
| Bishop | 1.176 | Slide 1.176; Zhu 1.079 |
| Spencer | 1.189 | Slide 1.189; Zhu 1.211 |
Wet Spencer and Bishop match Slide exactly; the manual itself shows a wide Slide–Zhu spread on this family.
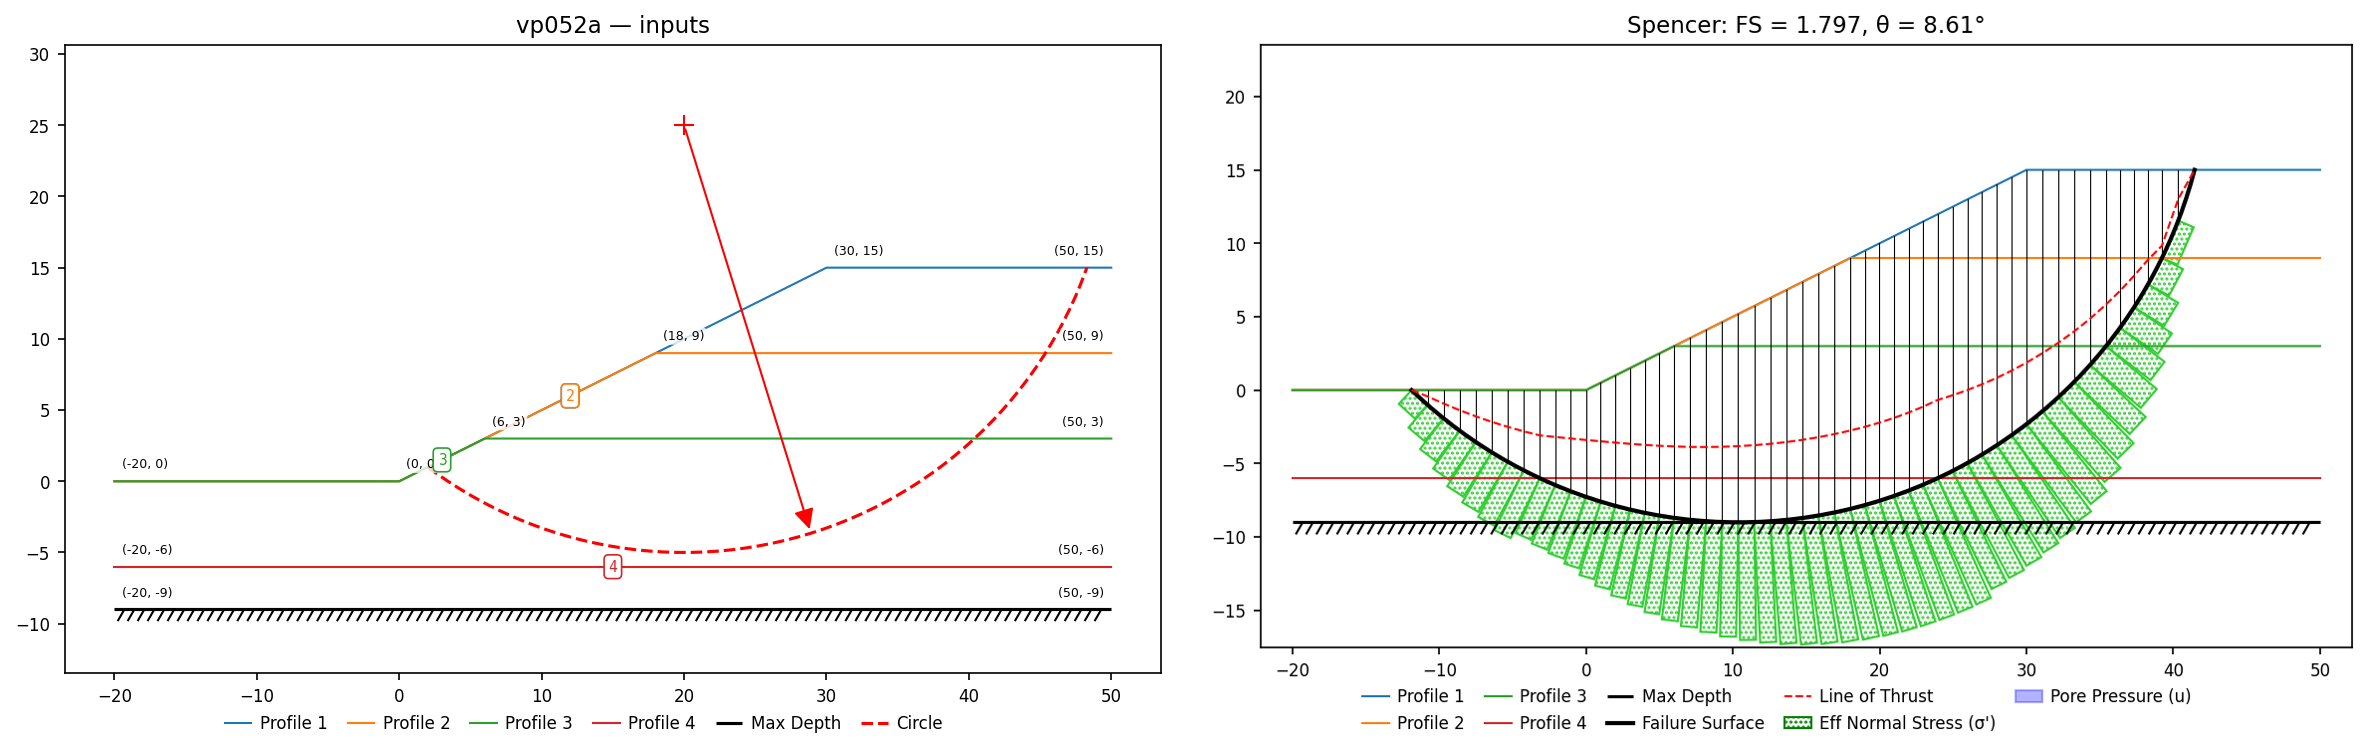
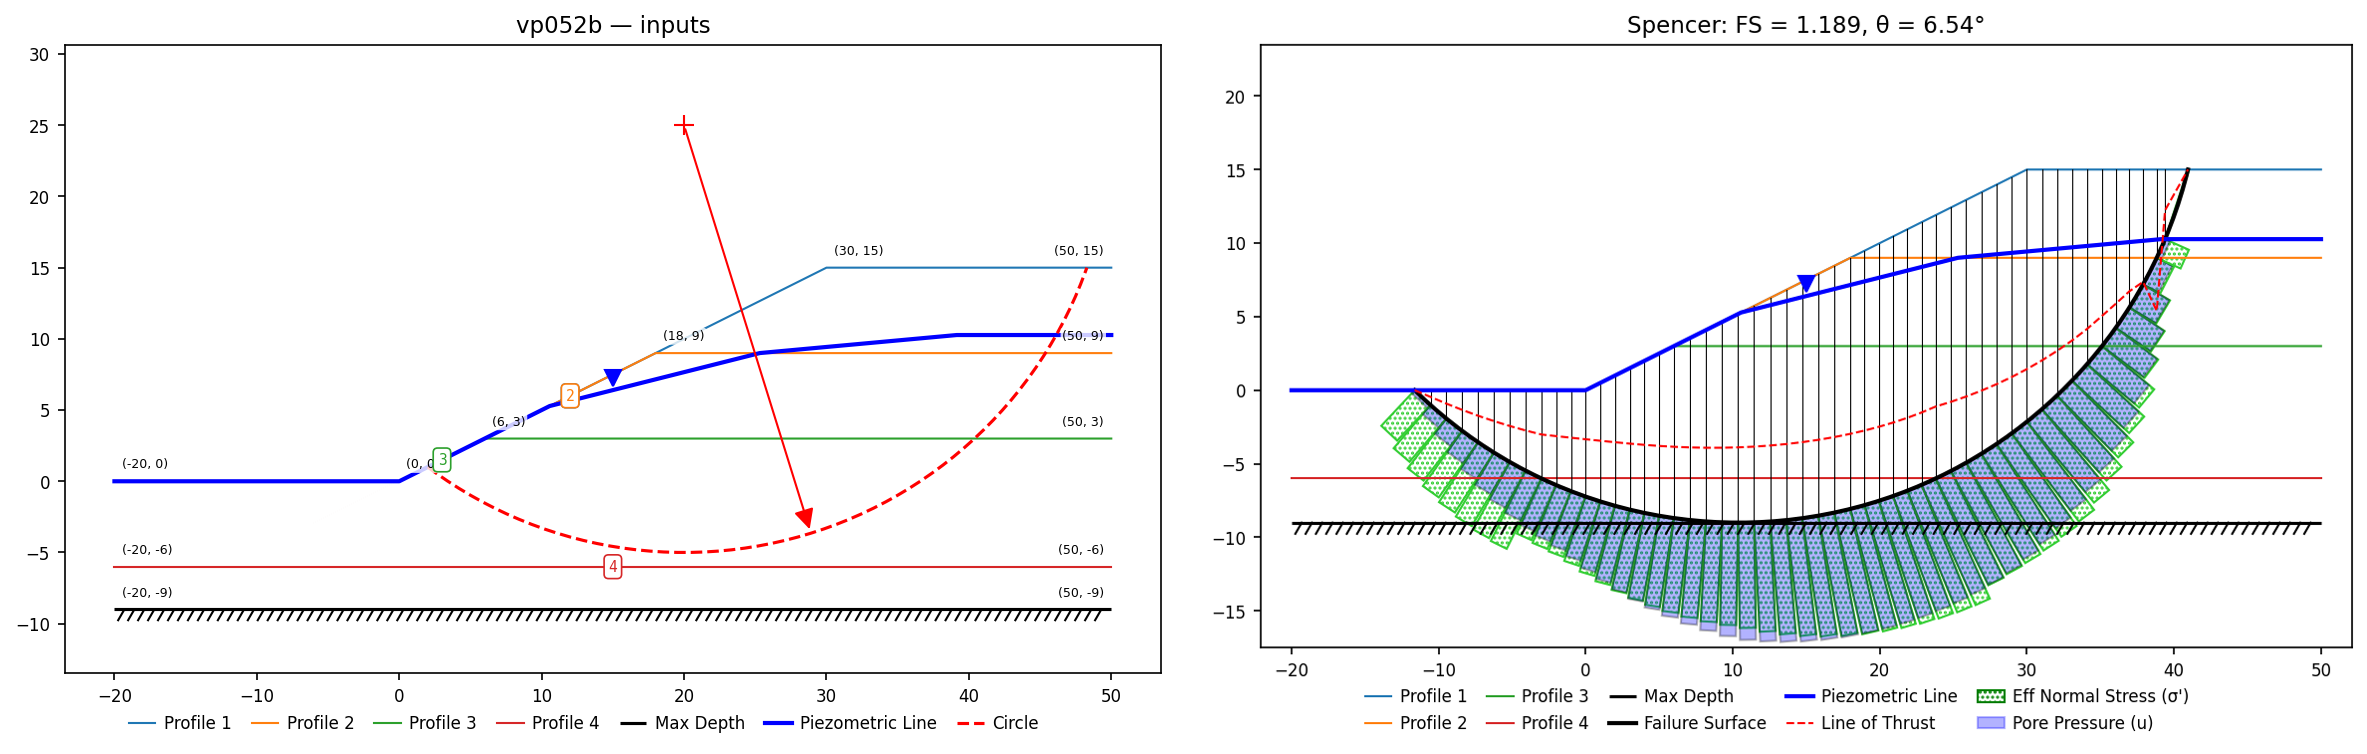
VP53: Priest (1993) rigid block on a plane
Slide #53: Priest's (1993) example rigid-block problem, cross-checked by Rocscience against both Slide and RocPlane. A homogeneous slope (c' = 20 kN/m², φ' = 30°, γ = 25 kN/m³) fails on a specified 30° plane from the toe (0,0). A 15-m tension crack at the crest cuts the surface at (25.981, 15) and holds 3.75 m of water (25% filled — XSLOPE's tcrack_water, giving the ½γwd² crack thrust). The water table runs horizontal at el. 18.75 from the right until above the crack/plane intersection, then linearly to the toe — which reproduces Priest's triangular uplift distribution on the plane through the ordinary piezometric-line machinery.
Input files: vp053.xlsx
| Method | XSLOPE | Published |
|---|---|---|
| Janbu (uncorrected = corrected) | 1.048 | Slide 1.049; RocPlane 1.049; Priest 1.049 |
| Spencer / M-P / Corps / Lowe | 1.048 | — |
On a single plane the sliding block is statically determinate: every method returns the same 1.048, and Janbu's correction factor is exactly 1 (d/L = 0). The 0.001 gap to the three published sources is rounding.
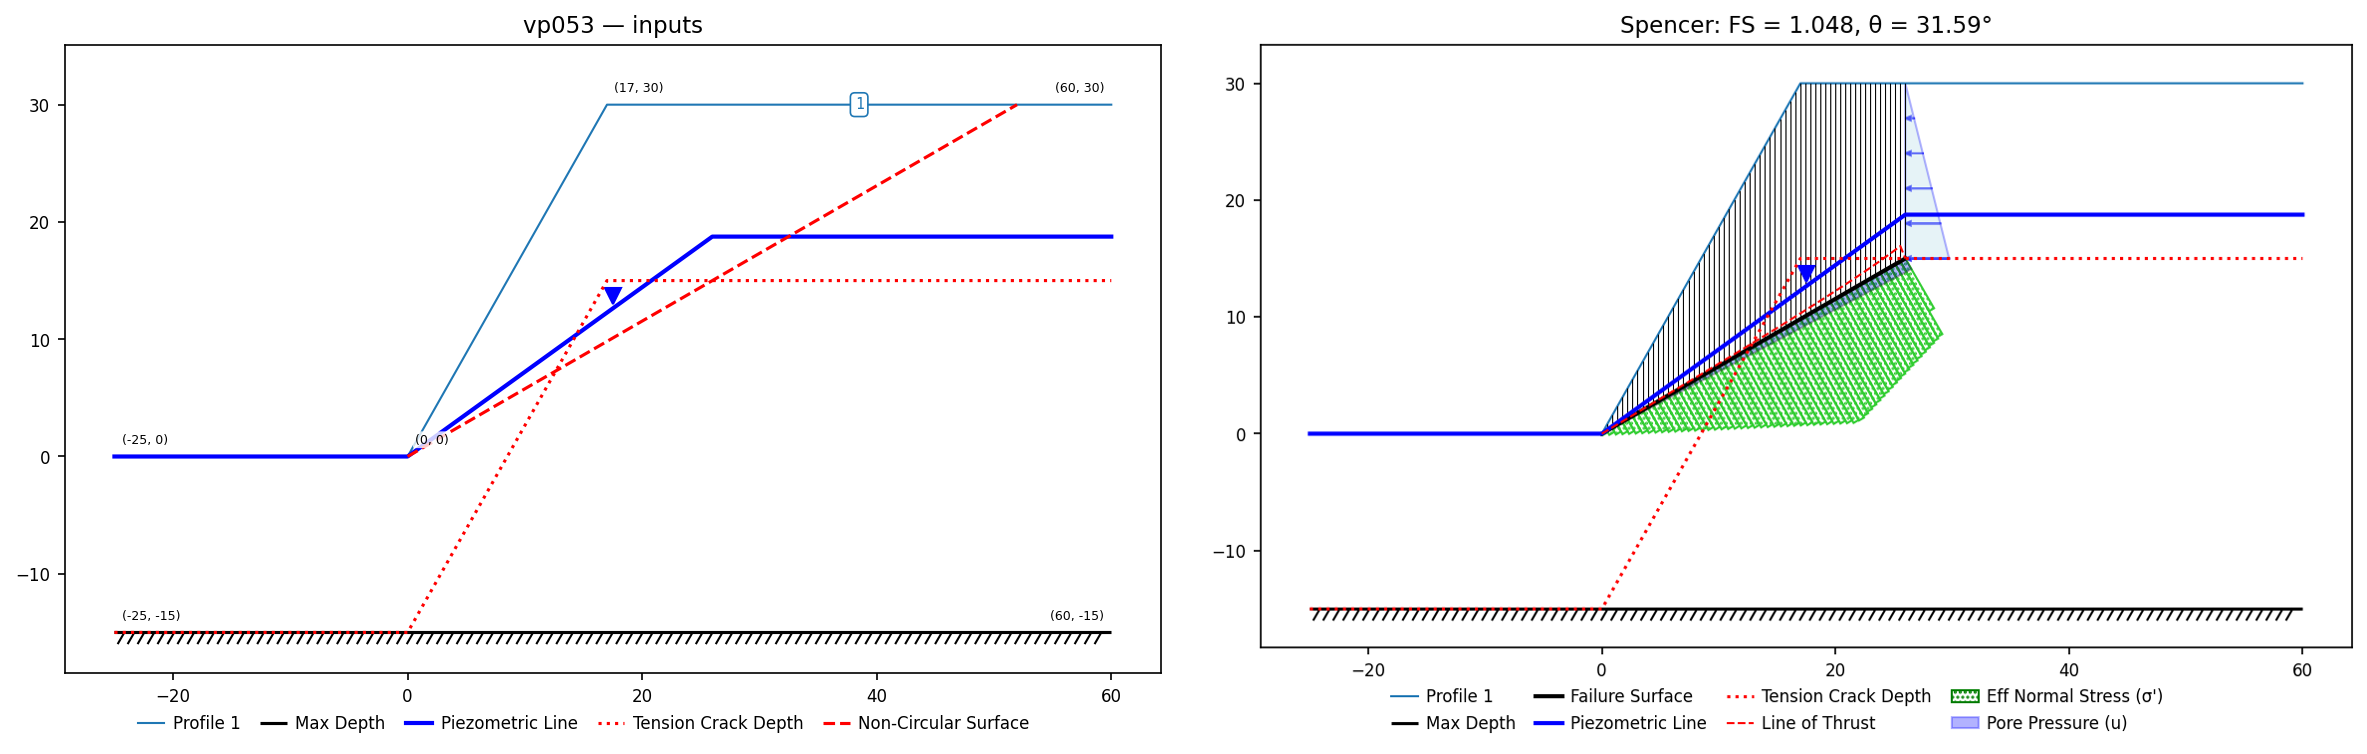
VP54: Slope, homogenous, micro piles
Slide #54, unreinforced case on the printed critical circle (2.674, 7.573, R=8.031). Slide Bishop 1.102; Yamagami 1.10.
Slide #54 with the micro-pile row. Slide 1.193; Yamagami 1.20.
Input files: vp054a.xlsx, vp054b.xlsx
No pile
| Method | XSLOPE | Published |
|---|---|---|
| Bishop | 1.100 | Slide 1.102; Yamagami 1.10; SLOPE/W 1.102 |
With micro-pile row
| Method | XSLOPE | Published |
|---|---|---|
| Bishop | 1.185 | Slide 1.193; Yamagami 1.20; SLOPE/W 1.223 |
Slide adds the pile shear un-factored (= our active application); a free search finds 1.113 on a circle exiting upslope of the pile, so the tags pin the printed circle.
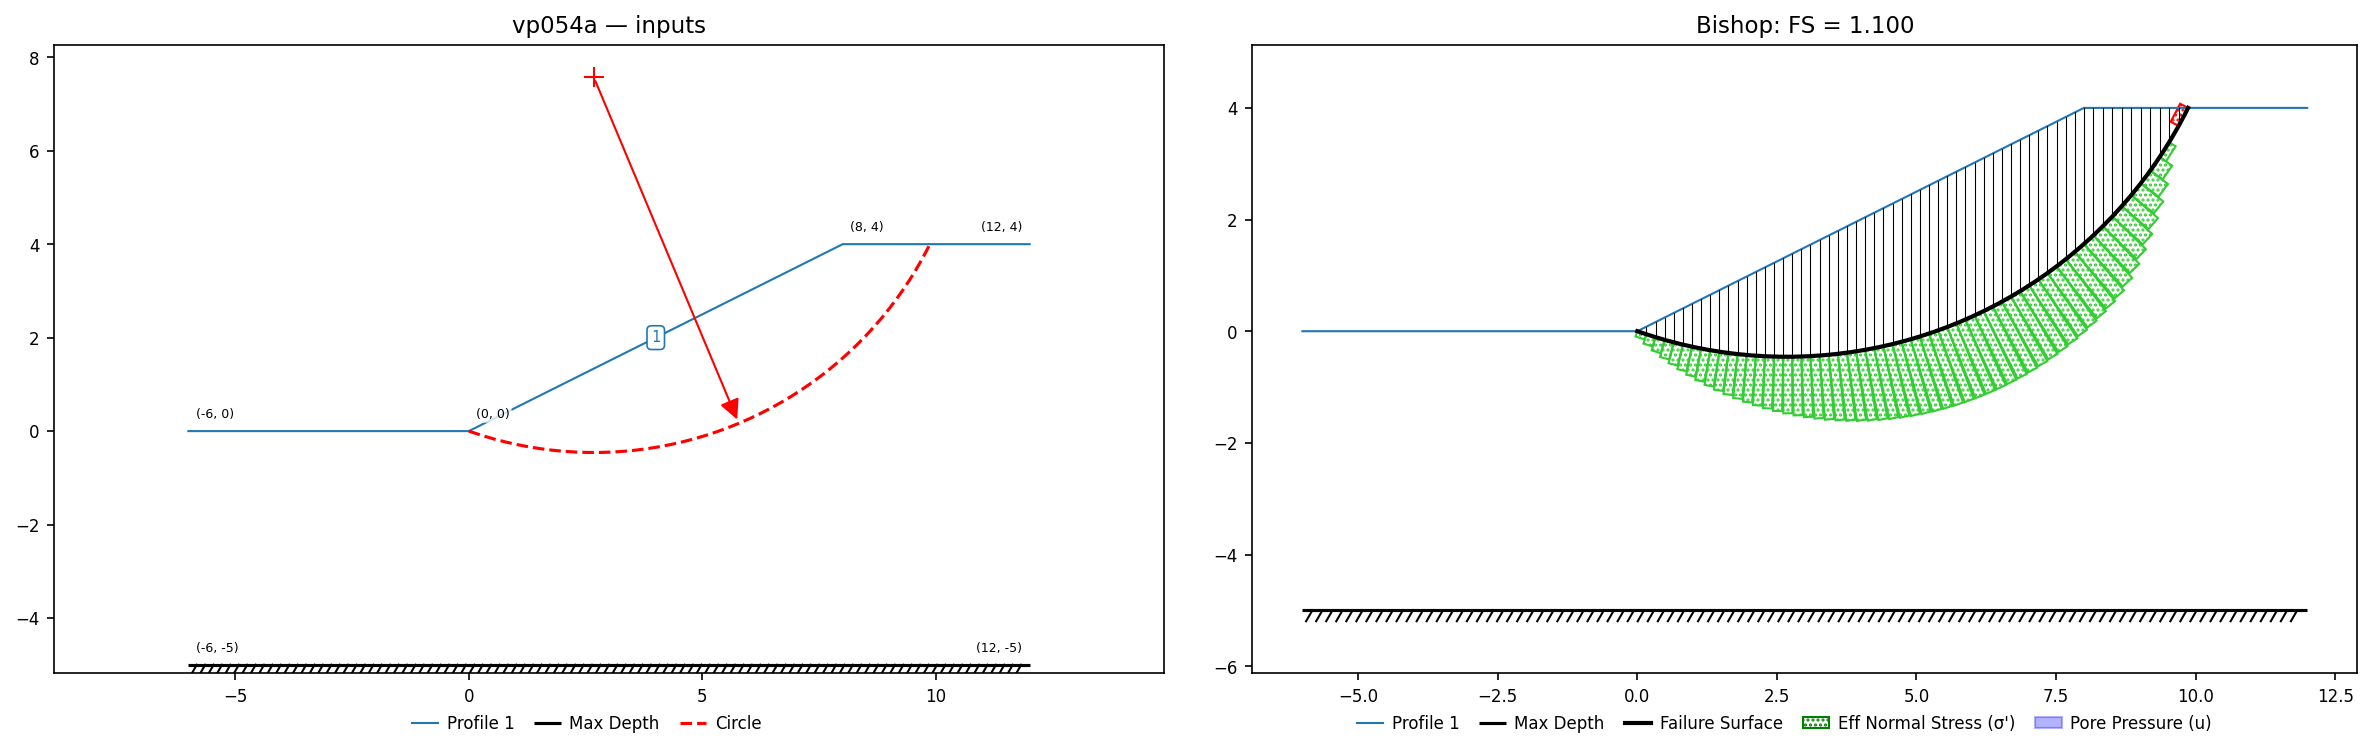
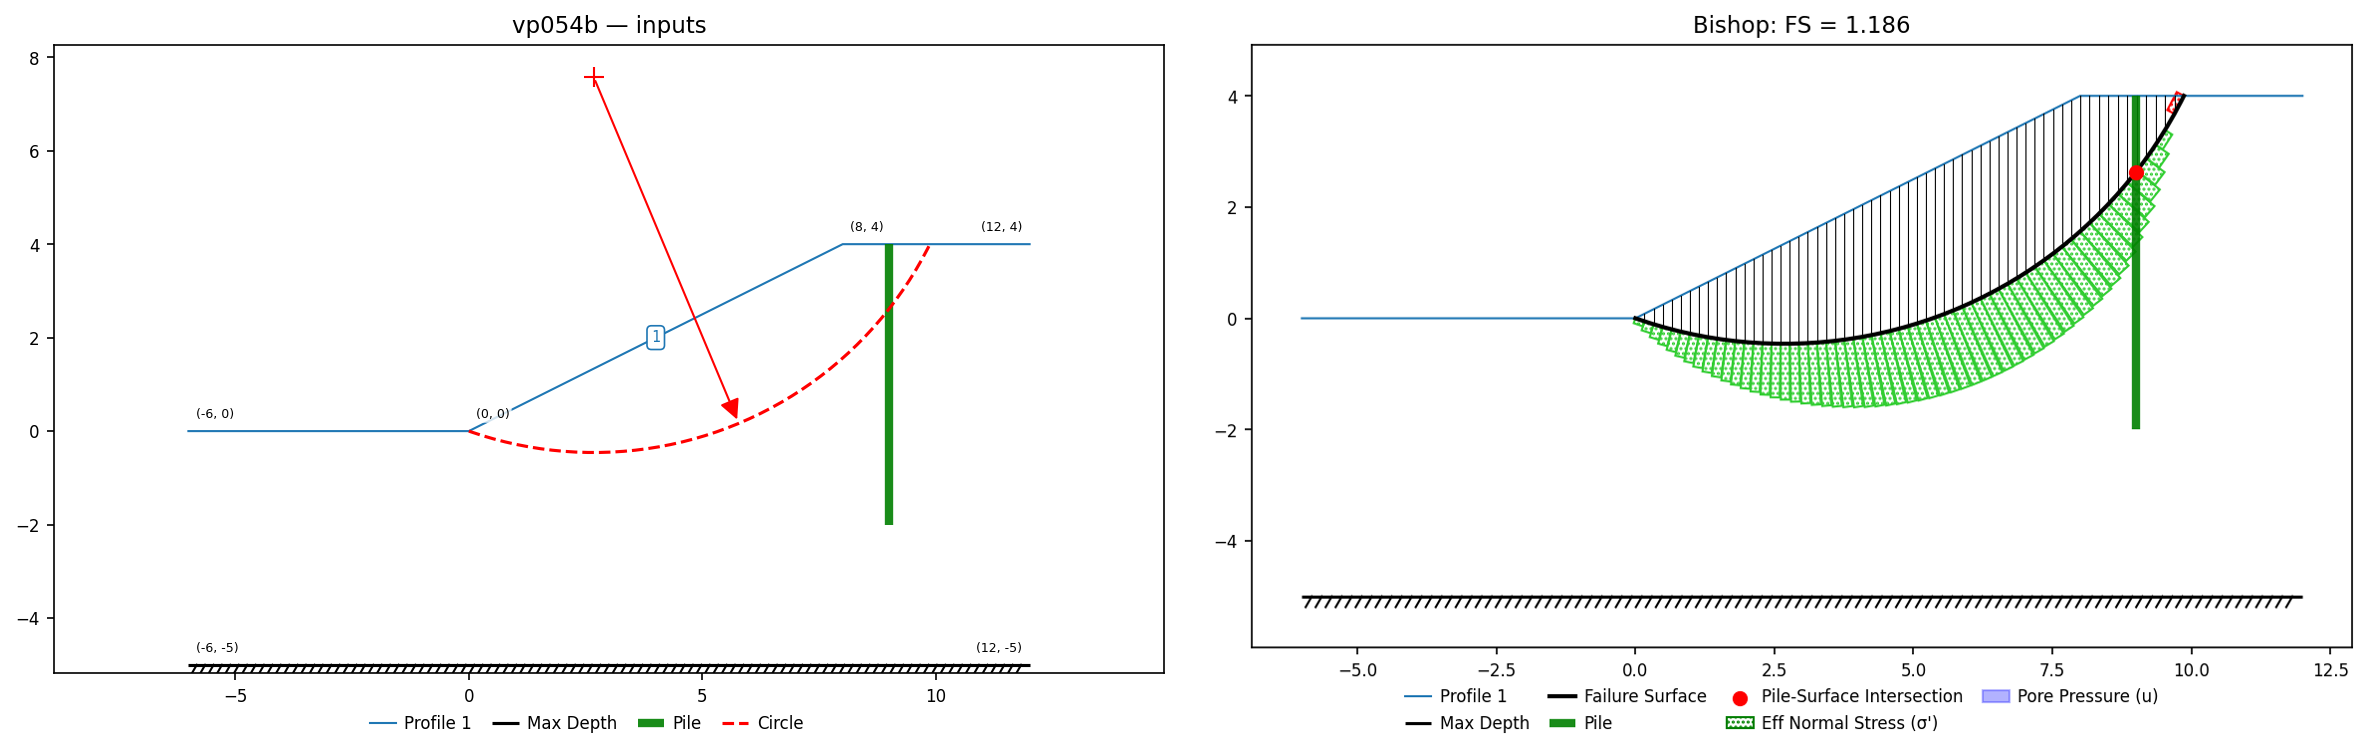
VP55: Pockoski & Duncan test slope 1
Slide #55: Pockoski & Duncan (2000) test slope 1 — a homogeneous sandy clay slope (c' = 300 psf, φ' = 30°, γ = 120 pcf), 2:1 face, 50 ft high, with the water table at ground on the lower plateau rising to 10 ft below the crest. P&D used this trio of slopes to compare eight programs; Slide ran an 80×80 grid at tolerance 10⁻⁴. XSLOPE's seed is Slide's printed critical circle (center (24.103, 195.256), R = 100.266), whose endpoints XSLOPE reproduces to 0.01 ft.
Input files: vp055.xlsx
| Method | XSLOPE | Published |
|---|---|---|
| Bishop | 1.290 (search 1.289) | Slide 1.293; UTEXAS4/SLOPE/W/XSTABL/RSS 1.29 |
| Spencer | 1.297 (search 1.295) | Slide 1.300; UTEXAS4/SLOPE/W 1.30 |
| Lowe–Karafiath | 1.321 | Slide 1.318; UTEXAS4 1.32 |
| Janbu (uncorrected) | 1.178 | Slide 1.151; published spread 1.15–1.24 |
The water table between its two pinned ends (at ground on the plateau, 10 ft below the crest) is a figure trace; the 0.003 three-method agreement on Slide's own circle validates it.
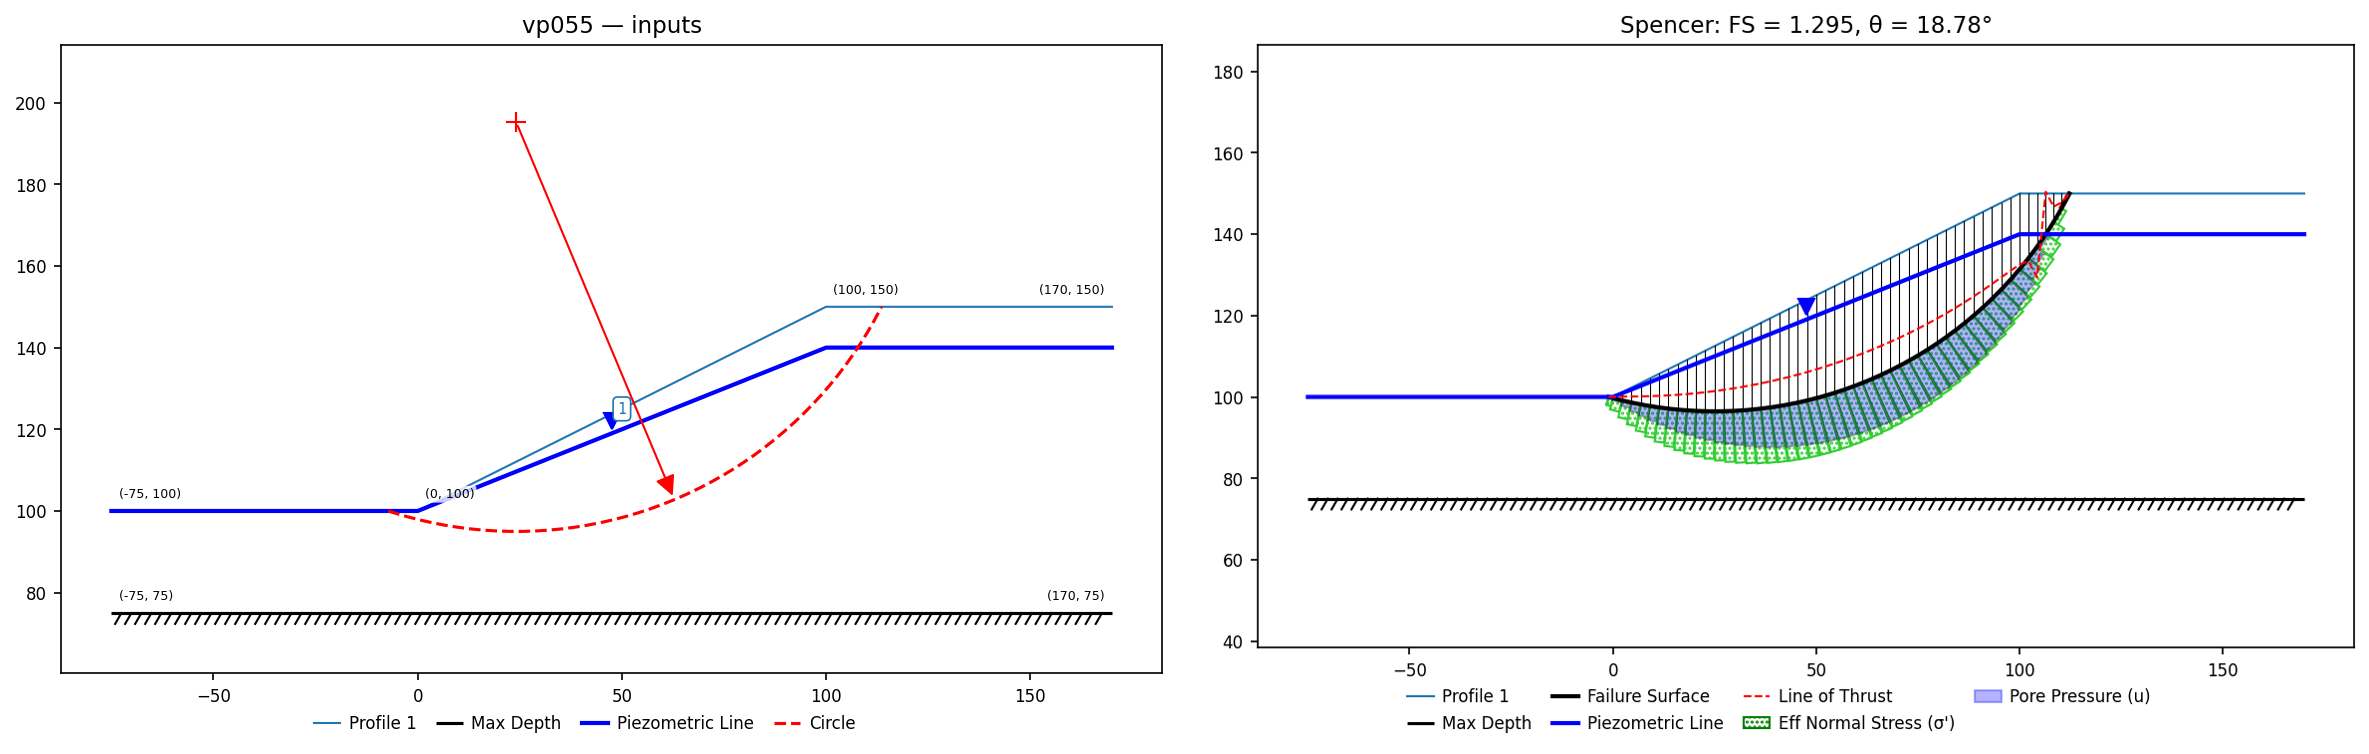
VP56: Pockoski & Duncan test slope 2
Slide #56: P&D test slope 2 — the slope of #55 with a dry 5.5-ft tension crack. The crack depth comes straight from Slide's info box: the critical surface's right endpoint sits at el. 144.5 while its slope intercept is 150.0. Seed = Slide's printed critical (center (24.662, 197.656), R = 100.790).
Input files: vp056.xlsx
| Method | XSLOPE | Published |
|---|---|---|
| Bishop | 1.283 (search 1.282) | Slide 1.285; UTEXAS4/SLOPE/W 1.28 |
| Spencer | 1.288 (search 1.288) | Slide 1.290; UTEXAS4/SLOPE/W 1.29 |
| Lowe–Karafiath | 1.307 | Slide 1.304; UTEXAS4 1.31 |
| Janbu (uncorrected) | 1.175 | Slide 1.141; published spread 1.13–1.23 |
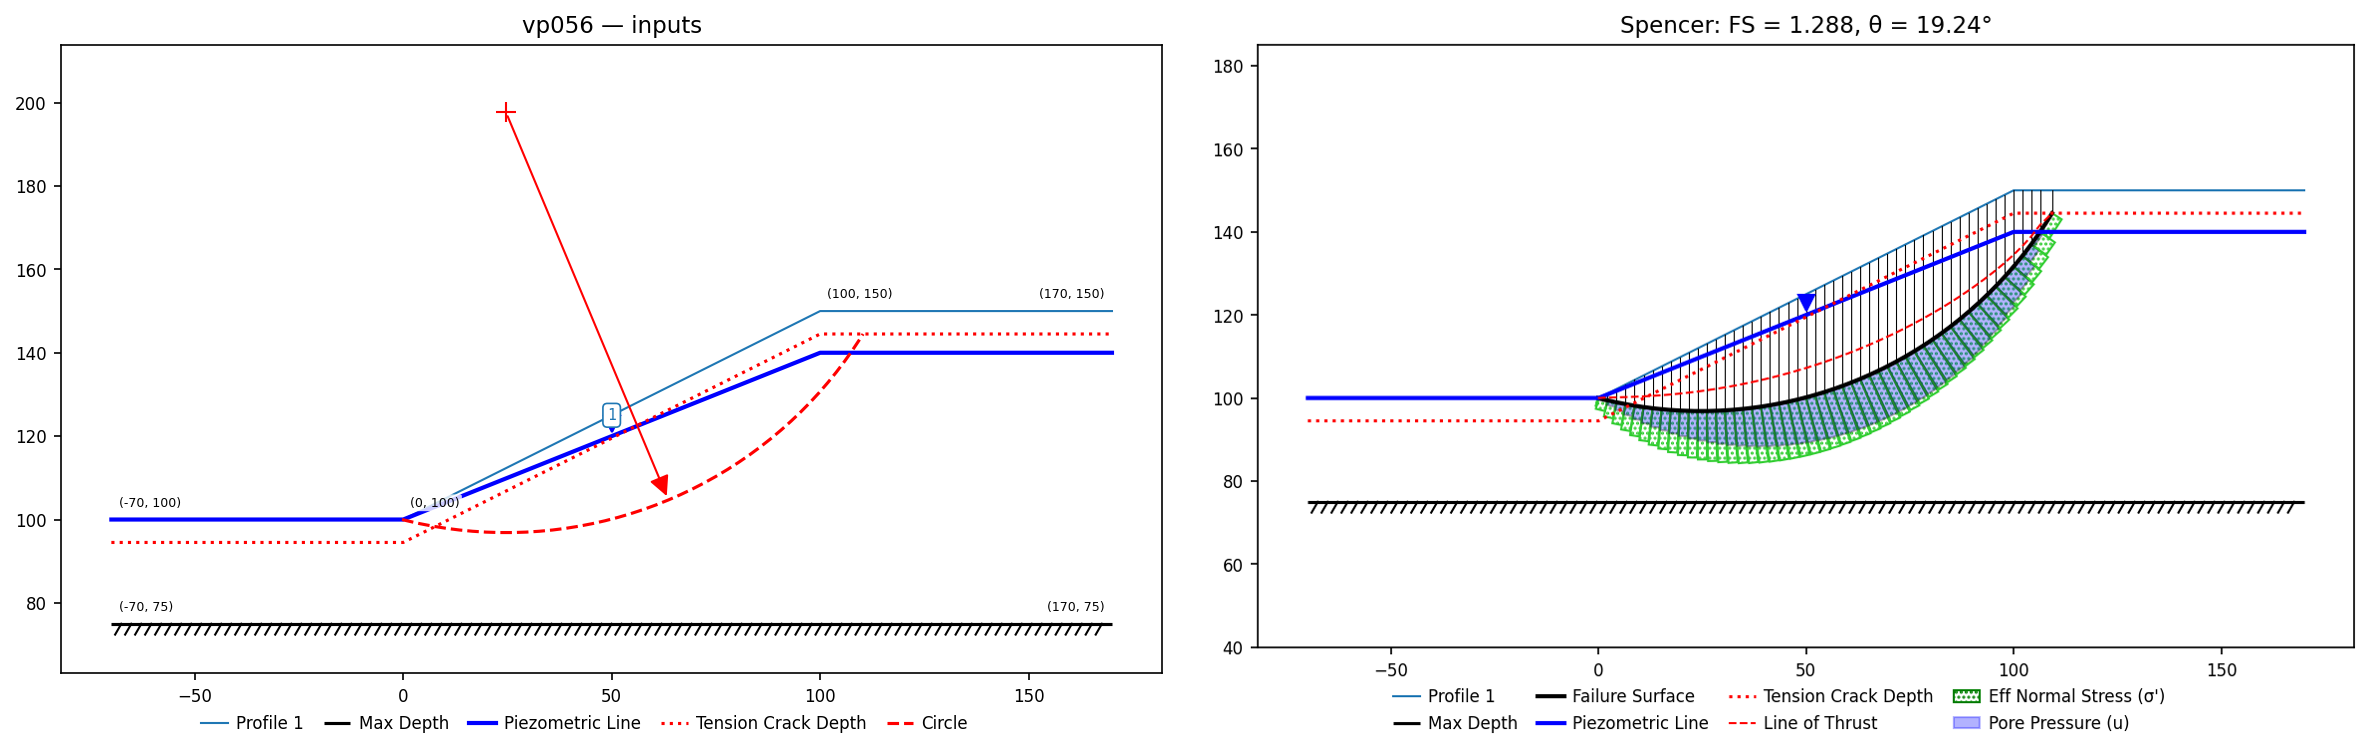
VP57: Pockoski & Duncan test slope 3 — composite vs. circles-only
Slide #57: Pockoski & Duncan (2000) test slope 3 — sandy clay (c' = 300 psf, φ' = 35°, γ = 130 pcf) over a 5-ft highly plastic clay seam (c' = 0, φ' = 25°) resting on the model base at el. 85; water table at ground on the lower plateau rising to 10 ft below the crest; dry 6-ft tension crack. The manual runs the problem twice — with and without composite surfaces — precisely to compare programs that have the option against those that don't, which makes it the ideal A/B test of XSLOPE's composite option against the clamped default.
Slide's printed composite critical (center (37.547, 191.192), R = 108.668) bottoms at el. 82.5, below the base, so the surface truncates and rides the weak seam; XSLOPE reproduces its endpoints (−21.55, 100)–(135.43, 144) to 0.01 ft. Slide's circles-only critical (center (36.451, 201.910), R = 116.891) bottoms at el. 85.02 — tangent to the base, exactly what a clamped search must settle for.
Input files: vp057.xlsx
| Method | XSLOPE composite | Slide composite | XSLOPE circles-only | Slide circles-only |
|---|---|---|---|---|
| Bishop | 1.389 | 1.392 | 1.415 (search 1.411) | 1.417 |
| Spencer | 1.396 | 1.400 | 1.419 (search 1.416) | 1.422 |
| Lowe–Karafiath | 1.387 | 1.385 | 1.422 | 1.414 |
| Janbu (uncorrected) | 1.240 | 1.222 (XSTABL 1.34) | 1.284 | 1.263 |
| Ordinary | 1.086 | 1.257 (SLOPE/W 0.85) | 1.162 | 1.319 |
Bishop, Spencer and Lowe agree with Slide to 0.008 in both modes, and circular_search(composite=True) finds the truncated critical unaided (1.388 / 1.396). The Ordinary method is the outlier by design, not by error: the manual's own table shows the published OMS values spanning 0.85 (SLOPE/W) to 1.257 (Slide) on the composite surface — the same pore-pressure pathology documented on VP22 — and XSLOPE's 1.086 sits inside that spread. Janbu simplified spans 1.21–1.34 across the published codes; XSLOPE's uncorrected 1.240 is in range and its corrected value (1.336) matches XSTABL.
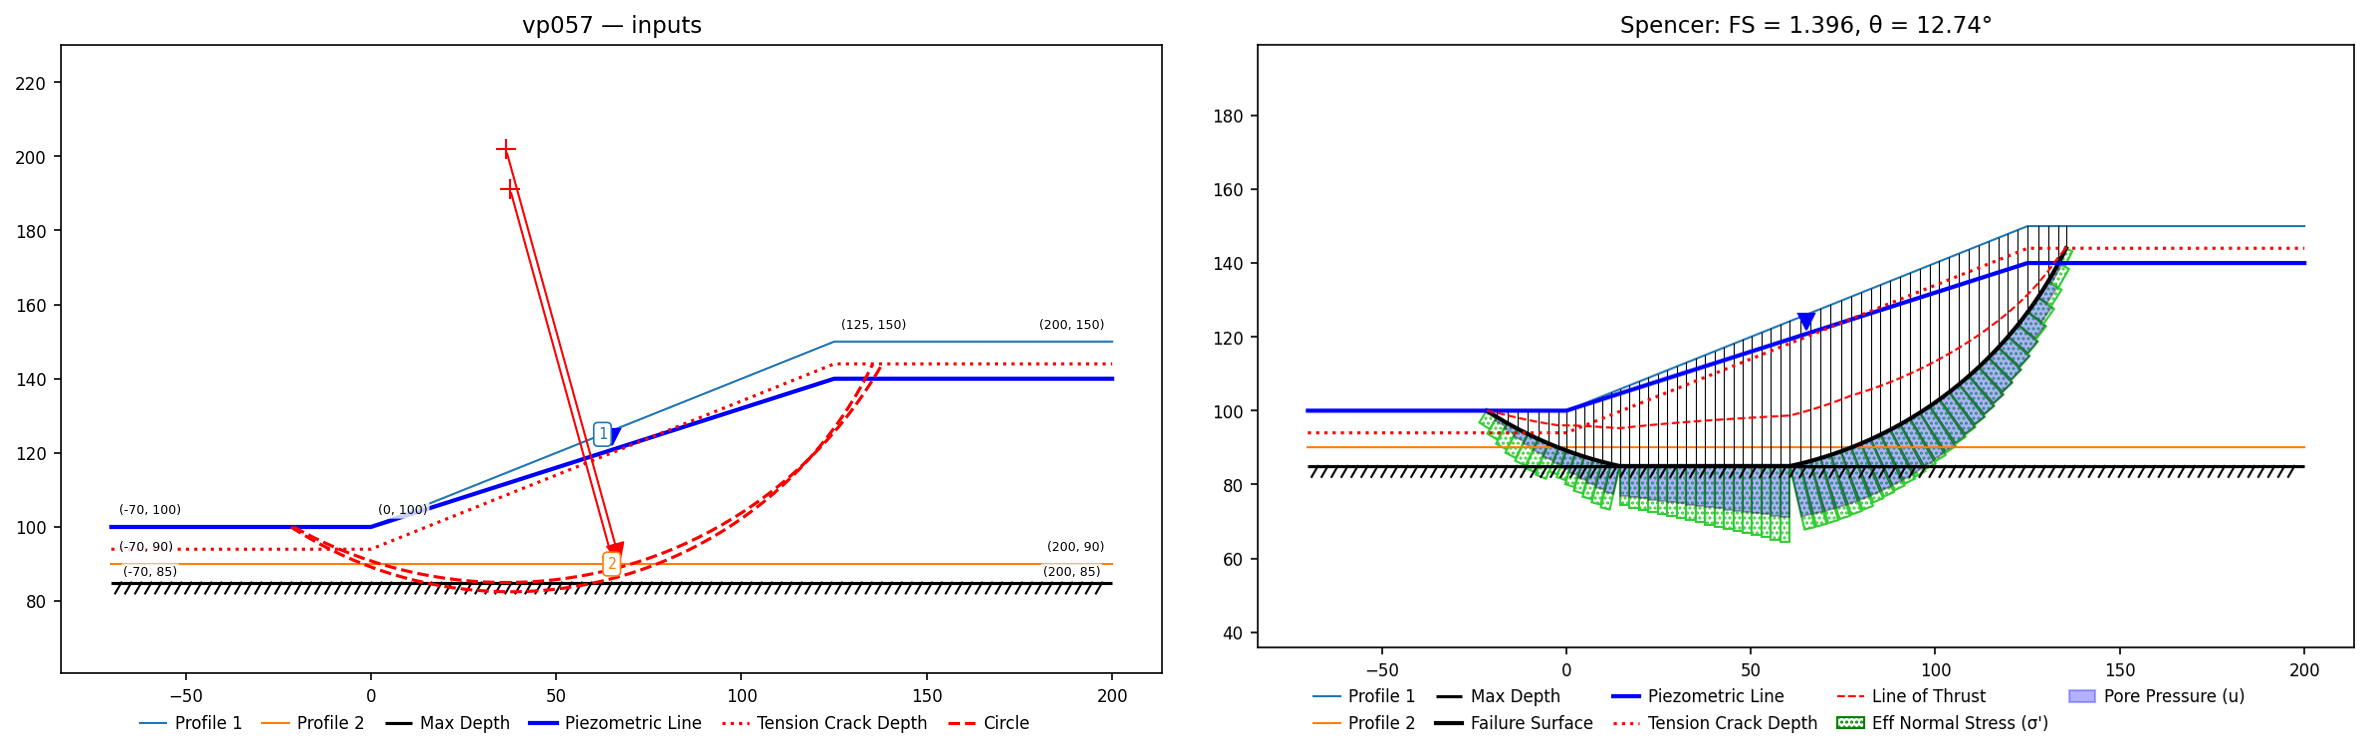
VP58: Tied-back wall in layered soil
Input files: vp058.xlsx
Pockoski & Duncan (2000)'s fourth test slope, from their eight-program comparison of reinforced-slope analysis: a 44-ft tied-back excavation wall in eight horizontal layers (granular and cohesive fills over organic silt, an over-consolidated crust, three marine clays, and glaciomarine deposits), water table at grade in front of the wall and el. 102.5 behind it. Three identical tieback rows at 20° (88 ft, 40-ft bond; capacity is bond-governed at 40,000 lb/ft of wall). Evaluated on Slide's printed critical circle, tangent to the glaciomarine contact.
| Method | XSLOPE | Slide | UTEXAS4 | SLOPE/W | WINSTABL |
|---|---|---|---|---|---|
| Bishop simplified | 1.142 | 1.147 | 1.14 | 1.14 | 1.16 |
| Spencer | 1.140 | 1.145 | 1.14 | 1.14 | 1.20 |
| Ordinary | 1.119 | 1.129 | — | 1.12 | — |
| Janbu simplified | 1.059 | 1.061 | 1.13 | 1.05 | 1.12 |
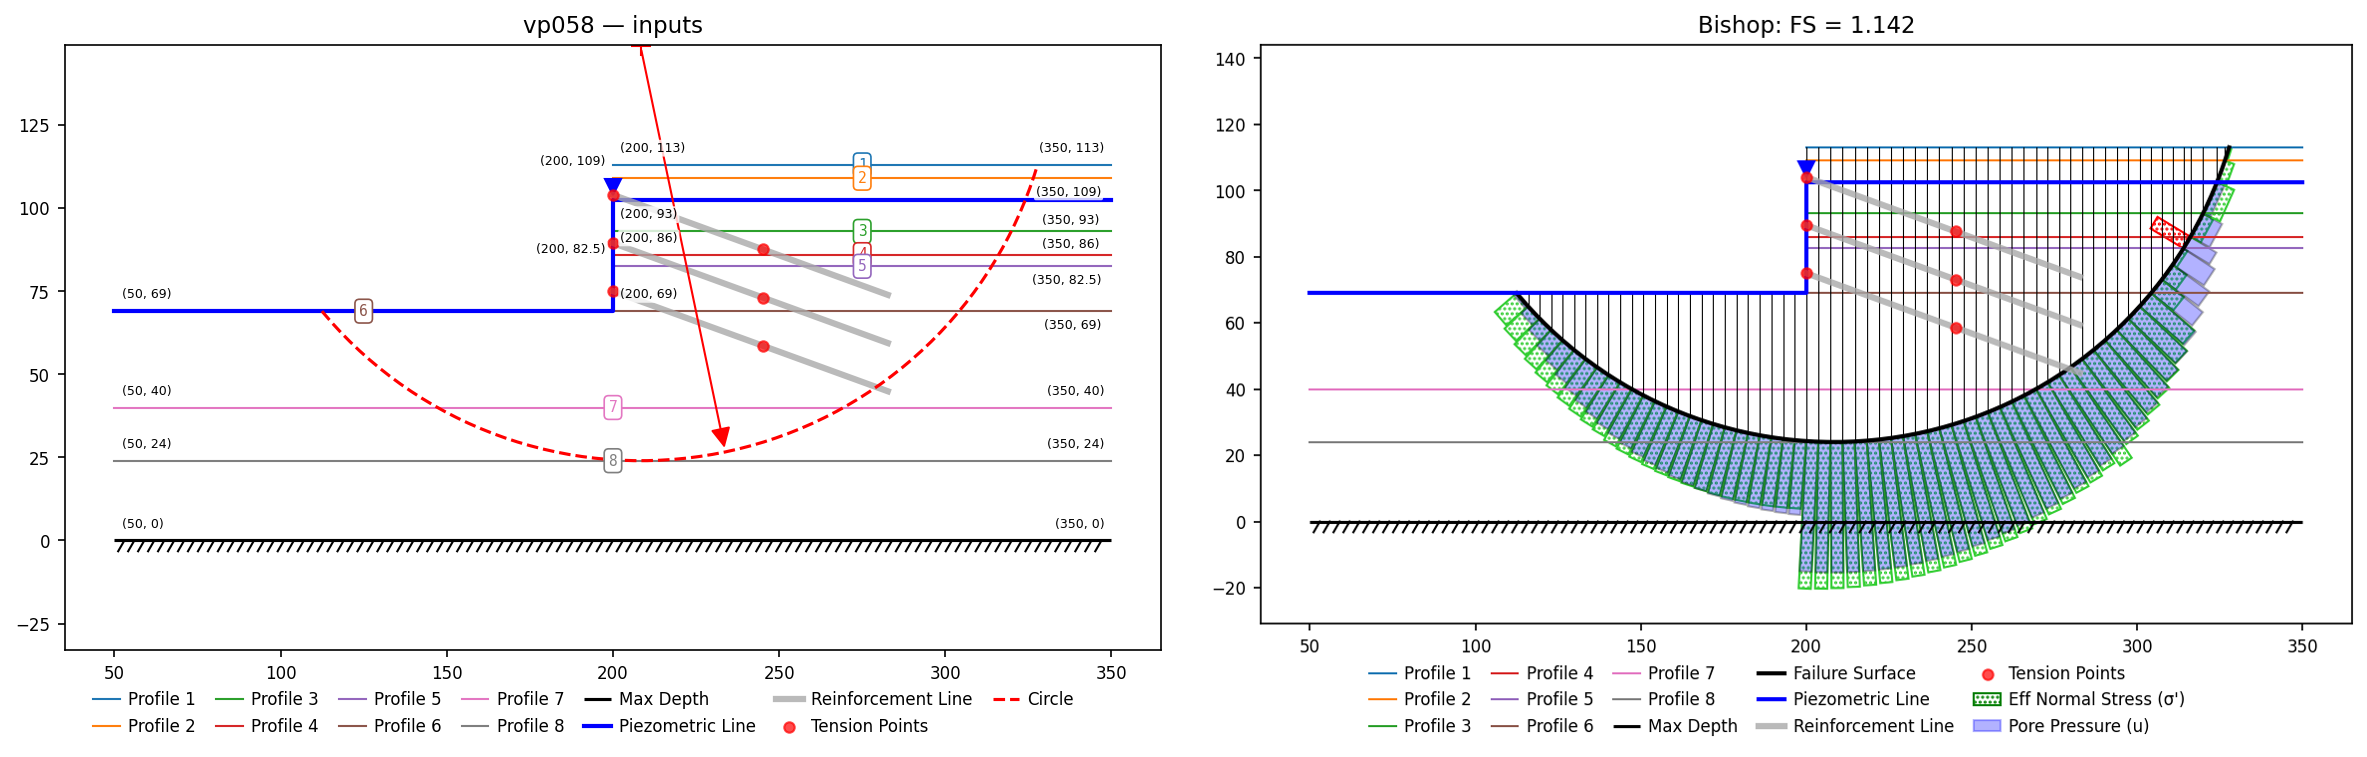
VP59: Tieback wall in sand, drawdown water table
Input files: vp059.xlsx
Pockoski & Duncan (2000)'s fifth test slope: a single-row tieback wall in homogeneous sand (c′ = 0, φ′ = 30°) with a water table drawn down to the wall face — under-designed on purpose (every published factor of safety is below 1). The critical circle is prescribed from Slide's printout, running from the wall toe (the manual pins it with a focus point) to the upper ground. The water table enters with the phreatic-inclination (Hu) pore-pressure correction that Slide and XSTABL apply on steeply inclined water tables.
| Method | XSLOPE | Slide | UTEXAS4 | SLOPE/W | WINSTABL |
|---|---|---|---|---|---|
| Janbu simplified | 0.566 | 0.583 | 0.64 | 0.61 | 0.76 |
| Corps / Lowe-Karafiath | 0.577 | 0.588 | 0.76 | — | — |
| Bishop simplified | — | 0.582 | 0.56 | 0.60 | 0.74 |
| Spencer | — | 0.596 | 0.65 | 0.59 | — |
This problem was built to stress reinforced-slope codes and it shows: the published Bishop values alone span 0.56–0.74, and Slide's own Ordinary result (0.859) sits 44% above its Spencer. On this surface XSLOPE's Spencer and Morgenstern–Price refuse the solution as inadmissible (base normals near the wall go into tension), and Bishop/OMS do not apply to a non-circular polyline, so the force-equilibrium family carries the lock; both values sit 2–3% below Slide's and within every published pairing.
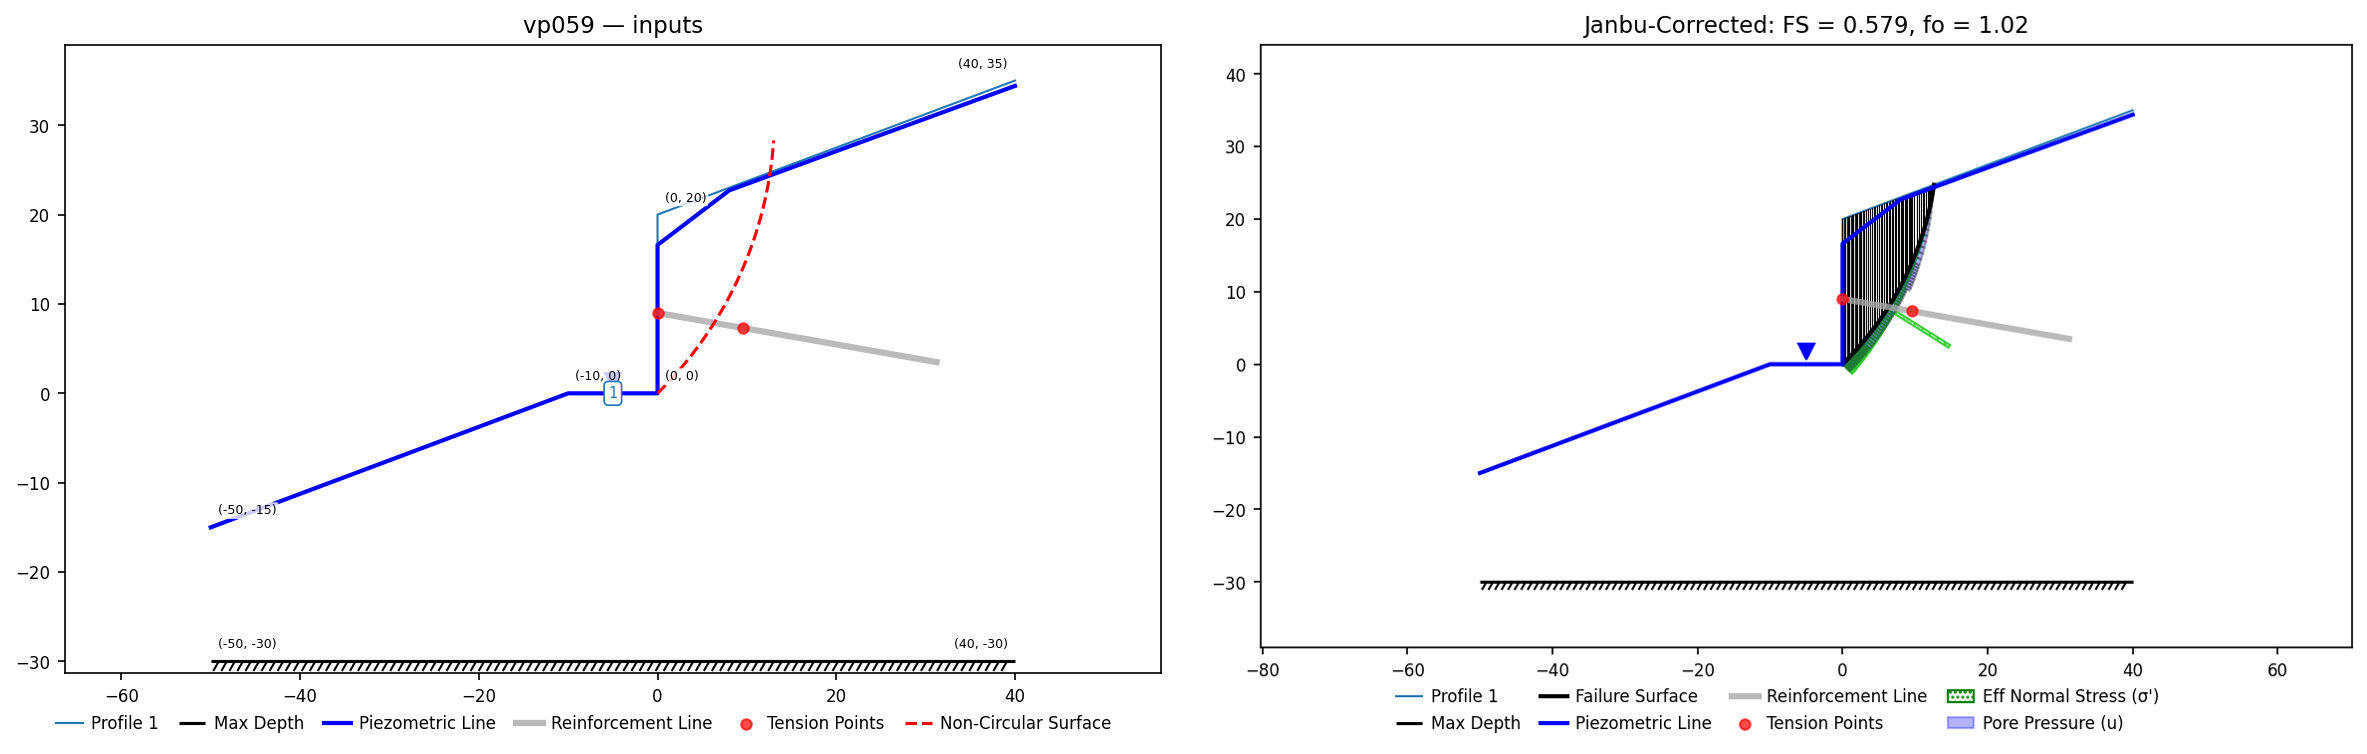
VP60: Soil-nailed wall with tension crack and surcharges
Input files: vp060.xlsx
Pockoski & Duncan (2000)'s seventh test slope: a 25-ft soil-nailed wall in undrained sandy clay (c = 800 psf, φ = 0) carrying a 250-psf surcharge across the whole crest plus a 500-psf strip over the first 7.3 ft, with a dry 7-ft tension crack. Five passive nail rows at 15° (25,918 lb tensile at 5-ft spacing, bond 1,508 lb/ft). Evaluated on Slide's printed critical circle, truncated by the crack at its printed endpoint (17.157, 18.003); at the printed geometry the top nail row passes above the truncated surface and does not participate.
| Method | XSLOPE | Slide | UTEXAS4 | SLOPE/W | WINSTABL |
|---|---|---|---|---|---|
| Spencer | 1.010 | 1.009 | 1.02 | 1.02 | 0.99 |
| Janbu simplified | 1.043 | 1.041 | 1.08 | 1.07 | 1.10 |
GOLD-NAIL reads 0.91 and SNAIL 0.84 (wedge) on their own mechanisms — the nailed-wall codes and the LEM codes disagree more with each other than the LEM codes do among themselves.
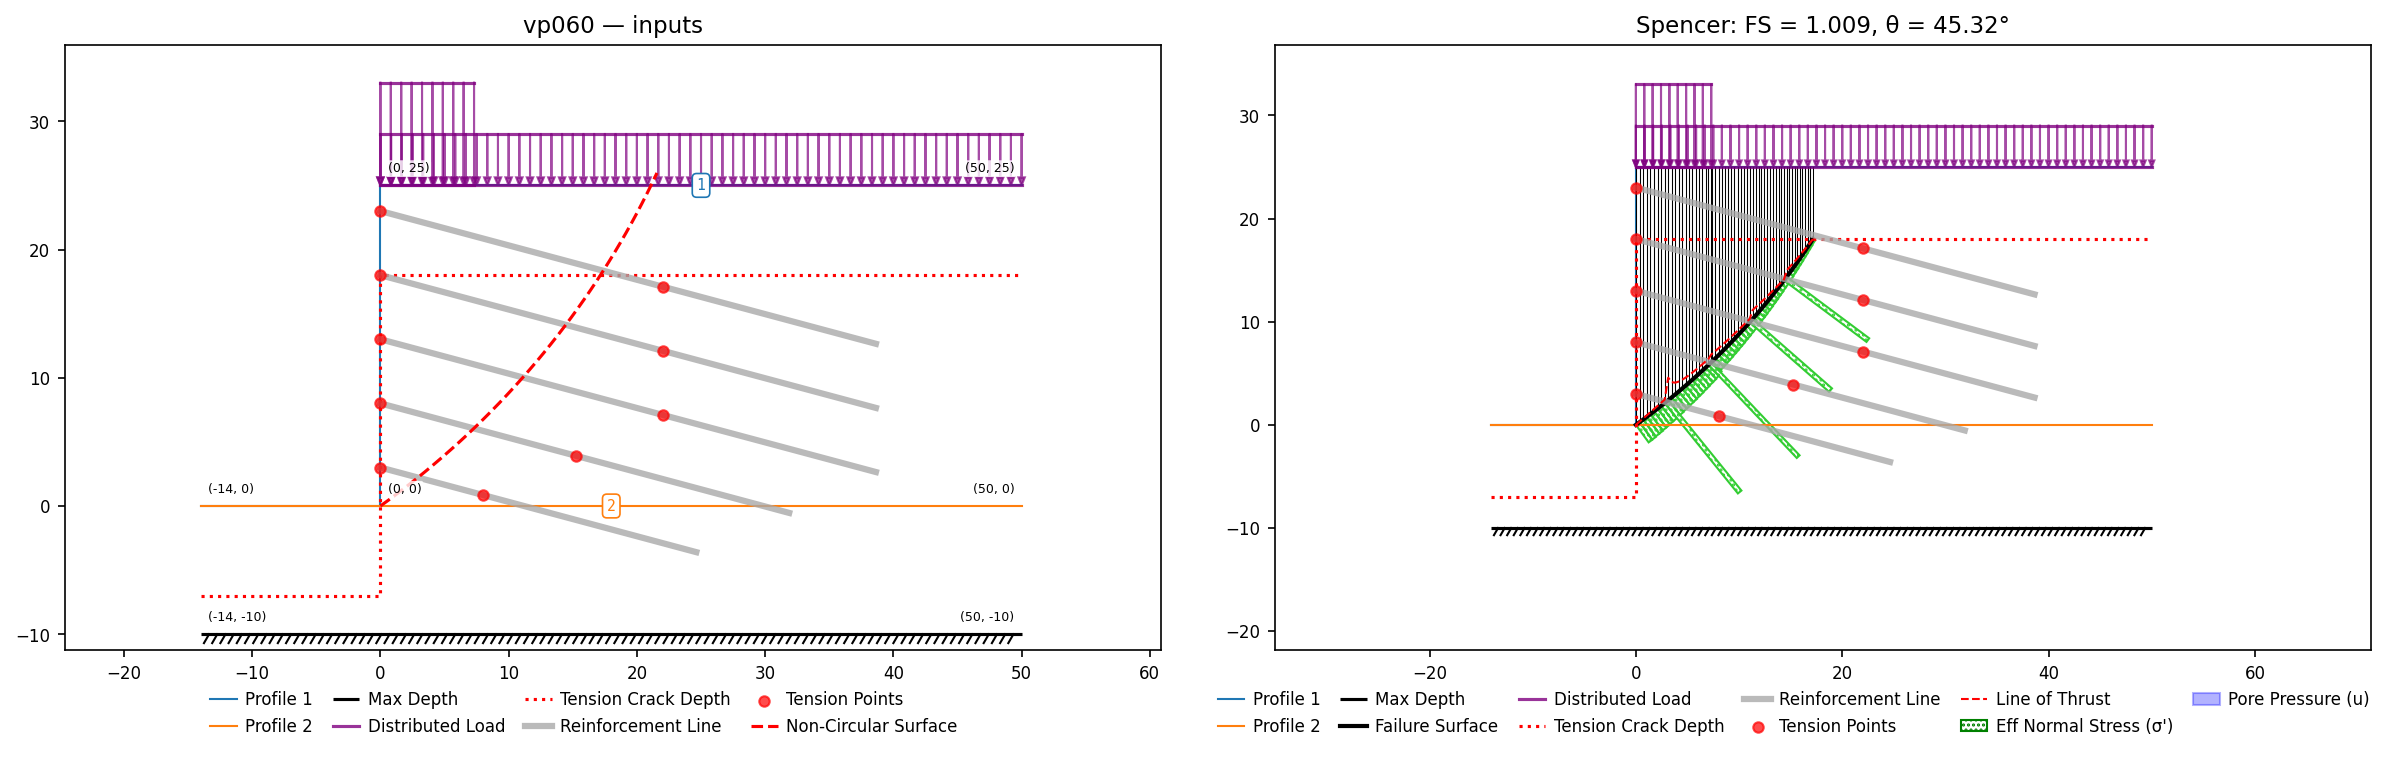
VP61: London clay, linear vs non-linear envelope (Baker ex. 3)
Slide #61 / Baker (2003) example problem 3: the same 43°, H = 6 m slope as #44, with strength functions fitted to Perry's CD triaxial data on London clay — (a) power curve τ = 3.39344·(σ′+0.152)^0.6 (Baker A = 0.535, n = 0.60, T = 0.0015) and (b) the fitted Mohr-Coulomb envelope c′ = 6.0 kPa, φ′ = 32°. Unlike the compacted-clay data of #44, this data set includes measurements at very low normal stress, so the two envelopes give similar factors of safety.
Input files: vp061a.xlsx, vp061b.xlsx
| Case | Method | XSLOPE | Published |
|---|---|---|---|
| (a) power curve | Spencer | 1.466 | Slide 1.468; Baker 1.48 |
| (b) Mohr-Coulomb | Spencer | 1.367 | Slide 1.366; Baker 1.35 |
Slide's Janbu rows (1.348/1.291) are simplified/uncorrected, as in #44/#45.
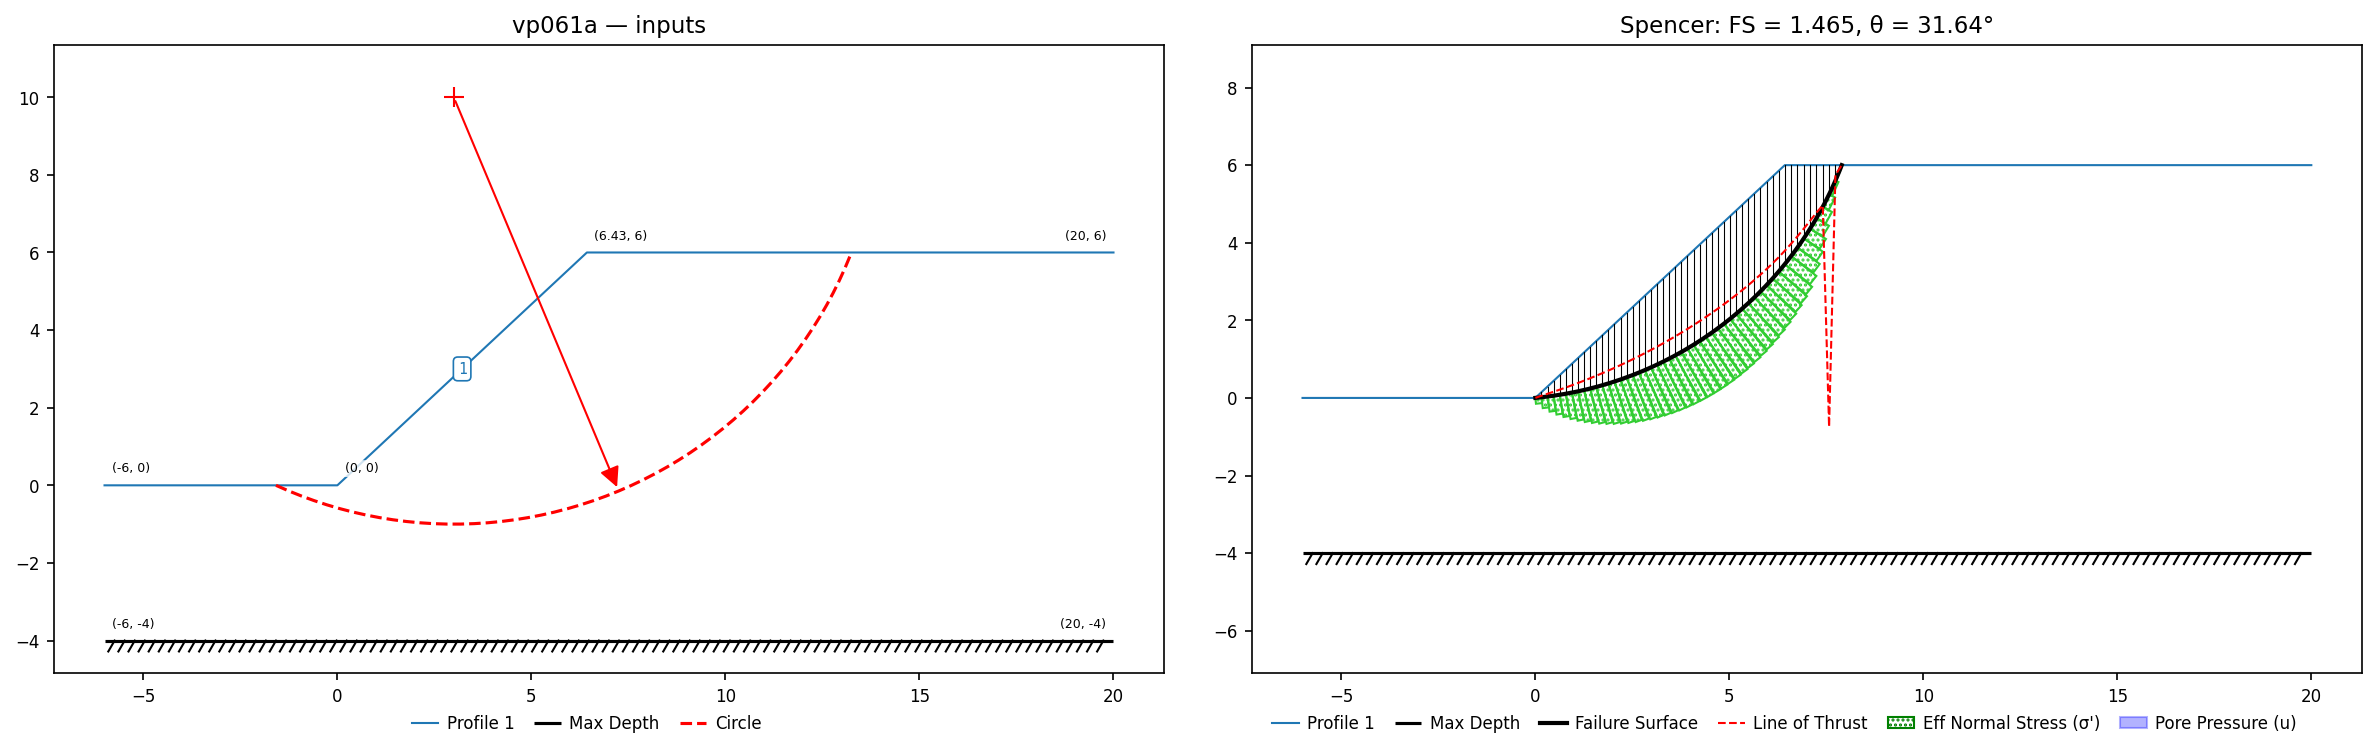
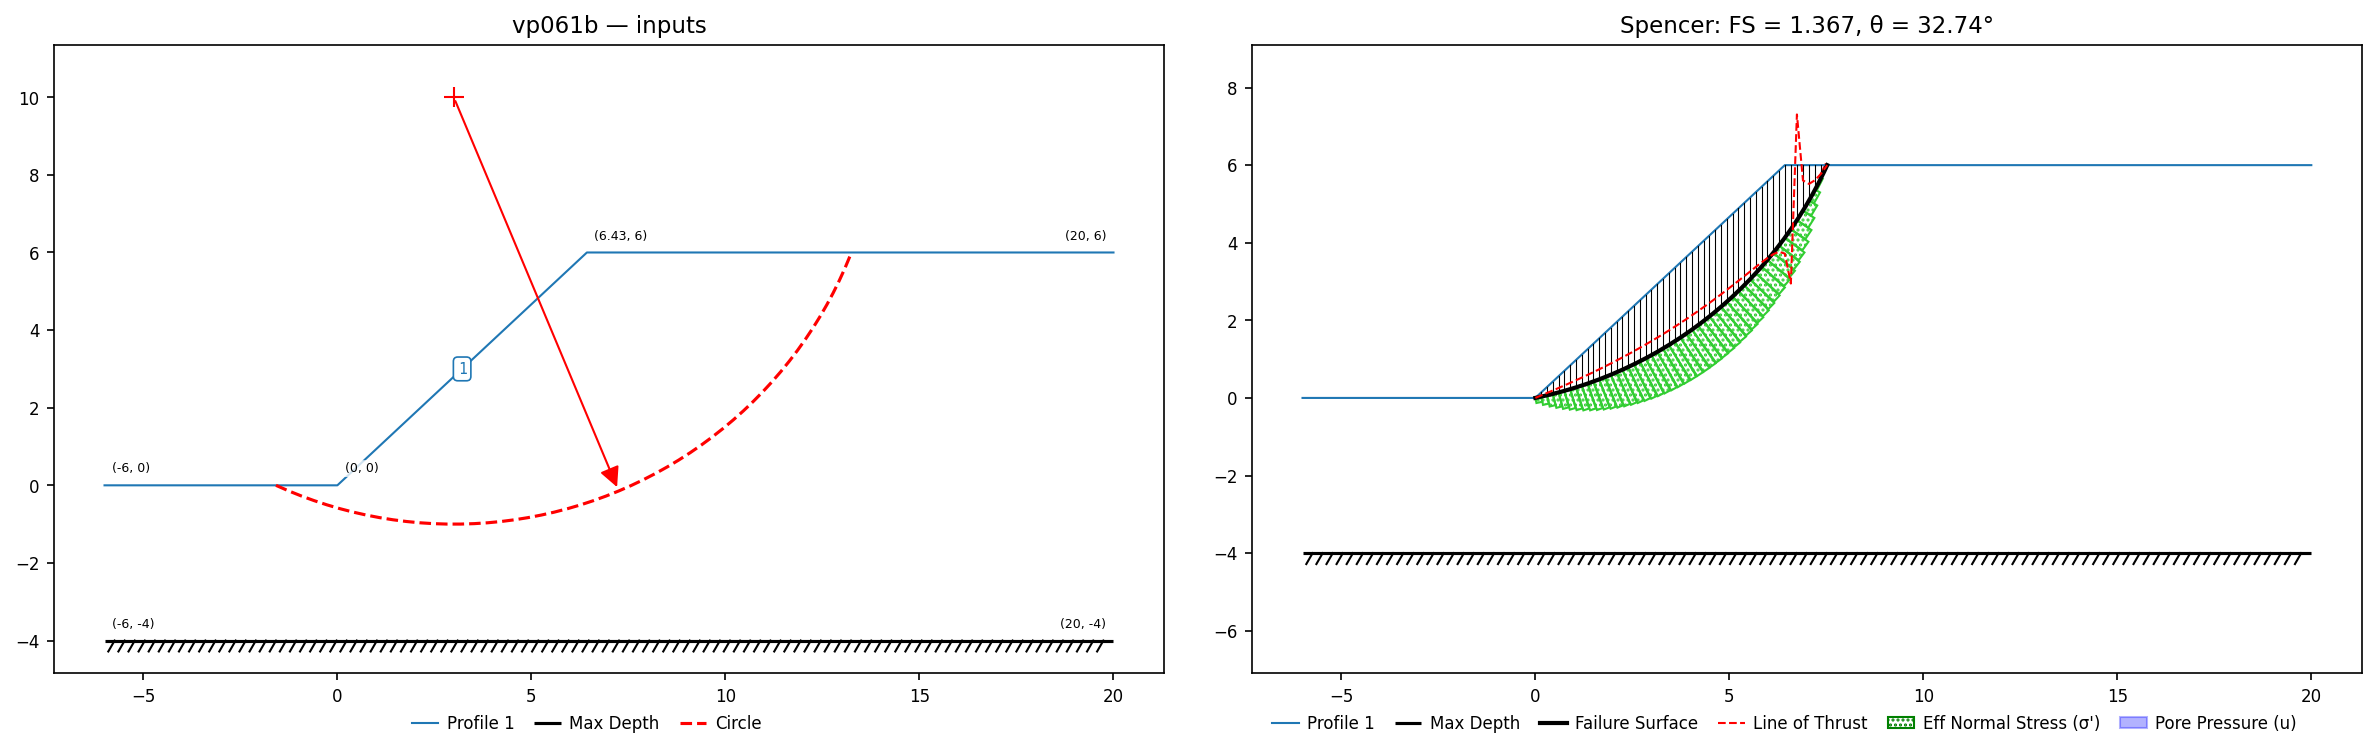
VP62: Slope, homogenous, ru pore pressure, seismic
Slide #62 dry case, kc=0.432. Slide circular: Spencer 1.001, Bishop 0.991; Loukidis log-spiral Spencer 1.000.
Slide #62 ru=0.5 case, kc=0.132. Slide circular: Spencer 1.001, Bishop 0.987; Loukidis 1.000.
Input files: vp062a.xlsx, vp062b.xlsx
Dry, kc = 0.432
| Method | XSLOPE | Published |
|---|---|---|
| Bishop | 0.991 | Slide 0.991; SLOPE/W 0.993 |
| Spencer | 1.001 | Slide 1.001; SLOPE/W 1.001; Loukidis 1.000 |
ru = 0.5, kc = 0.132
| Method | XSLOPE | Published |
|---|---|---|
| Bishop | 0.986 | Slide 0.987; SLOPE/W 0.988 |
| Spencer | 1.001 | Slide 1.001; SLOPE/W 1.001; Loukidis 1.000 |
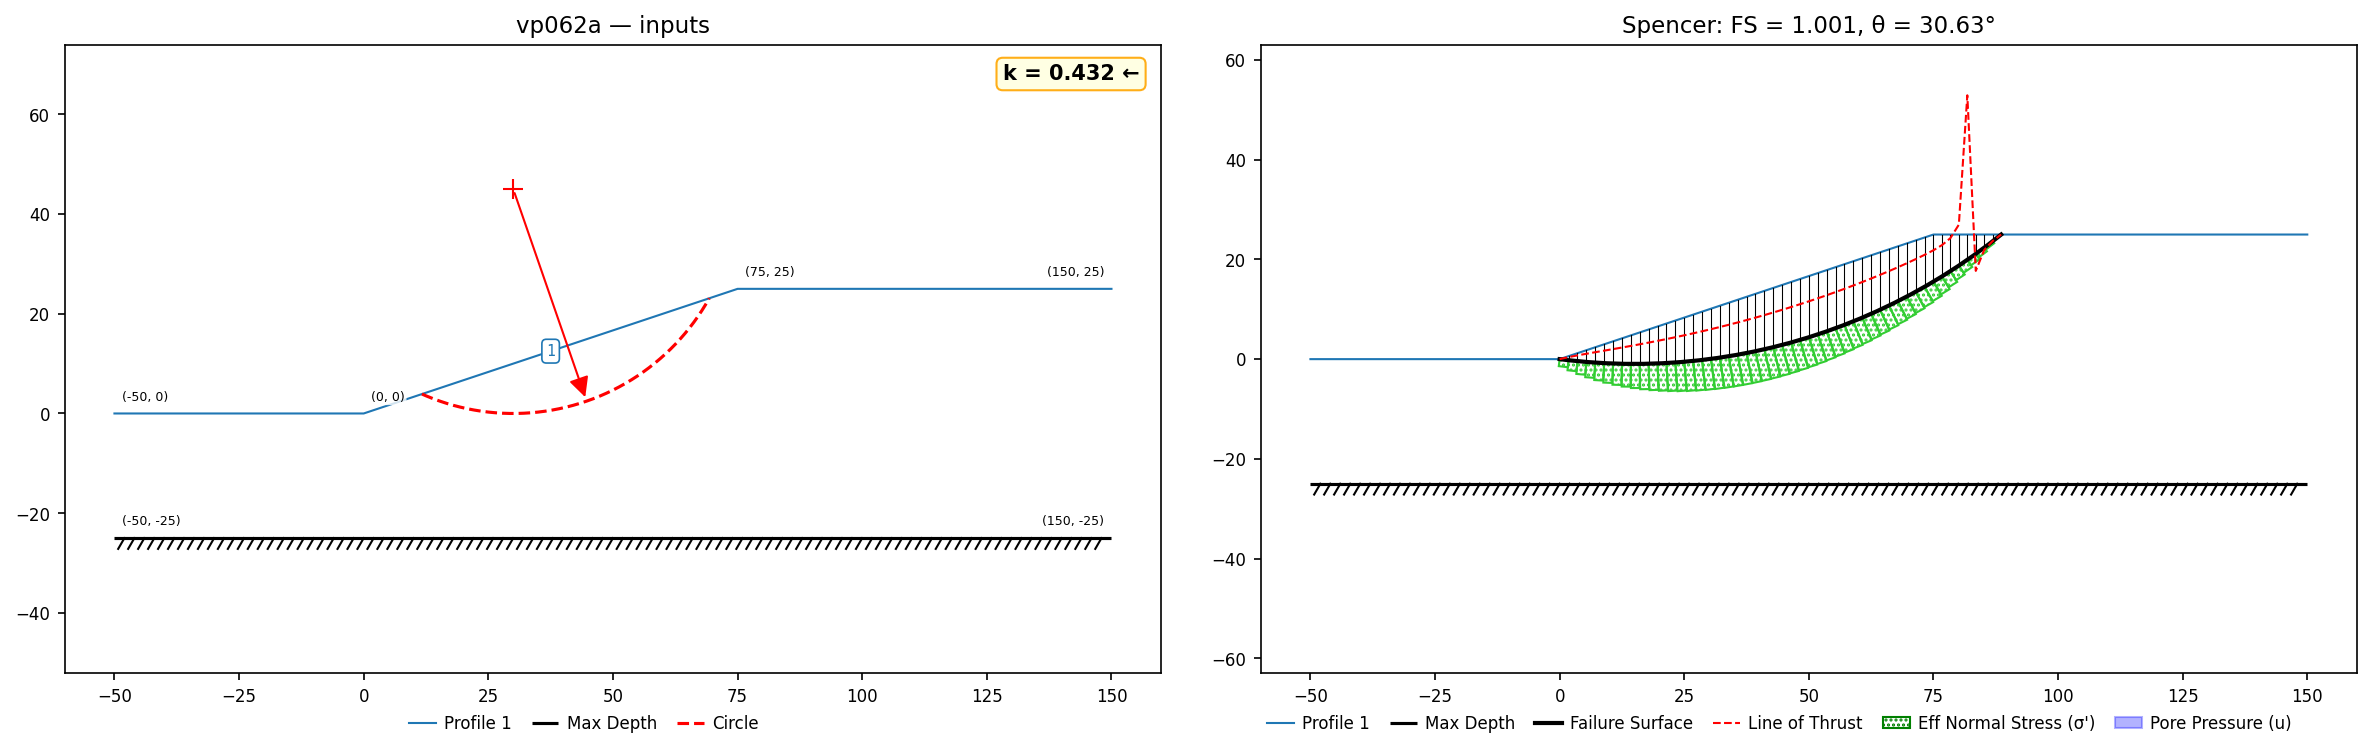
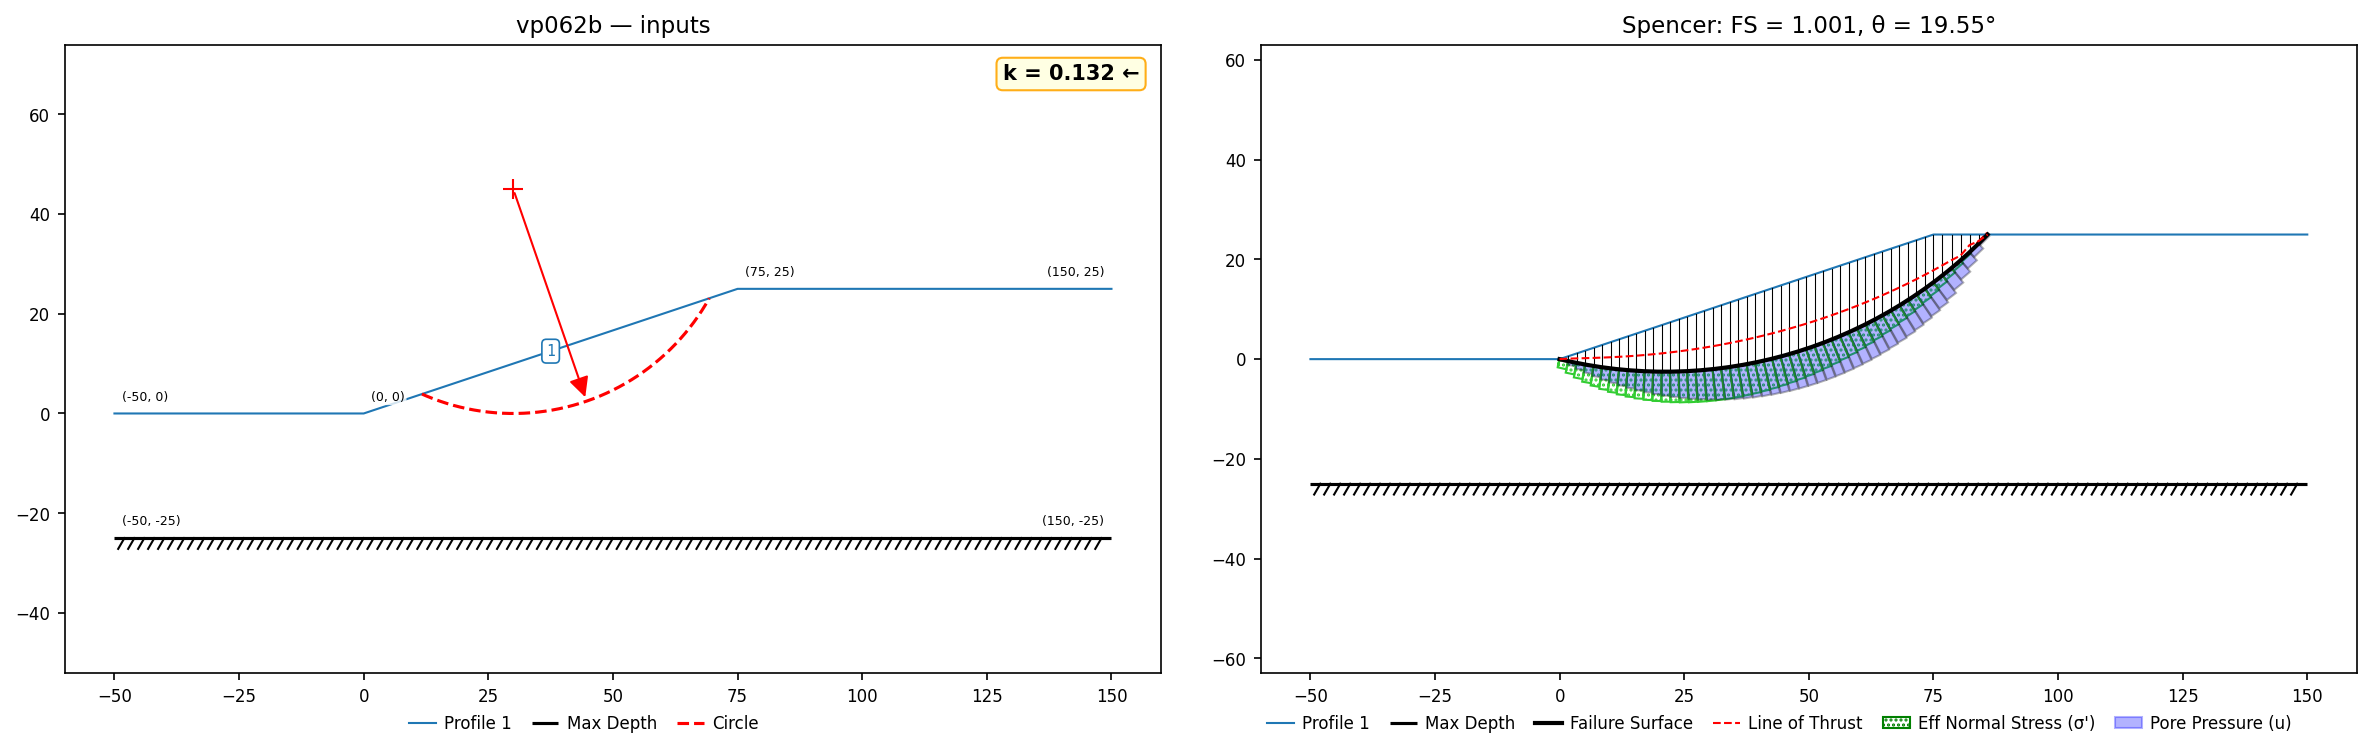
VP63: Slope, (3) materials, seismic — critical seismic coefficient
Input files: vp063.xlsx
Loukidis, Bandini & Salgado (2003)'s second example: a three-layer dry slope (a weak φ = 15° middle layer between a light c = 4 kPa cap and a strong φ = 45° base) loaded pseudo-statically at the paper's critical seismic coefficient kc = 0.155 — the coefficient at which the factor of safety is exactly 1. Loukidis analyzed a log-spiral mechanism; Slide reproduced it with a path search plus Monte-Carlo optimization; XSLOPE runs its noncircular search from a seed through the layer-2/3 daylight point on the lower slope face, which the manual identifies as a point on the critical surface.
| XSLOPE | Slide | Loukidis et al. | |
|---|---|---|---|
| Spencer, noncircular search | 1.001 | 0.991 | 1.000 (log-spiral, by definition of kc) |
The critical surface enters at the daylight point (35.8, 27.9) and exits on the crest at x ≈ 121. The paper's own cross-bearings bracket the same answer: rigorous limit analysis bounds kc between 0.148 and 0.172, finite elements give 0.161, and Sarma's method 0.159, against the 0.155 used here. A circular search reads 1.031 on this problem — the mechanism is genuinely noncircular. Geometry is calibrated from the Slide figure's vertex dots; Slide's bench is 12 m wide where the paper's figure annotates 8 m, and Slide's model is the factor-of-safety target here.
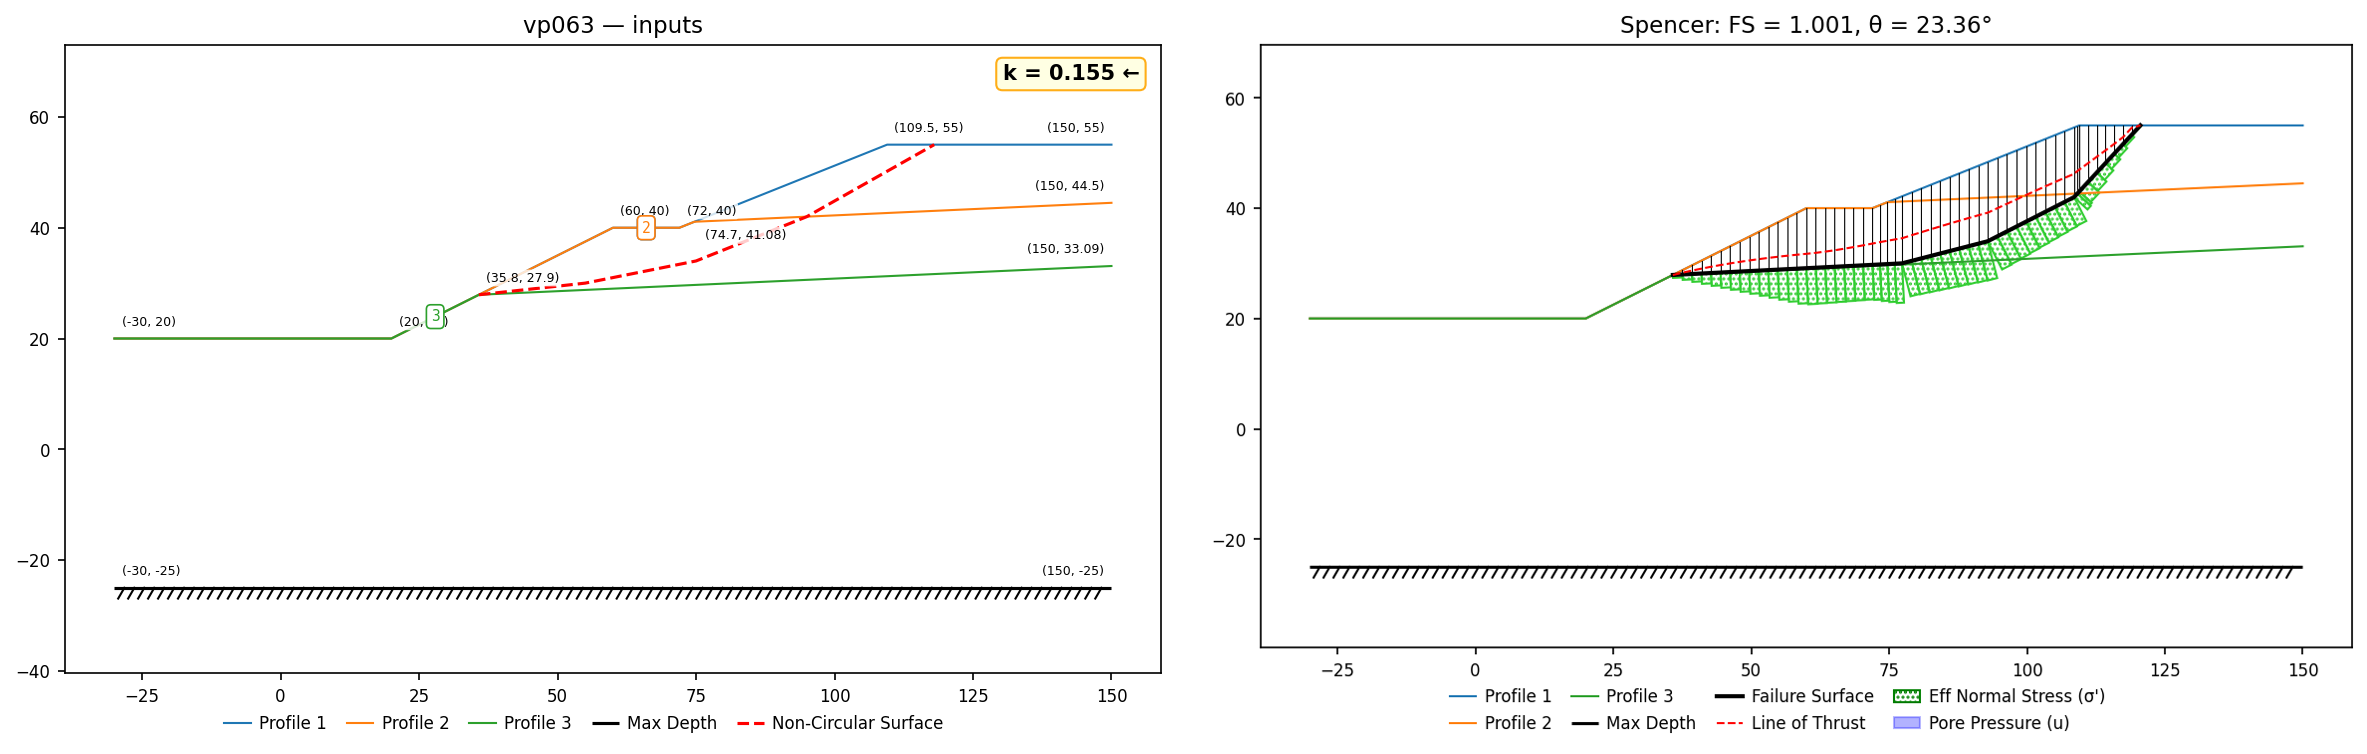
VP64: USACE end-of-construction dam (EM 1110-2-1902 Fig. 4-1)
Slide #64 / USACE EM 1110-2-1902 (2003) Figure 4-1: the manual's Spencer hand-verification dam at end-of-construction — a symmetric 50-ft embankment at 4H:1V (undrained c=1000 psf, φ=5°) over a 10-ft sand blanket, foundation clay (c=3000, φ=0) and rock, with an embankment core trench through the sand, groundwater at the sand top, and a 7-ft crest tension crack. Evaluated on the specified circle (center (102,163), tangent to el. 0).
Input files: vp064.xlsx
| Method | XSLOPE | Published |
|---|---|---|
| Spencer | 2.488 | Slide 2.445; USACE 2.44 |
| Bishop | 2.489 | Slide 2.447 |
+1.8%. Neither figure labels its vertices; the crest half-width (17 ft) and toes (±217) were pinned by reconciling USACE's printed slice table (slice 1: width 23 ft, average height 16 ft; 173-ft total span). The residual is within that geometric uncertainty.
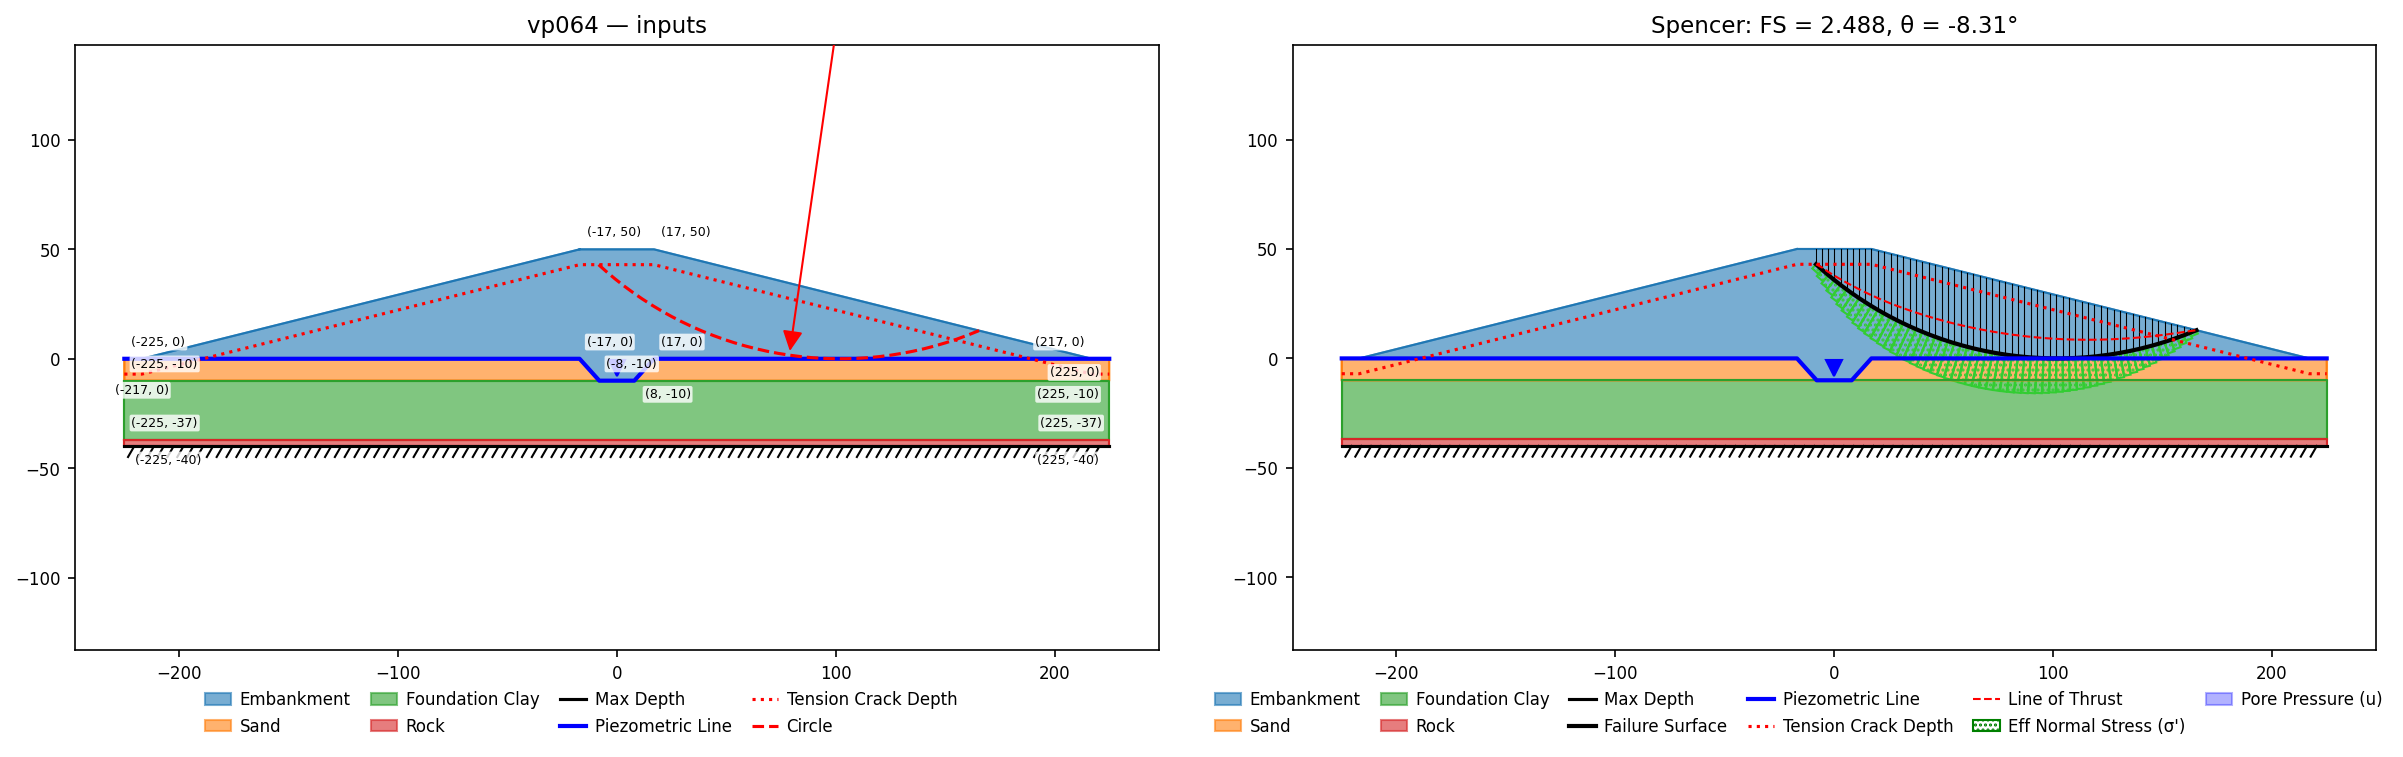
VP65: USACE dam, upstream low pool (EM 1110-2-1902 Fig. 4-2)
Slide #65: the #64 dam under steady low-pool conditions — drained strengths (embankment c = 100 psf, φ = 25°; sand 0/35; clay 0/28; rock 0/45, moist/saturated unit-weight splits), pool at el. 20 with the pond load on the submerged upstream face, no tension crack. Evaluated on USACE's printed circle (center (−102, 163), R = 173, tangent to the clay top).
Input files: vp065.xlsx
| Method | XSLOPE | Published |
|---|---|---|
| Bishop | 2.725 | Slide 2.716; USACE 2.71 |
| Spencer | 2.748 | Slide 2.736 |
Janbu corrected reads 2.522 vs Slide's 2.650 — the fo chart correction differs on this deep, pond-loaded upstream circle; the force-equilibrium base values agree.
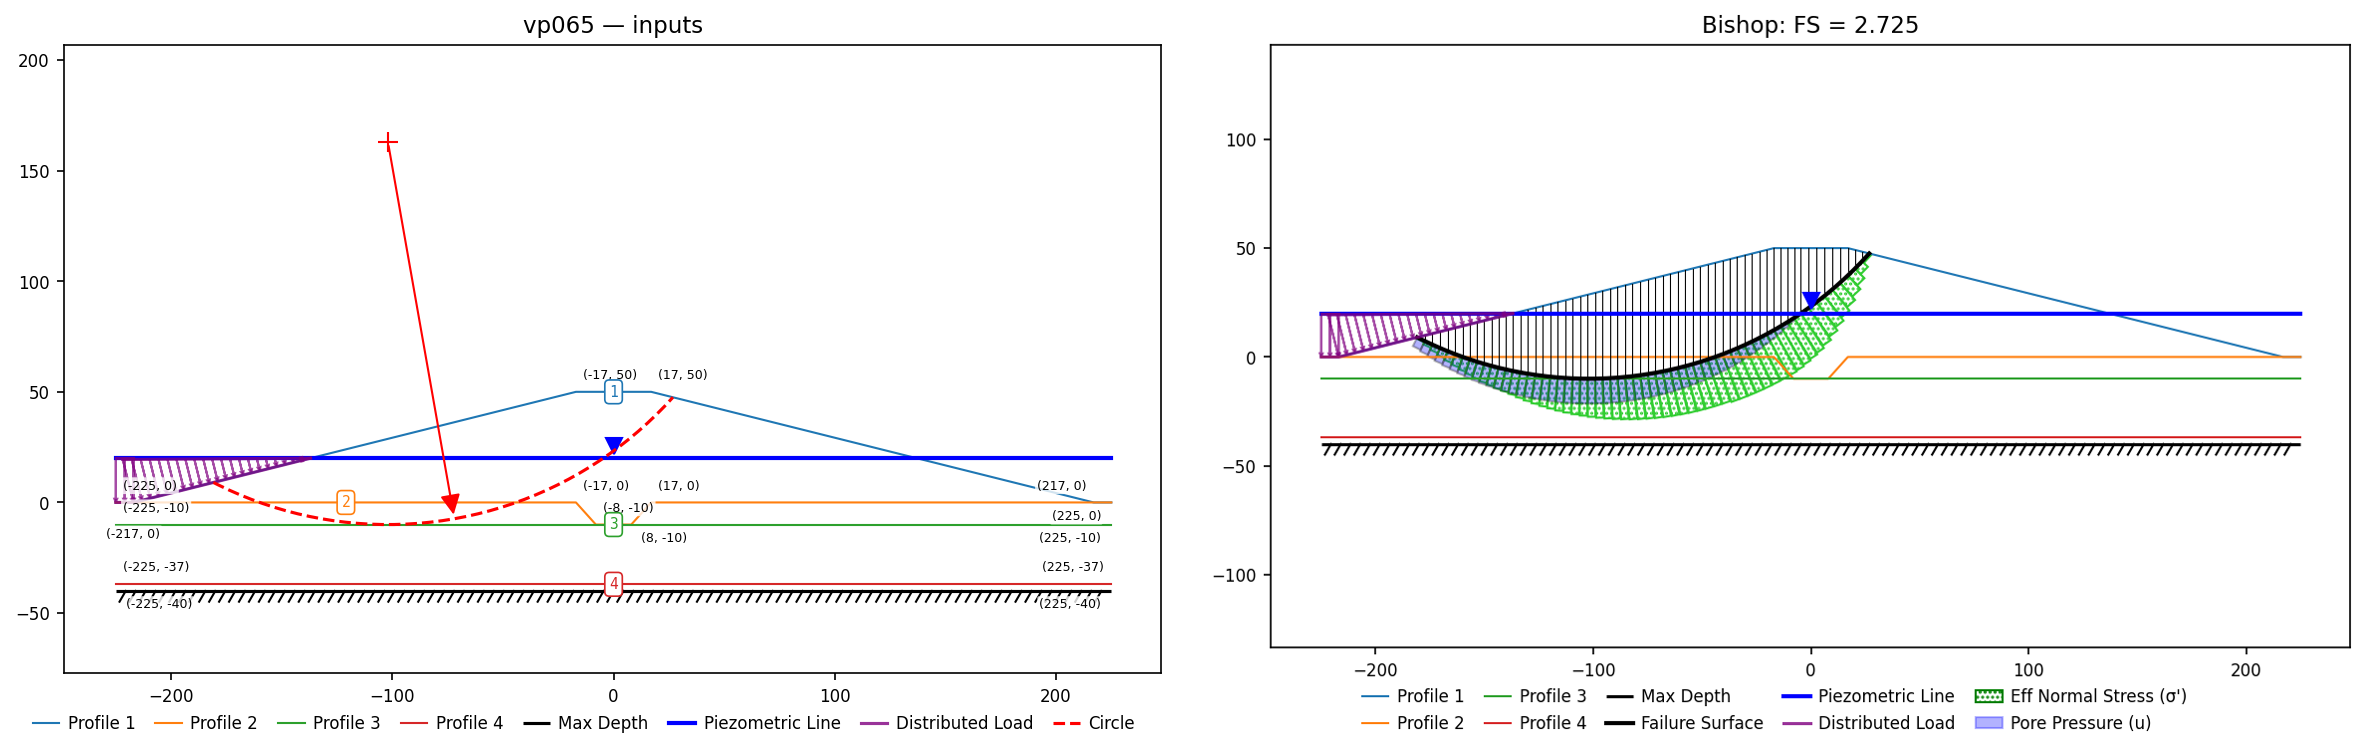
VP66: USACE dam, chart-check properties (EM 1110-2-1902 Fig. 4-3)
Slide #66: the same dam family as #64/#65 with the manual's chart-check property set (single unit weights: embankment c = 200 psf, φ = 25°, γ = 115; sand 0/35/130; clay 0/27/115), pool at el. 20, evaluated on Slide's printed circle (center (−135, 169), tangent to the sand top). Slide's printed slip endpoints prove its model uses a slightly different face than its #64/#65 siblings (toe −222, crest edge −15, 1:4.14) — reproduced here; the circle needs +0.1 ft of radius past its exact crest-corner tangency to intersect.
Input files: vp066.xlsx
| Method | XSLOPE | Published |
|---|---|---|
| Spencer | 2.258 | Slide 2.307; USACE 2.30 |
| Bishop | 2.254 | Slide 2.307 |
−2.1%; the three Slide sibling models (#64/#65/#66) carry three slightly different digitizations of the same USACE dam, so each is matched against its own printed evidence.
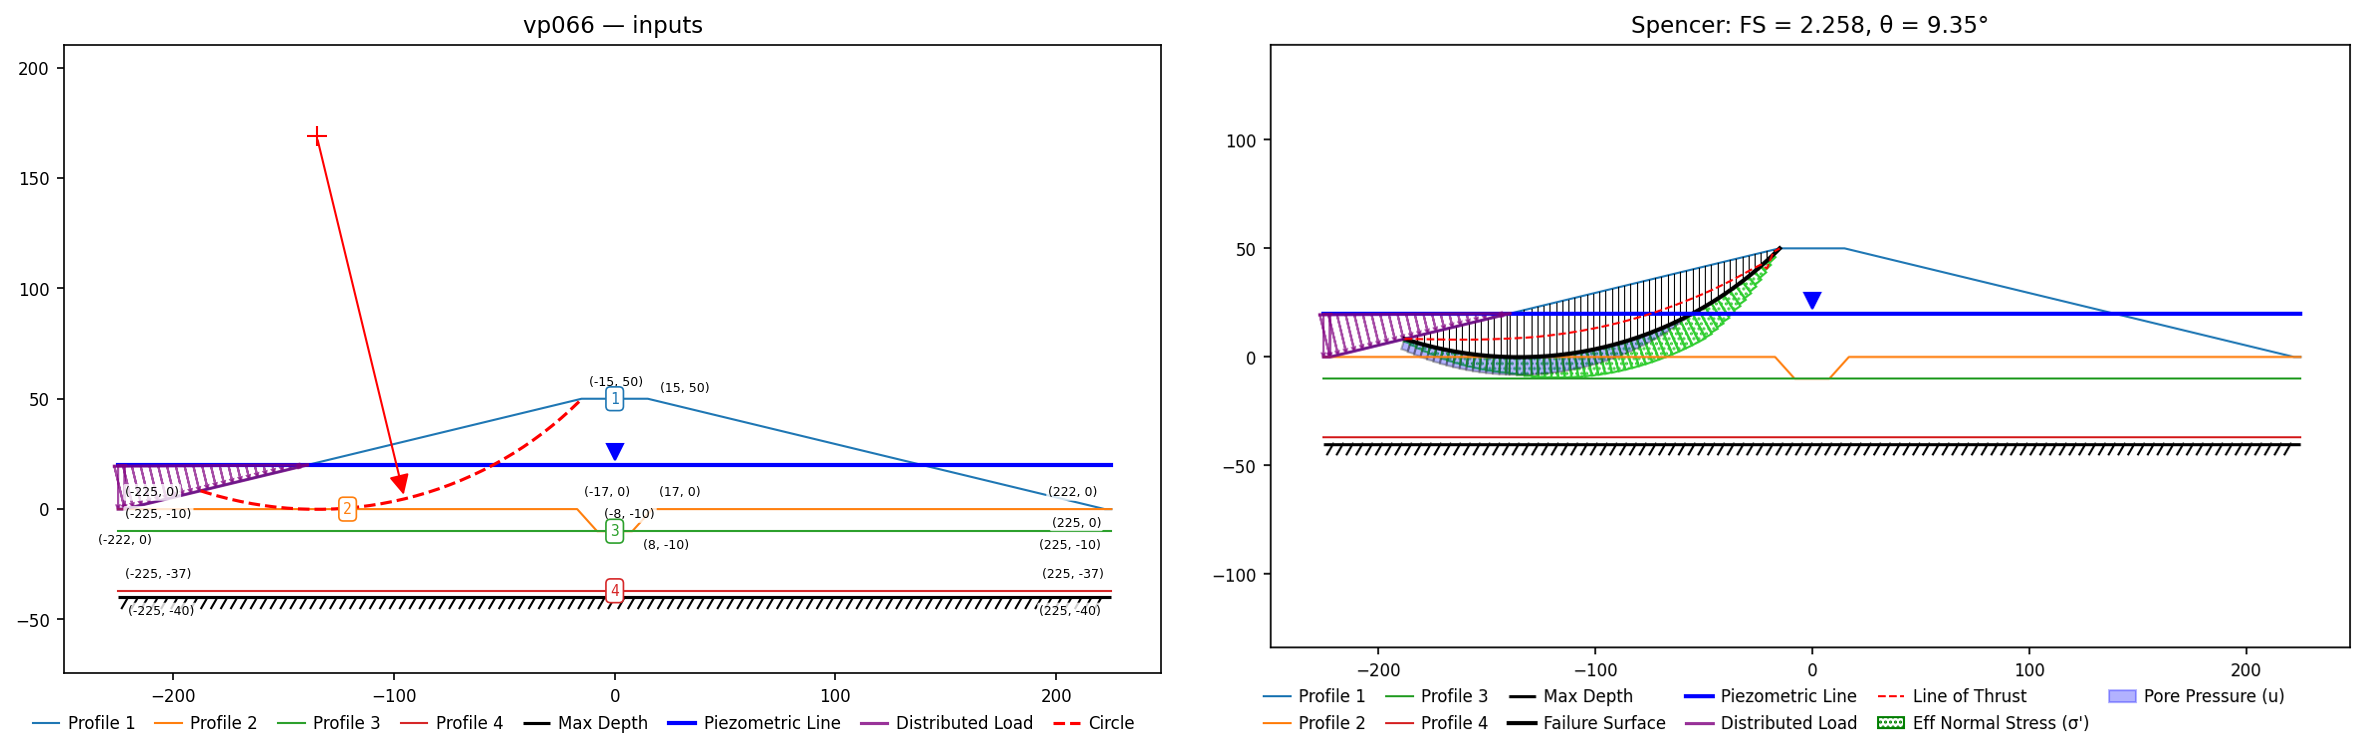
VP67: USACE end-of-construction embankment (example F-5)
Slide #67 / USACE EM 1110-2-1902 (2003) example F-5: a non-homogeneous embankment (c = 1780 psf, φ = 5°, γ = 135 pcf) on a 100-ft undrained fine-grained foundation (c = 1600 psf, φ = 2°, γ = 127 pcf), analyzed at end of construction. Slide's figure labels every vertex; the circle is centered 259 ft above and 101 ft right of the toe and passes through the toe (R = 278.0).
Input files: vp067.xlsx
| Method | XSLOPE | Published |
|---|---|---|
| Spencer | 1.316 | Slide 1.328; USACE 1.33 |
| Bishop | 1.320 | Slide 1.332 |
| Janbu (corrected) | 1.340 | Slide 1.345 |
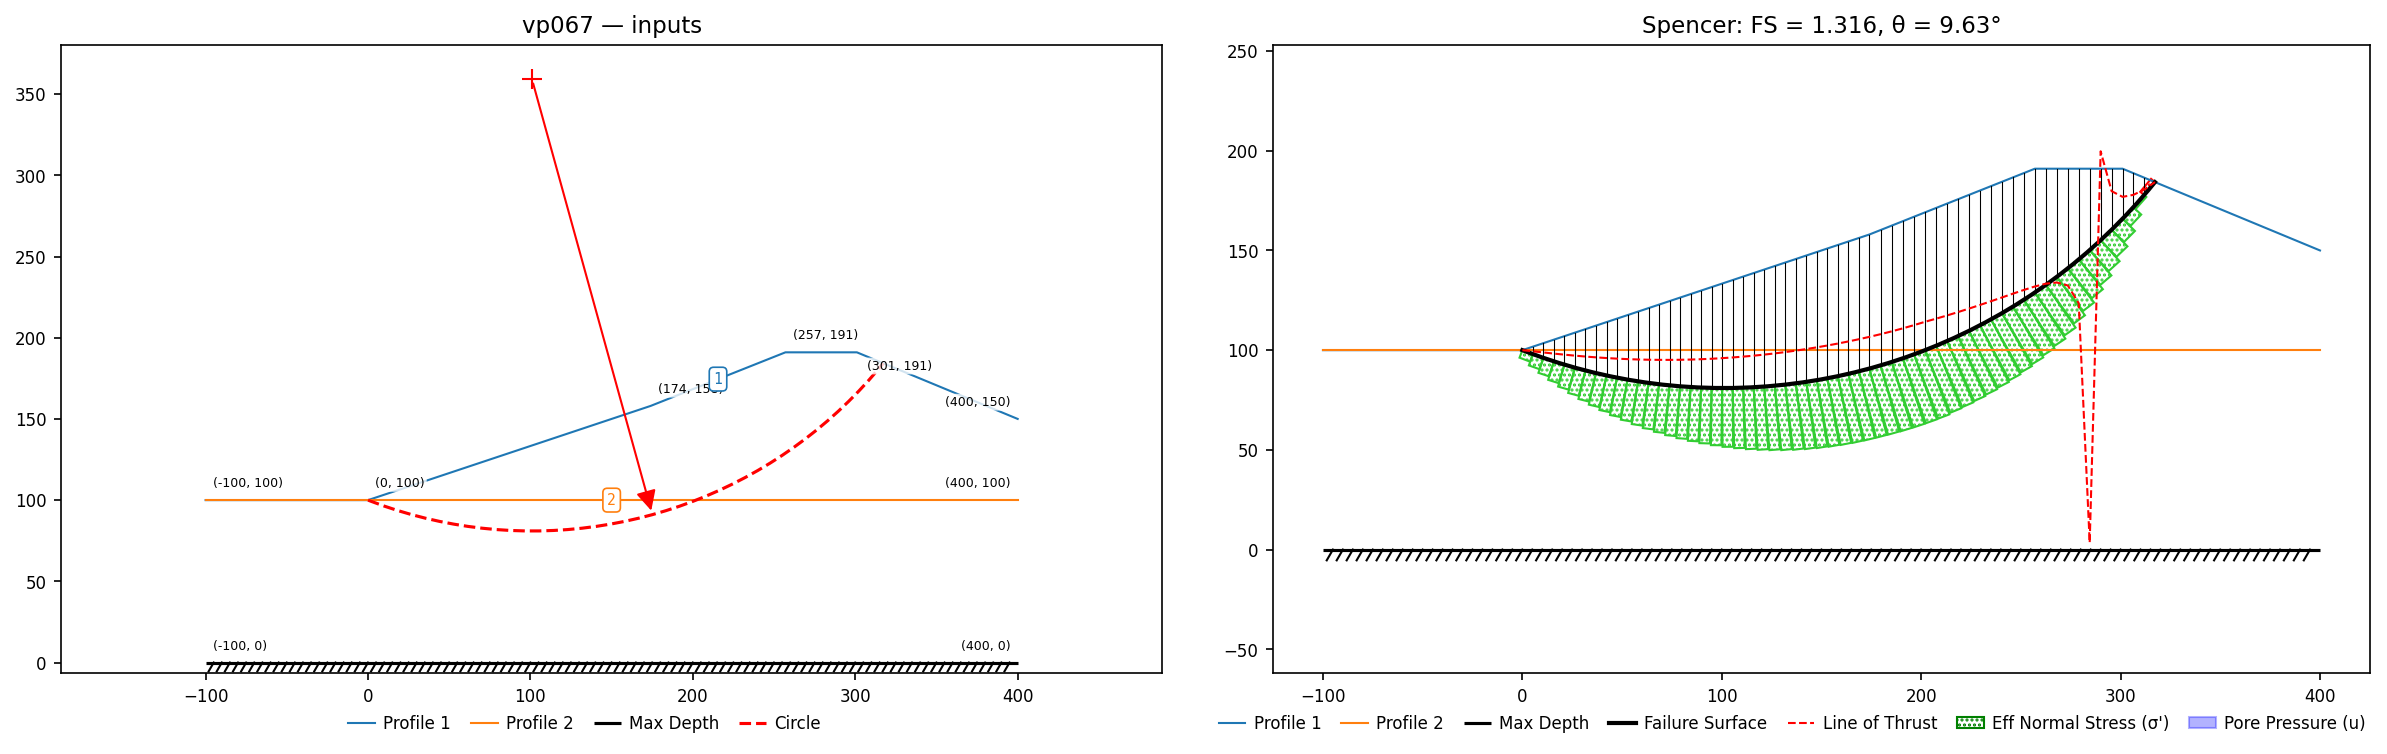
VP68: USACE φ=0 slope with ponded water (example E-10)
Slide #68 / USACE EM 1110-2-1902 example E-10: an undrained three-layer slope (c = 600/400/500 psf, γ = 120/100/105 pcf, all φ = 0) with 8 ft of water ponded against it (pool el. 0), fully labeled figure. The specified circle sits 8.4 ft right and 36 ft above the toe and is tangent to the base of soil 3 (center (48.4, 28), R = 48).
Input files: vp068.xlsx
| Method | XSLOPE | Published |
|---|---|---|
| Bishop | 1.234 | Slide 1.241 |
| Morgenstern-Price | 1.234 | Slide GLE 1.244 |
USACE's own E-10 chart solution is 1.33; Slide notes the same offset. Spencer's admissibility guard declines this surface (base tension at the φ=0 crest slices); M-P carries the complete-equilibrium comparison.
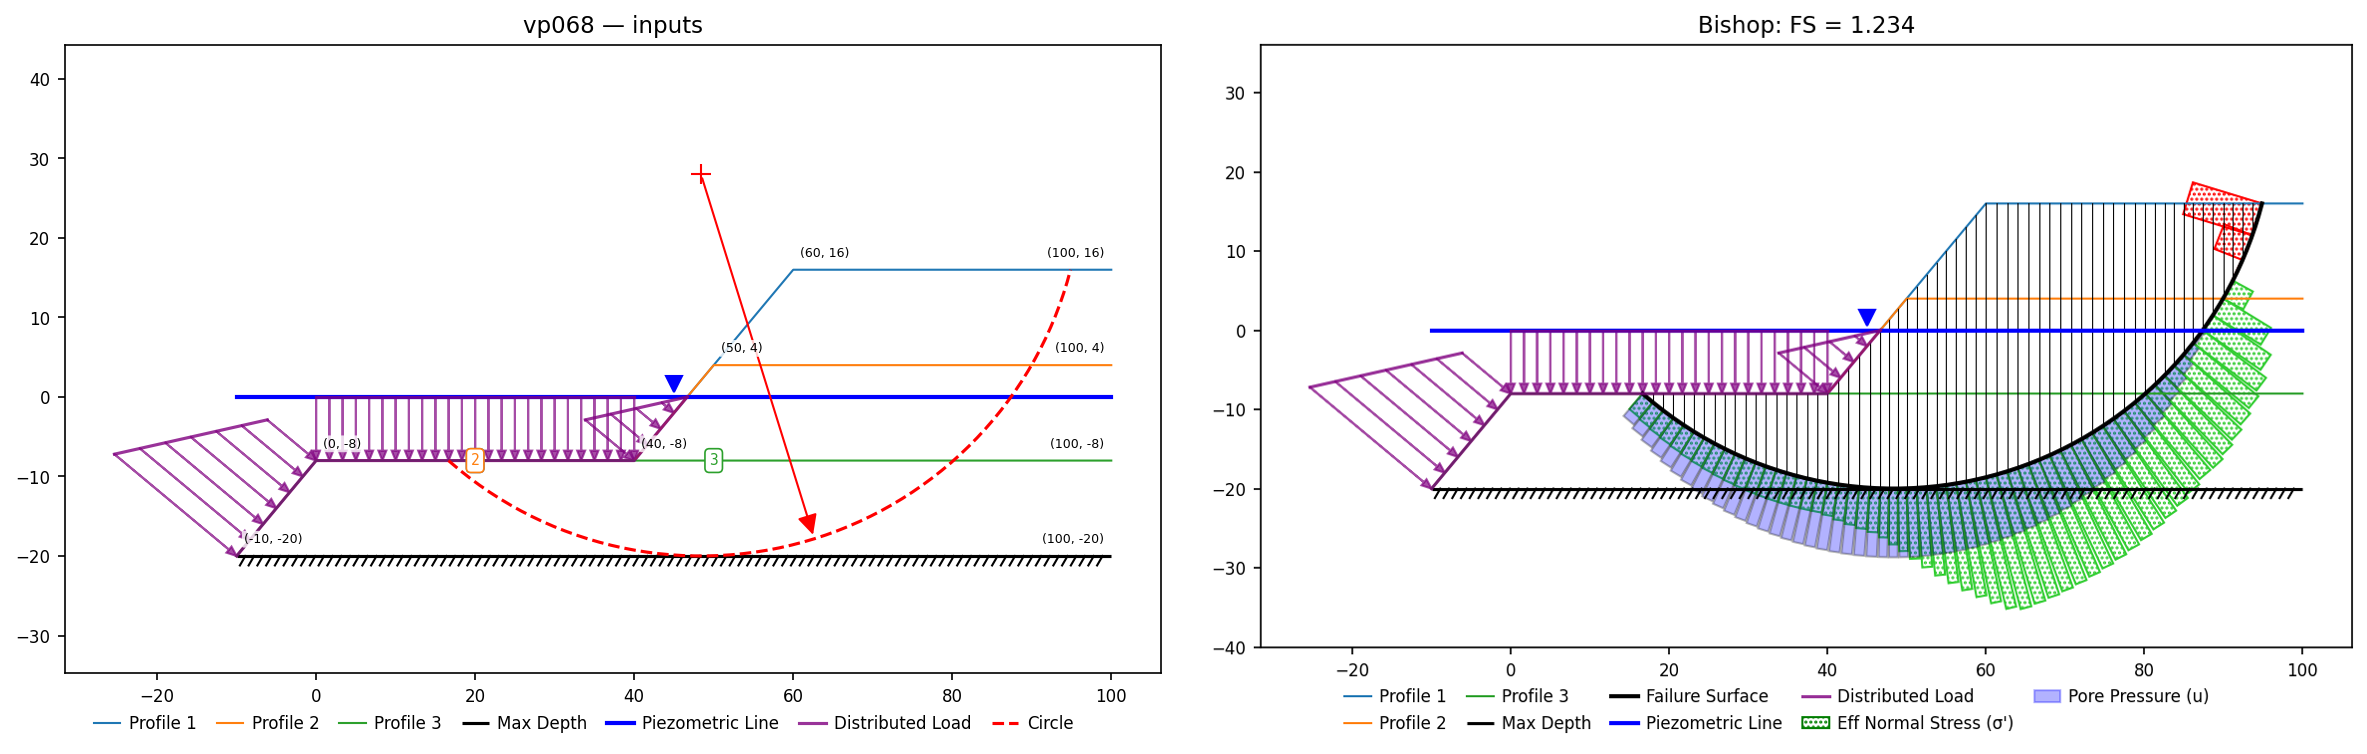
VP69: Steady-seepage dam with a piezometric line (USACE example F-6)
Slide #69 / USACE EM 1110-2-1902 example F-6: a 112-ft embankment (c' = 0, φ' = 34°, γ = 130 pcf) on a granular foundation (c' = 0, φ' = 35°, γ = 125 pcf) under steady seepage. Pore pressures come from the piezometric line, which leaves the pool surface at el. 100, drops to the chimney drain, follows it down to the tailwater elevation (el. 22.5) and then runs out flat to the downstream face. USACE computes u as γw times the vertical distance from the slice base to that line, so it is a plain piezometric line — the phreatic (cos²θ) flag is off. The tailwater ponds the toe from x = 337.4 rightward. Specified circle: center (269, 248), R = 280 — 131 ft left of and 248 ft above the toe, bottoming out exactly on USACE's el. −32 stratum line.
Input files: vp069.xlsx
| Method | XSLOPE | Published |
|---|---|---|
| Bishop | 1.999 | Slide 2.011; USACE 2.01 |
| Spencer | 2.013 | Slide 2.026 |
| Morgenstern-Price | 2.013 | Slide GLE 2.027 |
Slide's Figure 69.1 carries axis ticks and vertex markers, so the section was recovered exactly rather than estimated: ground (0,100)–(38.4,100)–(60.8,112)–(81,112)–(194.9,73.7)–(400,0)–(450,0). The rip-rap, chimney drain and drainage blanket are given the embankment properties, as USACE does — the circle misses all three. The uniform −0.6% offset is the residual of the piezometric-line kink, which the figure locates only to about a foot.
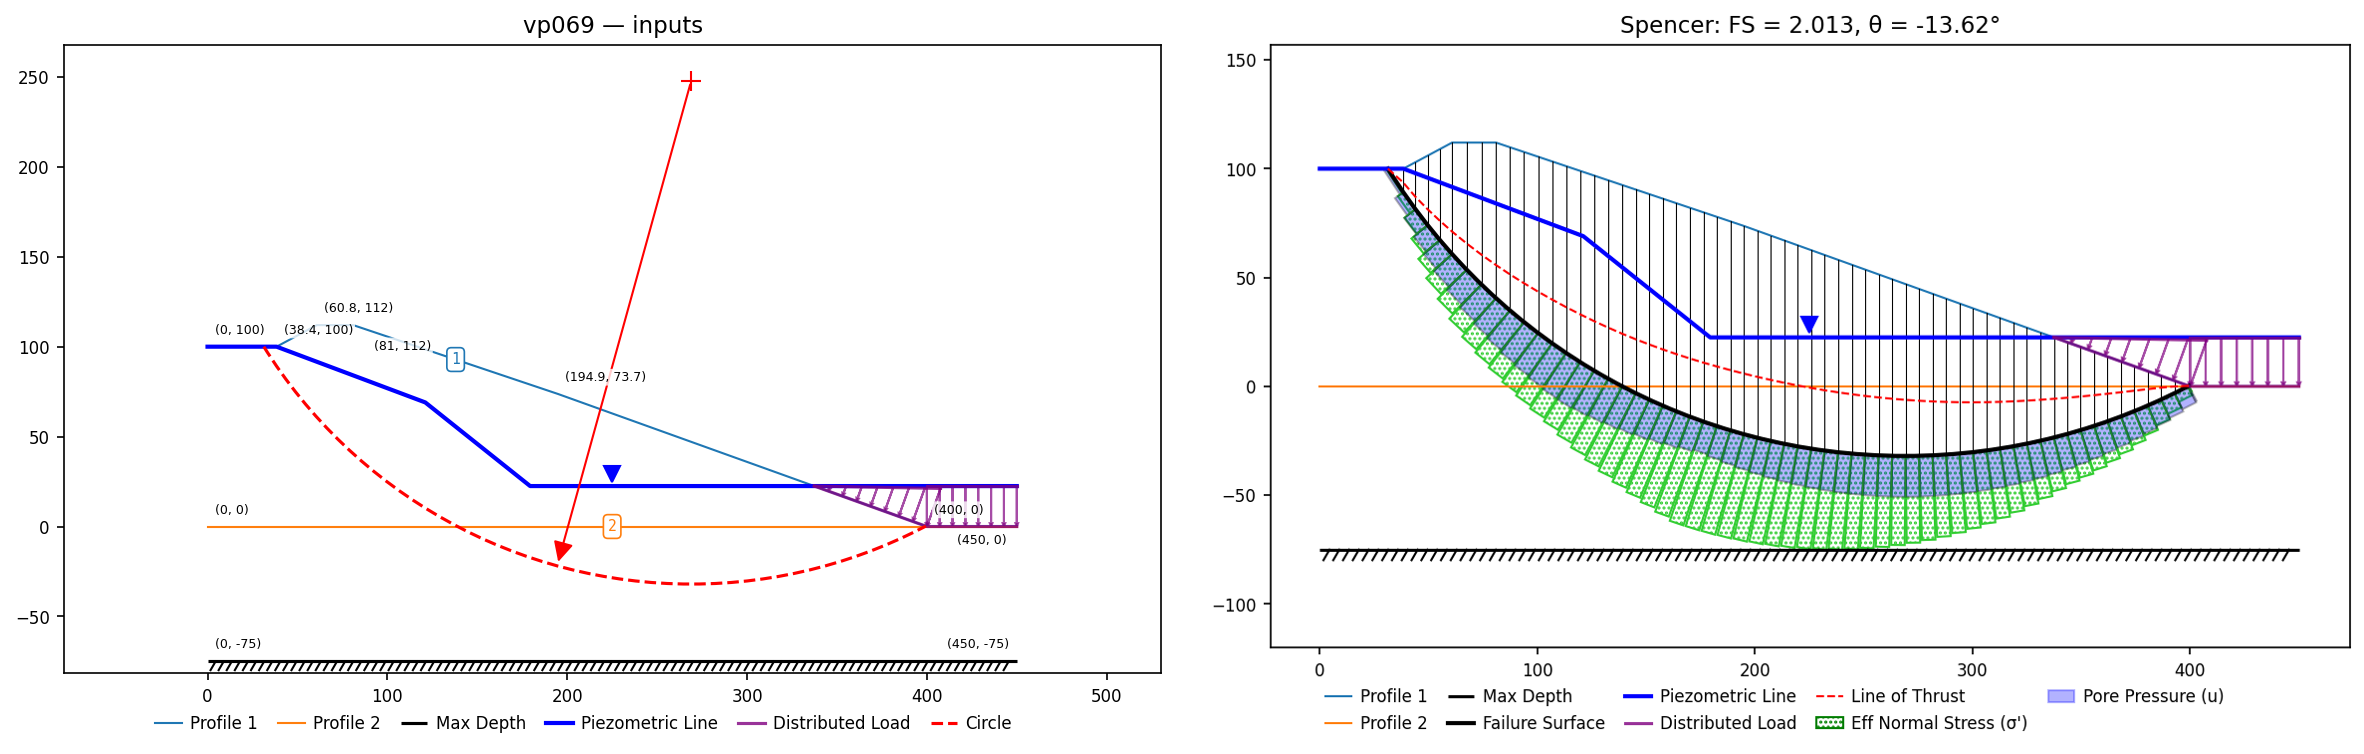
VP70: Submerged slope, two pool depths (D&W Fig. 6.27)
Slide #70 / Duncan & Wright (2005) Fig. 6.27: a fully submerged homogeneous slope (c = 100 psf, φ = 20°, γ = 128 pcf; (0,15)–(30,15)–(105,45)–(140,45)) analyzed with the pool 30 ft and then 60 ft above the crest. The point of the example is that the factor of safety is independent of the submergence depth — the extra water weight and the extra pore pressure cancel. Pond loads applied over the whole submerged surface; free circular search.
Input files: vp070a.xlsx, vp070b.xlsx
| Case | Method | XSLOPE | Published |
|---|---|---|---|
| pool +30 ft | Bishop / Spencer | 1.596 / 1.593 | Slide 1.603 / 1.599; D&W 1.60 |
| pool +60 ft | Bishop / Spencer | 1.596 / 1.593 | Slide 1.603 / 1.599; D&W 1.60 |
xslope reproduces the depth-independence exactly (identical FS at both pools) — a direct check on the consistency of the pond-load and pore-pressure treatments.
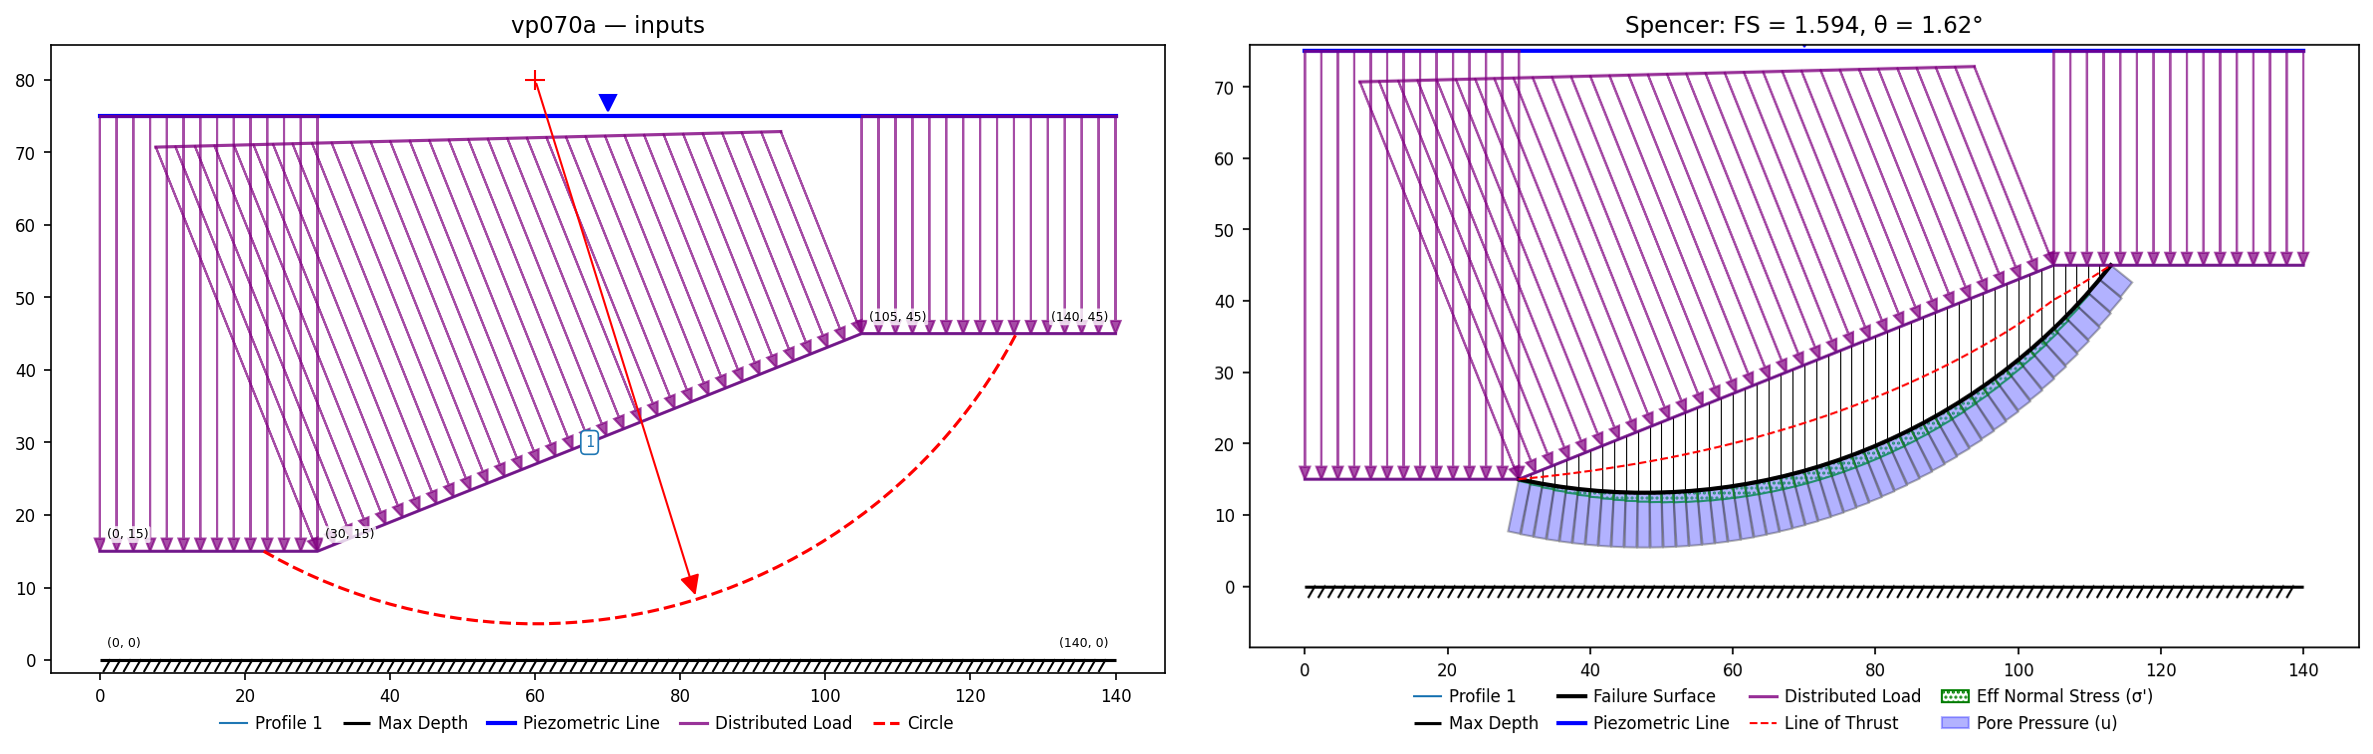
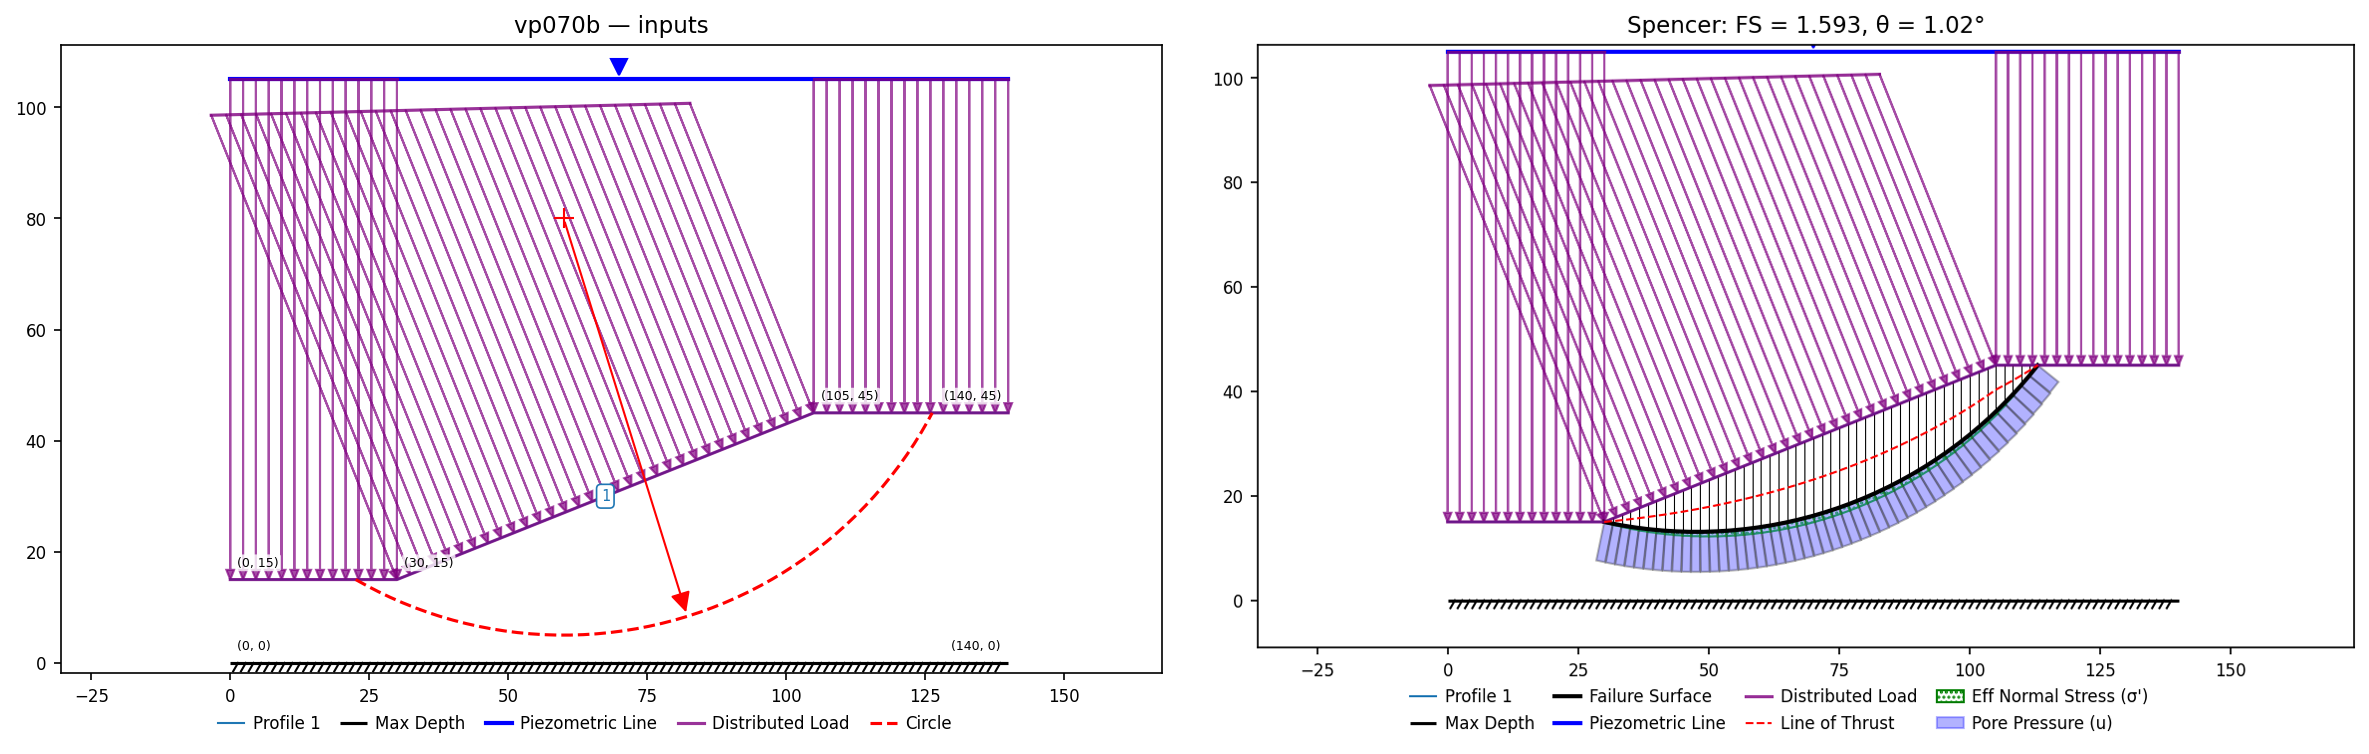
VP71: FE seepage vs. piezometric line, same slope (D&W Figs. 6.37–6.38)
Slide #71 / Duncan & Wright (2005) Figs. 6.37 and 6.38: a homogeneous 2H:1V slope (c' = 200 psf, φ' = 20°, γ = 125 pcf; ground (0,40)–(120,40)–(200,80)–(440,80) over a base at el. 0) with water standing at el. 40 on the toe side and el. 75 behind the crest. The point of the example is that the same slope is solved two ways — pore pressures from a finite-element seepage analysis, and pore pressures from a piezometric line — and the two must agree.
Case 1 runs XSLOPE's own FE seepage solver on the section (specified heads of 40 and 75 on the two vertical boundaries, the ground surface an exit face), exports the nodal pore pressures, and feeds them to the limit-equilibrium search through u = 'seep'. Case 2 uses the piezometric line read off Slide's Figure 71.2. Free circular search in both cases.
Input files: vp071a.xlsx (FE seepage), vp071b.xlsx (piezometric line)
| Case | Method | XSLOPE | Published |
|---|---|---|---|
| FE seepage | Bishop / Spencer | 1.132 / 1.132 | Slide 1.141 / 1.141; D&W 1.138 |
| Piezometric line | Bishop / Spencer | 1.132 / 1.132 | Slide 1.142 / 1.142; D&W 1.141 |
The two pore-pressure models land within 0.0006 of each other — the same near-identity Slide reports (1.141 vs 1.142). This is the corpus's end-to-end check on the seepage → limit-equilibrium handoff: XSLOPE's phreatic surface, computed from scratch, reproduces the one Duncan & Wright drew.
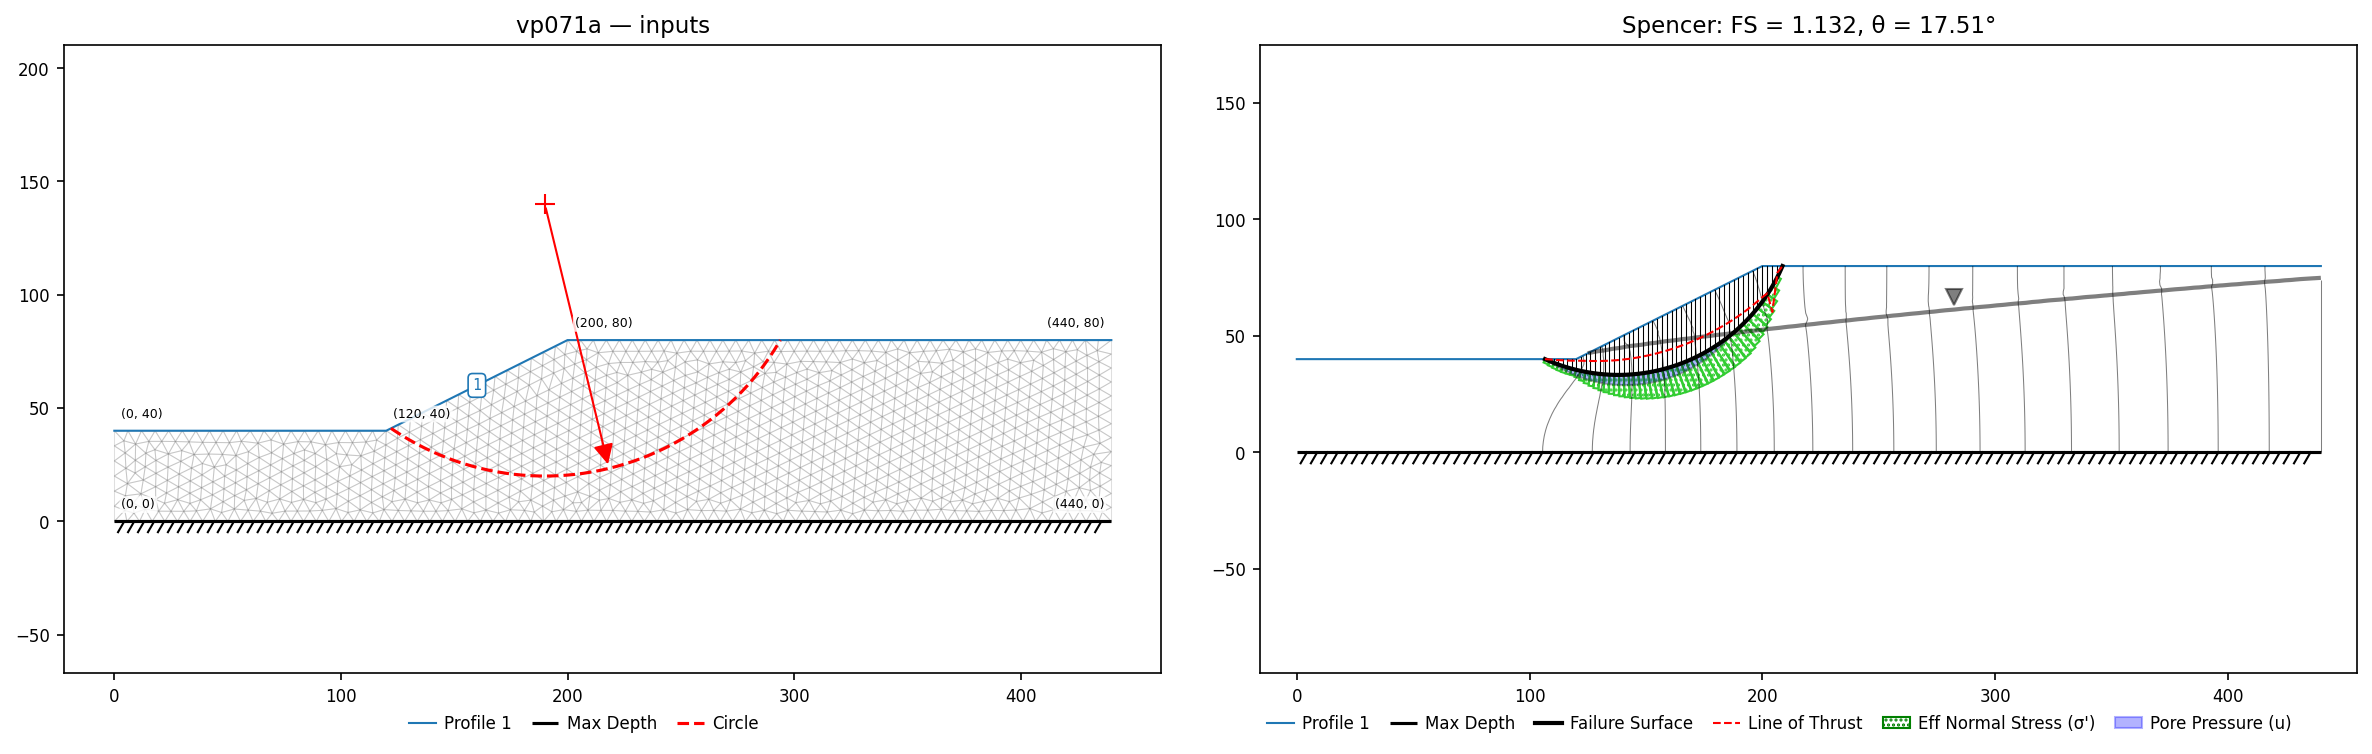
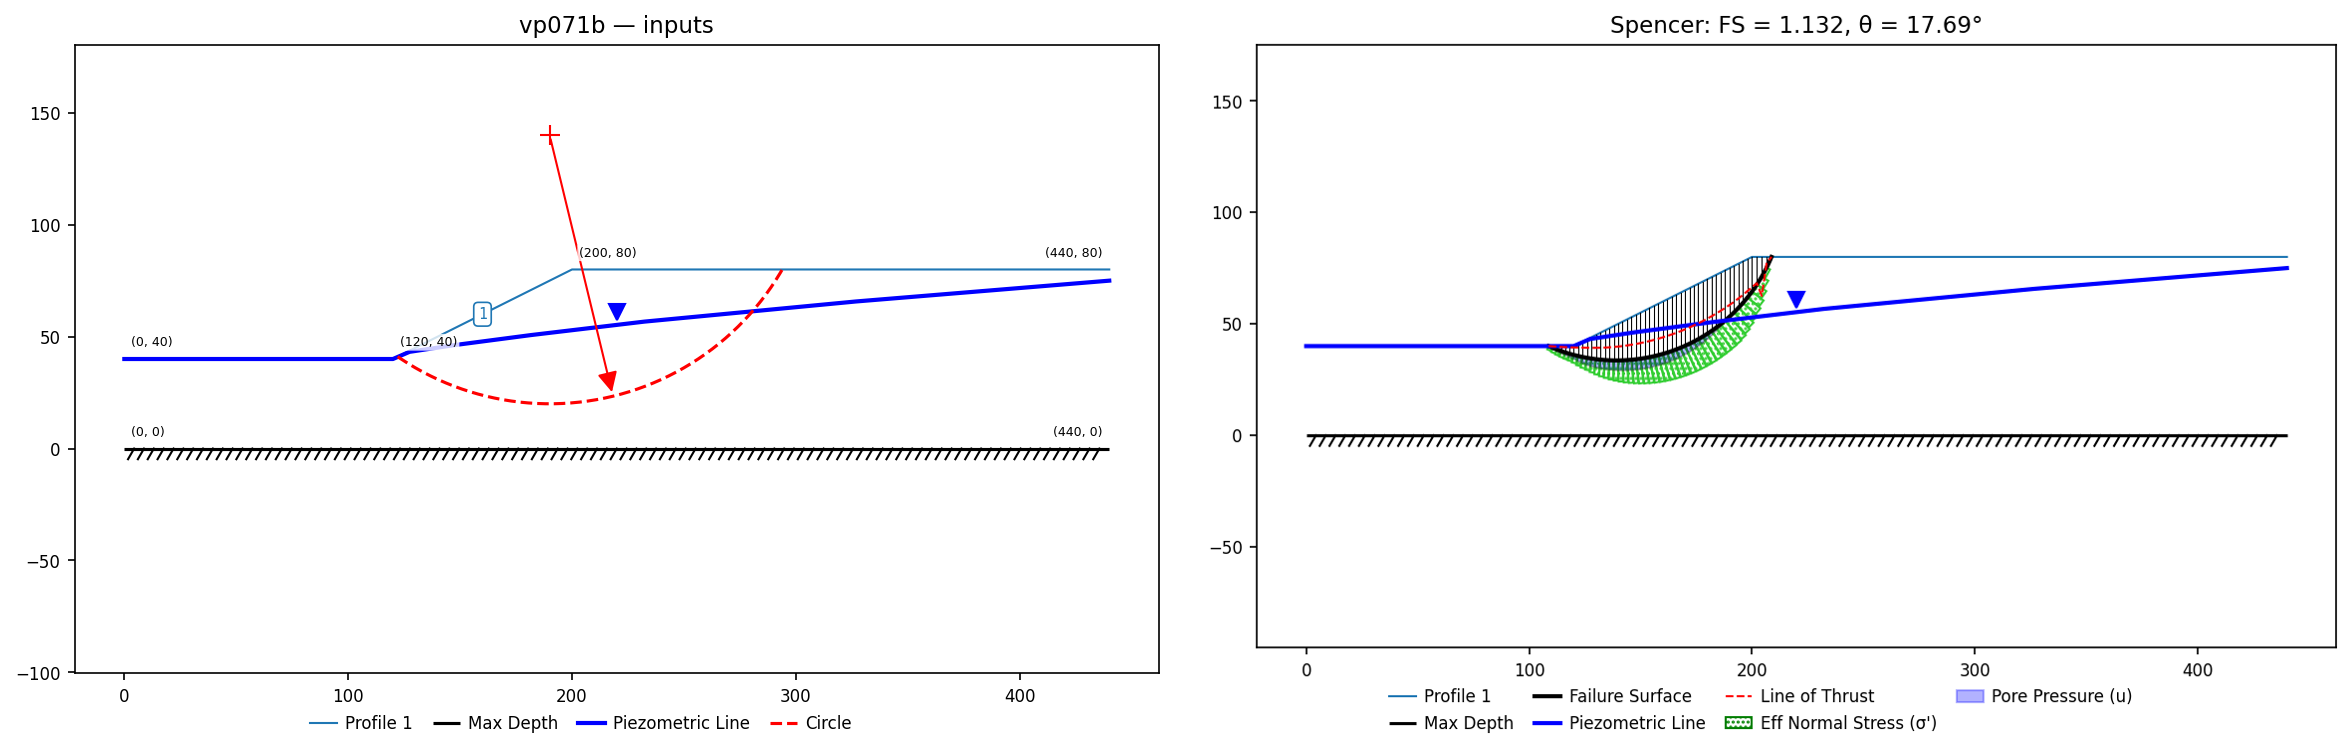
VP72: Dam on a layered foundation — underseepage and artesian uplift (D&W Fig. 6.39)
Slide #72 / Duncan & Wright (2005) Figs. 6.39–6.40: a symmetric embankment dam (3:1 shell faces, 90 ft high, narrow 0.5H:1V clay core) on a layered foundation — 30 ft of clay over 15 ft of much more permeable sand — with pond at el. 302 and tailwater at the downstream ground. Elevations, slopes and properties come from D&W's figure; x-coordinates from vertex extraction of Slide's Figure 72.1, self-consistent with D&W's slopes to 0.5 ft. The physics D&W built this example around: underseepage through the sand produces upward flow beneath the downstream shell, and a single piezometric line cannot represent it — their FS with FE pore pressures is 14–19% lower than with the piezo line. One modelling detail matters enormously: Slide's BC markers (zoomed) show no-flow vertical edges — the heads sit on the ground surface only, forcing all underseepage up through the clay. Giving the sand a fixed-head exit at the model edge guts the artesian pressures and reads ~13% high; XSLOPE's FE solution with the correct BCs shows u at the toe 40% above hydrostatic, and 65% at 5 ft depth.
Pore pressures both ways, as in the manual: FE seepage (XSLOPE's own solver, tri3, converged in 29 iterations) and Slide's piezometric line (vertex-extracted from Figure 72.2; the pond/face point measures (385.8, 301.3) against the geometric (385, 302)). This dam is also LEM sample problem 8, built independently from the book: its piezometric line agrees with the Slide-figure trace within a few feet, and its downstream deep criticals (Bishop 1.561 / Spencer 1.558) sit within ~1% of Slide's tangent-197 values — though the corpus file follows Slide's slightly different crest and core-top dimensions (45-ft crest, core top el. 312) rather than the book's (50 ft, el. 307), since Slide's published numbers are the benchmark here.
Input files: vp072a.xlsx (FE seepage), vp072b.xlsx (piezometric line)
| Method | XSLOPE FE seepage, tan. 197 | Slide FE seepage | XSLOPE piezo line, tan. 197 | Slide piezo line |
|---|---|---|---|---|
| Bishop | 1.339 | 1.312 | 1.572 | 1.563 |
| Spencer | 1.341 | 1.312 | 1.562 | 1.557 |
| D&W reference | — | 1.37 | — | 1.57 |
The tagged benchmarks are the circles tangent to el. 197 (bottom of the foundation clay) — D&W's own reported case, well-posed and reproducible; XSLOPE's constrained-sweep criticals are stored in the input files. The piezo case agrees with Slide to 0.6%; the FE case (1.34) sits inside the D&W–Slide spread (1.31–1.37). The global critical (Slide FE 1.149 / piezo 1.306) is deliberately not tagged: it is a shallow toe slough driven by the artesian exit gradient, and its factor of safety depends on the minimum admissible surface size — XSLOPE reads 1.28 on a 40-ft-radius slough and 0.87 on a 4-ft sliver at the singular toe point, and Slide does not print its critical surface. The 0.87 is itself physically meaningful: the FE solution predicts local heave marginality at the toe, which is why D&W's global value (1.11) barely exceeds 1.
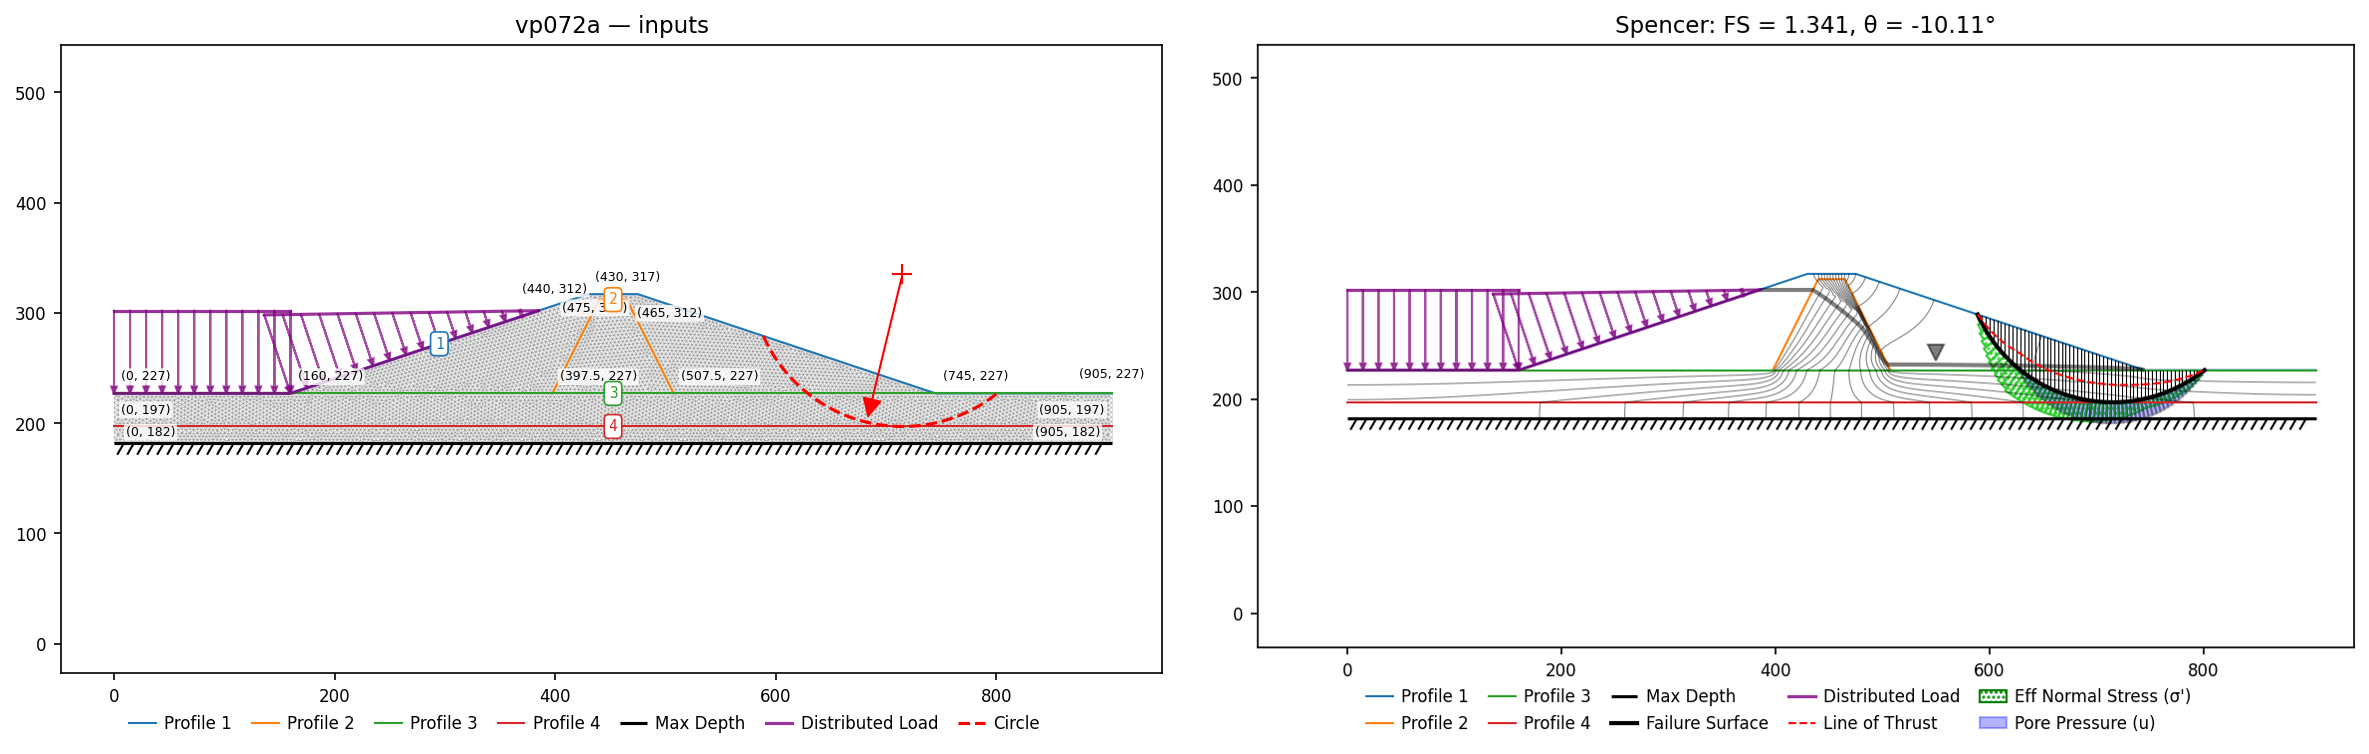
The piezometric-line case for comparison (Slide's line from Figure 72.2, with its tangent-197 critical):
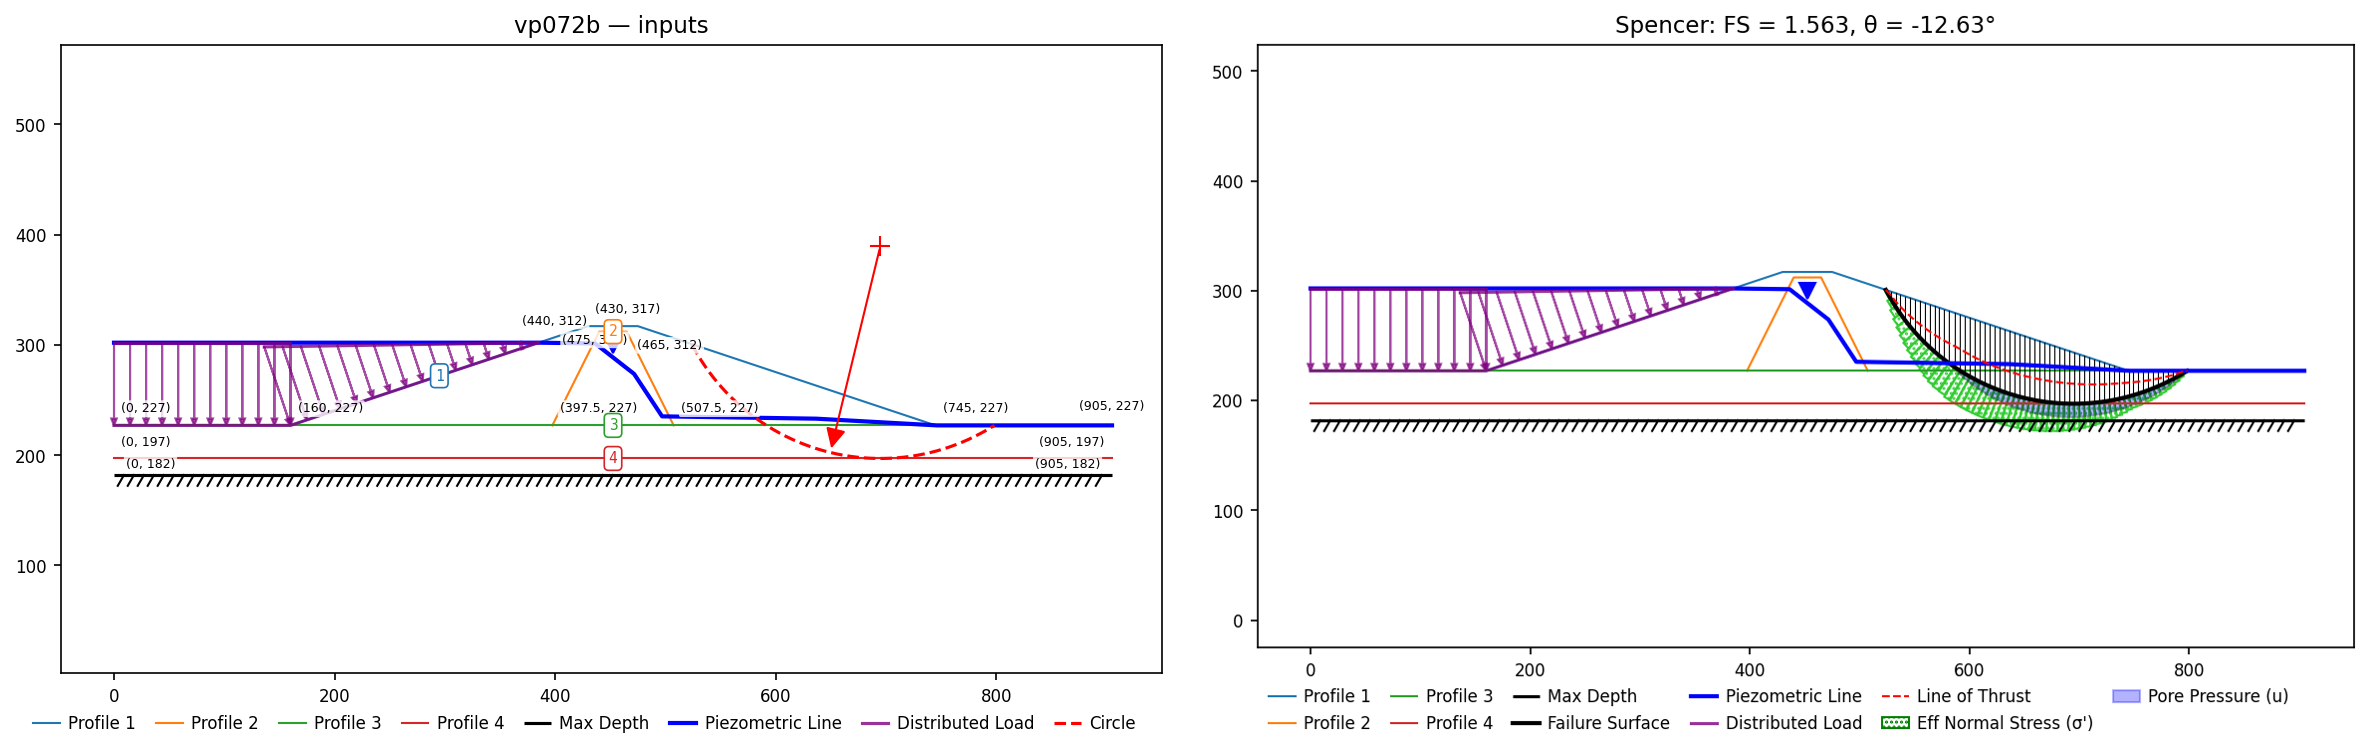
VP73: The Bradwell excavated slope (Skempton & LaRochelle 1965)
Slide #73 / Duncan & Wright (2005): the excavated slope for reactor 1 at Bradwell — one of the classic case histories of short-term failure in stiff-fissured clay. The lower excavation is cut at ½:1 in London Clay; the overlying Marsh Clay and the clay fill (spoil, placed back on the Marsh Clay) are both at 1:1. The fill is cracked to its full depth (11.4 ft).
London Clay is stratified into six sublayers, each with an undrained strength that grows linearly with depth, Su = cz + (yz − y)·Δcz. That is precisely XSLOPE's cp option, so the six rows of Slide's Table 73.2 map straight onto six materials — with the two upper units (clay fill, Marsh Clay) that makes eight. Free circular search.
Input files: vp073.xlsx
| Method | XSLOPE | Published |
|---|---|---|
| Bishop | 1.766 | Slide 1.762; D&W 1.76 |
| Spencer | 1.766 | Slide 1.758; D&W 1.76 |
| Janbu (corrected) | 1.733 | Slide 1.736; D&W 1.74 |
Every method within 0.5% — the tightest agreement of the Duncan & Wright group, and a good check that the stratified cp profile and the full-depth tension crack compose correctly.
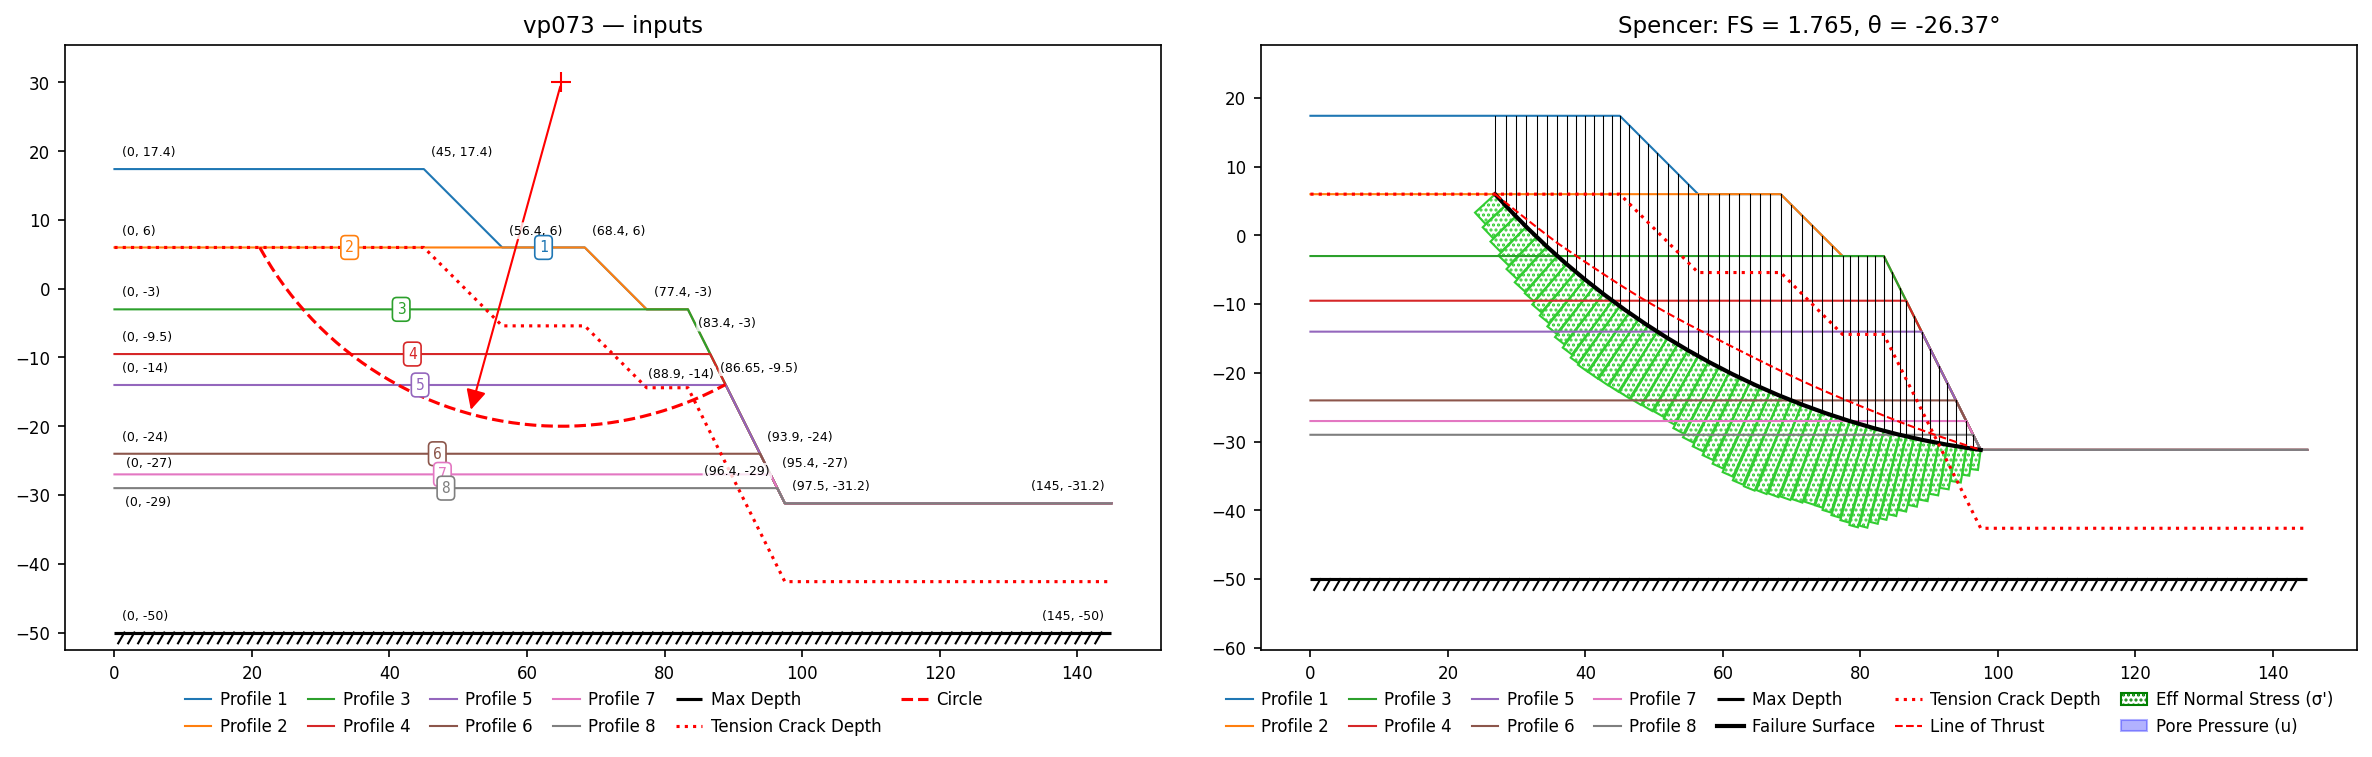
VP74: Sand embankment on saturated clay (D&W Fig. 7.12)
Slide #74 / Duncan & Wright (2005) Fig. 7.12: a 100-ft cohesionless embankment (c=0, φ=40°, γ=140 pcf) on a 50-ft saturated clay foundation (c=2500 psf, φ=0); fully labeled figure, imperial units, dry. Free circular search.
Input files: vp074.xlsx
| Method | XSLOPE (search) | Published |
|---|---|---|
| Bishop | 1.219 | Slide 1.228; D&W 1.22 |
| Spencer | 1.194 | Slide 1.201; D&W 1.19 |
| Janbu (corrected) | 1.161 | Slide corrected 1.174 (simplified 1.079; D&W 1.07) |
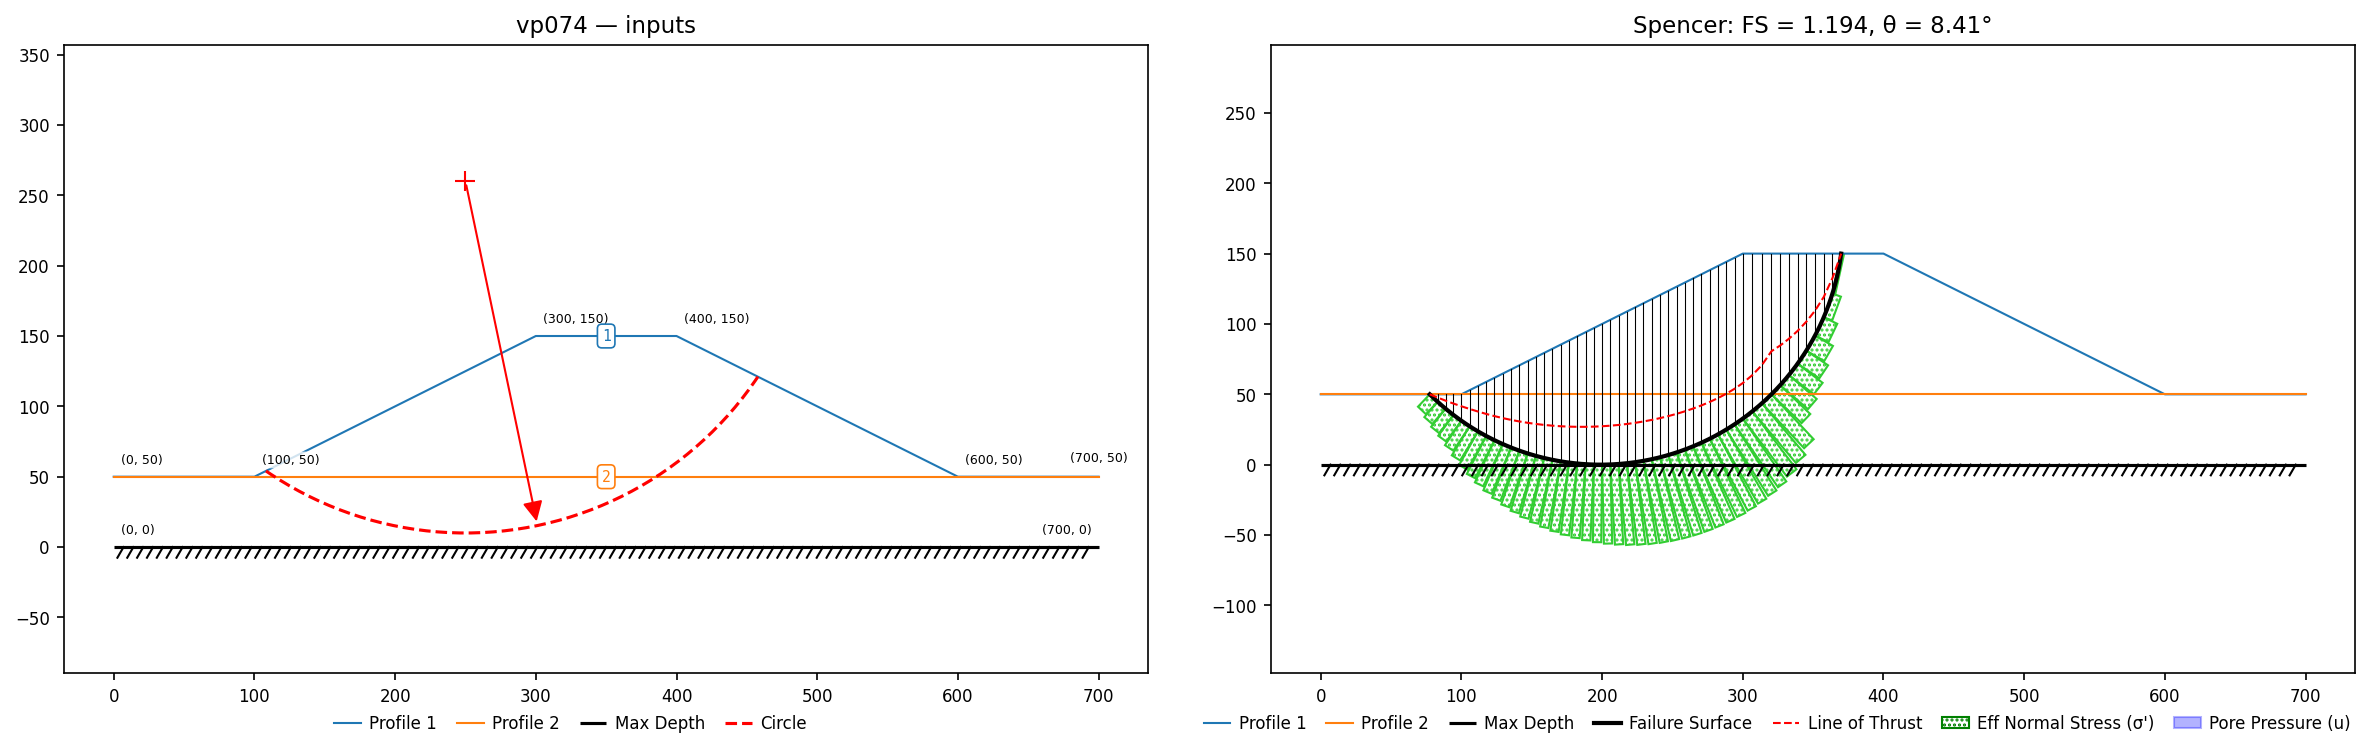
VP75: The James Bay dyke (D&W Fig. 7.16)
Slide #75 / Duncan & Wright (2005) Fig. 7.16: one of the planned James Bay dykes — a granular fill embankment with a wide berm (ground (−17,31)–(40,31)–(58,25)–(114,25)–(132,19)–(168,19), metric) resting on three soft clay units: a 4 m crust (c = 41 kN/m²), 8 m of marine clay (34.5) and 7 m of lacustrine clay (31.2), all φ = 0. Fill c' = 0, φ' = 30°. Free circular search.
Input files: vp075.xlsx
| Method | XSLOPE (search) | XSLOPE on Slide's circle | Published |
|---|---|---|---|
| Bishop | 1.424 | 1.438 | D&W 1.45; Slide 1.468 |
| Spencer | 1.420 | 1.436 | Slide 1.464 |
The critical surface is a deep circle tangent to the base of the lacustrine clay, cutting all three foundation units. Two notes. First, this problem is the corpus's local-minimum showcase: from a single shallow seed the 9-point descent settles into a local minimum up in the fill at FS 1.74 — converged, plausible-looking, and 23% high with no warning — so the input file carries three seeds spanning shallow to deep. Grid seeding (seed='grid') removes the trap entirely: with the circles sheet ignored it finds Spencer 1.420 on its own, and it is regression-locked here alongside the seeded search. Second, on Slide's own printed critical circle (center (89.28, 139.38), R = 139.37) XSLOPE gives 1.438 against Slide's 1.468; XSLOPE and Slide bracket Duncan & Wright's 1.45 from either side.
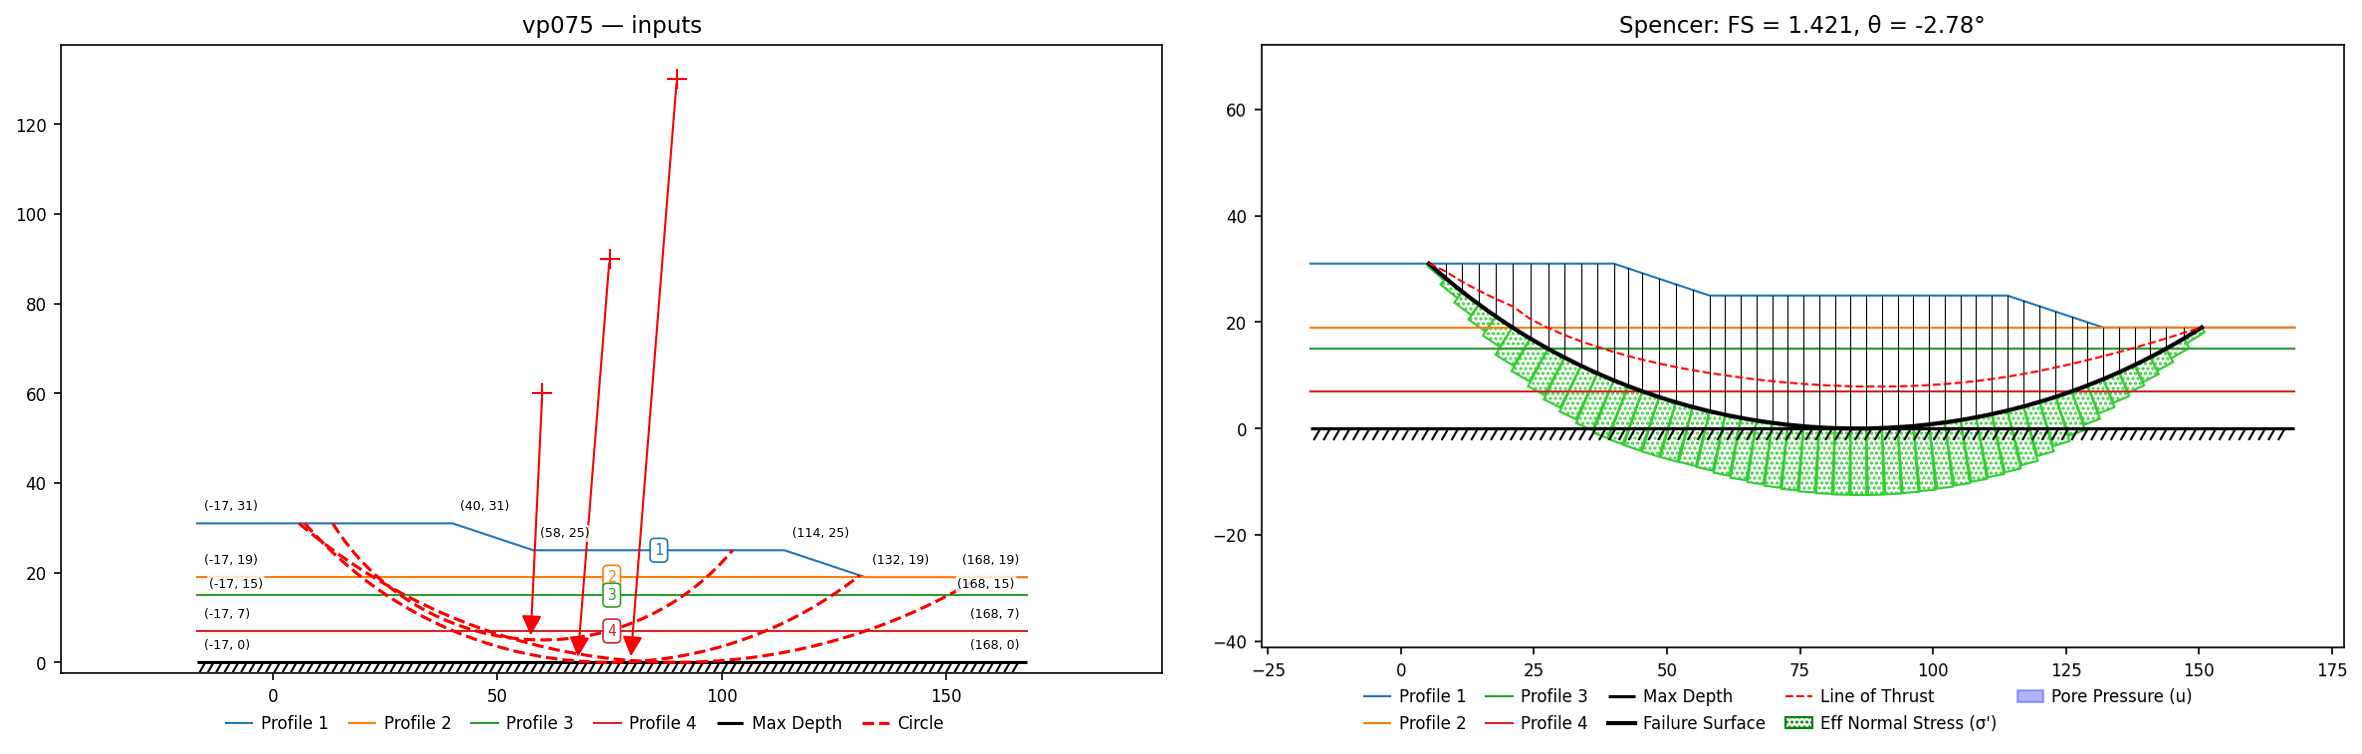
VP76: Homogeneous dam, FE seepage vs. piezometric line (D&W Fig. 7.19)
Slide #76 / Duncan & Wright (2005) Fig. 7.19: a homogeneous earth embankment (c' = 100 psf, φ' = 30°, γ = 100 pcf) on an impermeable foundation, ground (0,0)–(100,40)–(120,48)–(135,48)–(255,0), with the pool at el. 40 covering the entire upstream face. As in VP71, pore pressures are modelled two ways — an FE seepage analysis and a piezometric line — and the critical circle is found by free search.
Input files: vp076a.xlsx (FE seepage), vp076b.xlsx (piezometric line)
| Case | Method | XSLOPE | Published |
|---|---|---|---|
| FE seepage | Bishop / Spencer | 1.065 / 1.072 | Slide 1.068 / 1.075; D&W 1.19 & 1.08 (chart) |
| Piezometric line | Bishop / Spencer | 1.049 / 1.056 | Slide 1.090 / 1.100; D&W 1.16 |
The FE case lands within 0.6% of Slide, and XSLOPE's computed phreatic surface tracks the piezometric line Slide digitized from Duncan & Wright to better than a foot everywhere. The piezometric case sits 3% low, and the reason is that this particular problem is ill-conditioned: the critical circle is a shallow toe surface where the water table is nearly at the ground, so u/σv ≈ 0.57 and effective stresses are small. Dropping the piezometric line by just ½ ft raises Bishop from 1.049 to 1.118 — 6% of FS per half-foot. The 3% gap is worth only about 0.3 ft of line elevation, which is finer than a raster figure can be read. Duncan & Wright's own reference values (1.19 and 1.08 for the same FE case) show the same spread.
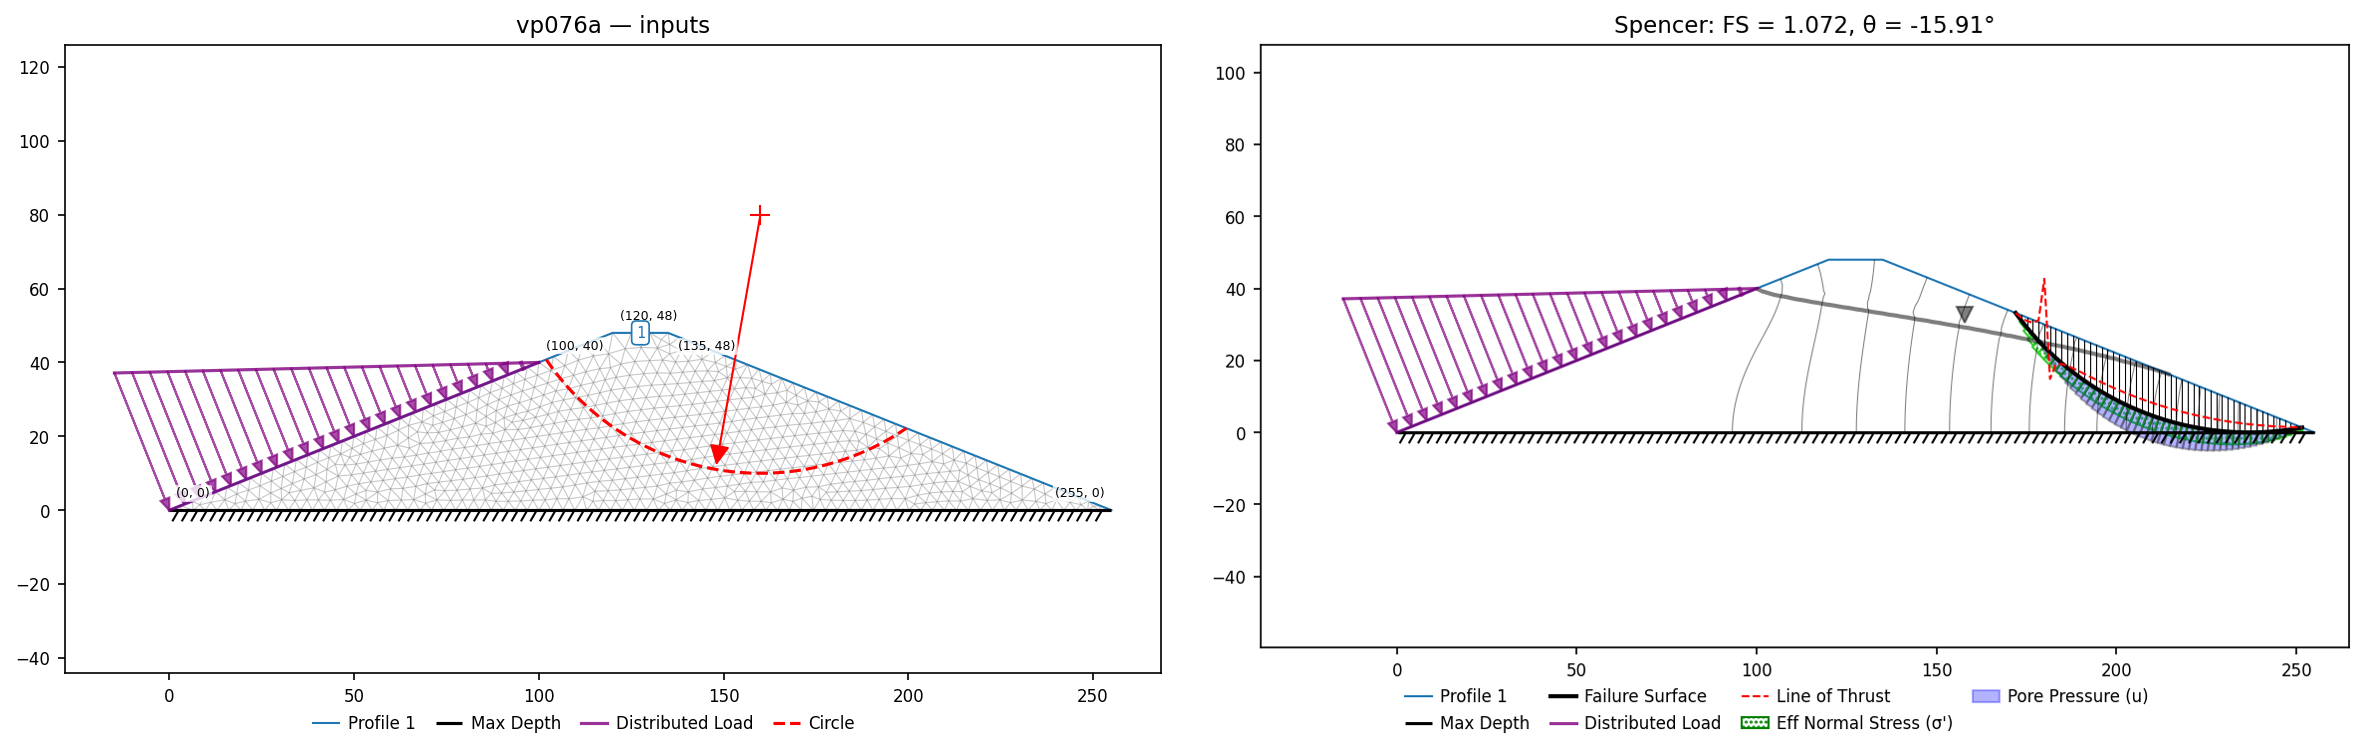
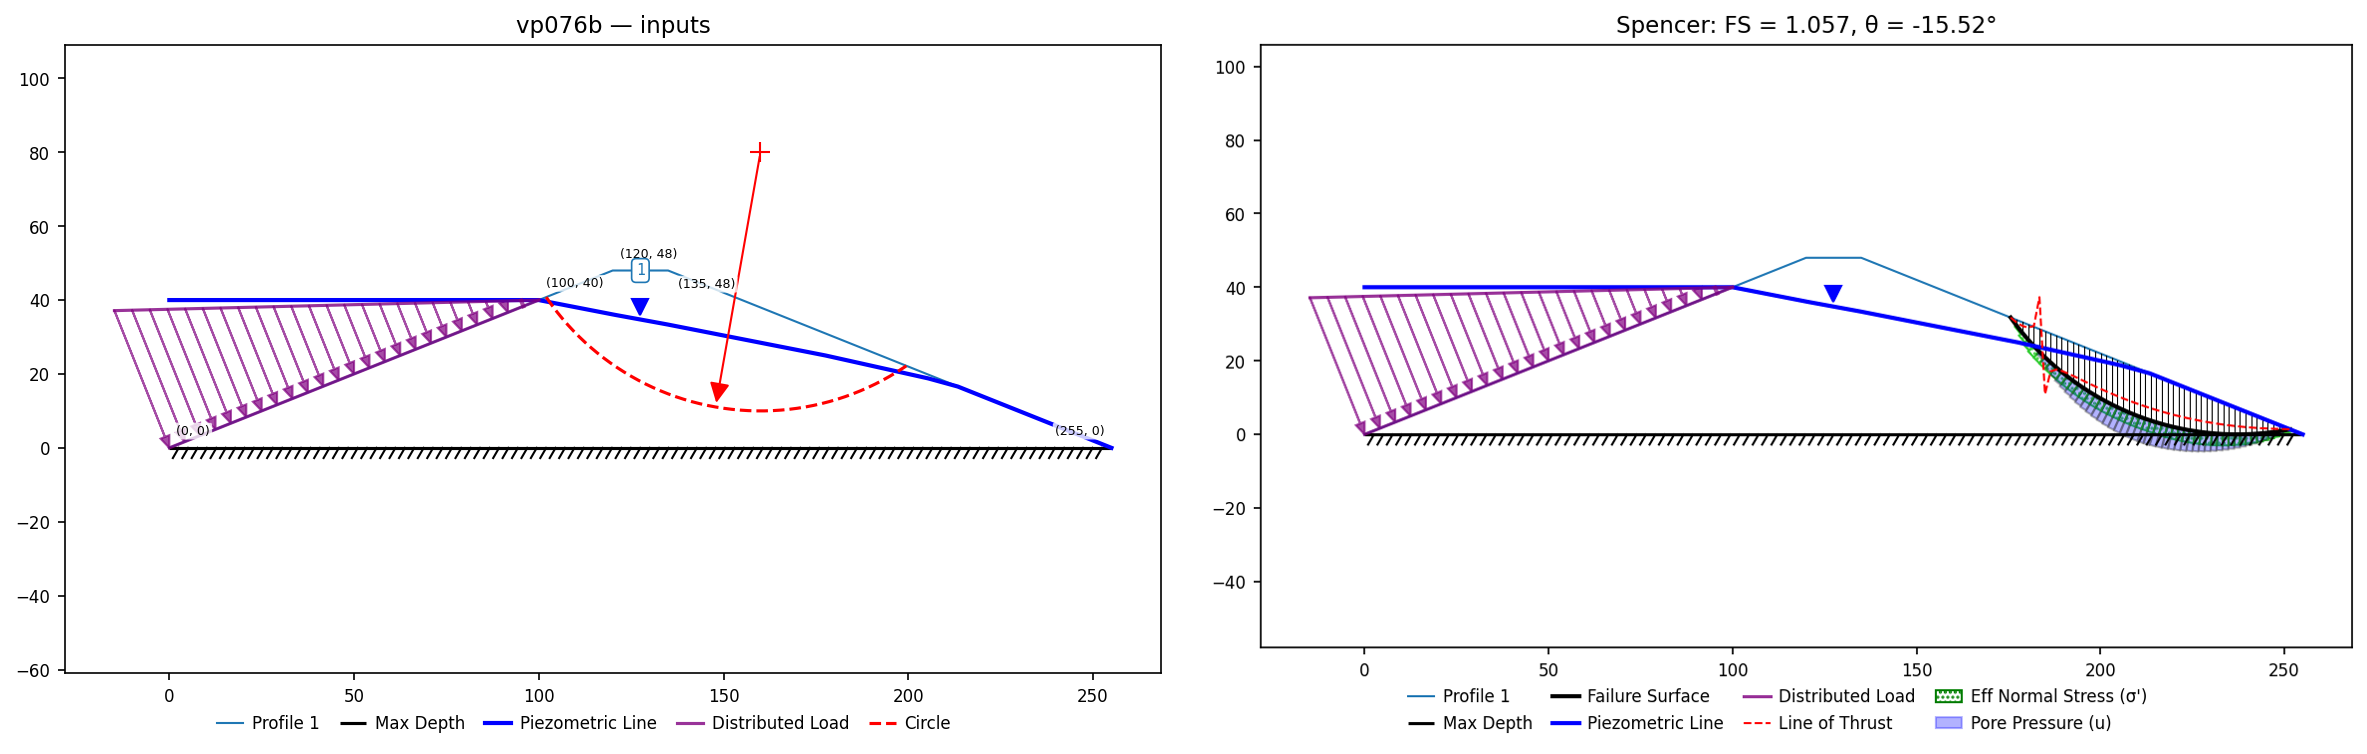
VP77: Thick-core dam, FE seepage vs. piezometric line (D&W Fig. 7.24)
Slide #77 / Duncan & Wright (2005) Fig. 7.24 (Fig. 7.37 in the 2014 edition): a symmetric earth dam with a thick clay core on an impervious foundation, pond at el. 315. Geometry comes from D&W's coordinate-labeled figure — shell faces 2.75:1 to an 80-ft crest at el. 338; the core is a trapezoid with 1.5:1 faces and a 50-ft top at el. 328 (the Slide figure leaves the core-top vertices unlabeled; the core does not reach the crest). Core c' = 0, φ' = 20°, γ = 120 pcf, k = 10⁻⁵ ft/min; shell c' = 0, φ' = 38°, γ = 140 pcf, k = 10⁻³ — a 100:1 contrast. Both zones are cohesionless, so the benchmark targets the deep circle tangent to the base at el. 127; both of Slide's printed criticals bottom at exactly 127.0.
Like VP71 and VP76, pore pressures are modelled two ways. Case 1 runs XSLOPE's own FE seepage (head 315 on the submerged upstream face, exit face downstream, no-flow base): the phreatic surface drops from 312 to 231 across the core and runs near-flat at el. ~134 through the downstream shell, matching D&W's Fig. 7.38. Case 2 uses Slide's piezometric line, extracted from Figure 77.2 by axis-tick-calibrated vertex detection — the affine validates itself on the labeled pond point (measured (517.2, 315.1)), and the detected vertices land exactly on the core's 1.5:1 face at (572, 312) and the downstream 2.75:1 face at (1182, 148), where the line daylights and follows the face to the toe.
Input files: vp077a.xlsx (FE seepage), vp077b.xlsx (piezometric line)
| Method | XSLOPE FE seepage | Slide FE seepage | XSLOPE piezo line | Slide piezo line |
|---|---|---|---|---|
| Bishop | 1.652 (search 1.637) | 1.658 | 1.591 (search 1.566) | 1.584 |
| Spencer | 1.724 (search 1.700) | 1.724 | 1.659 | 1.648 |
| Morgenstern–Price | 1.734 | — | 1.670 | — |
| Ordinary | 1.506 | — | 1.477 | — |
Values on Slide's printed circles (endpoints reproduced to 0.1 ft); the free-search values in parentheses are slightly deeper circles of the same family. D&W's four-program Spencer spread for the FE case is 1.67–1.72 (UTEXAS 1.69, SLIDE 1.70, SLOPE/W 1.67); XSLOPE's 1.724 sits at its top edge, equal to Slide's own manual value. Two numerical notes from the seepage run, both documented in the builder: the unsaturated front width must scale with the dam (h0 = −5 ft ≈ one element; the VP76-style −1 ft is sub-grid here and the fixed-point iteration never converges), and the sidecar is generated on a tri3 mesh because tri6 midside kr sampling oscillates. Spencer reads 1.753/1.737/1.724/1.715 at h0 = −20/−10/−5/−2 — the h0 = −5 choice is the sharpest mesh-resolvable front, not a fit.
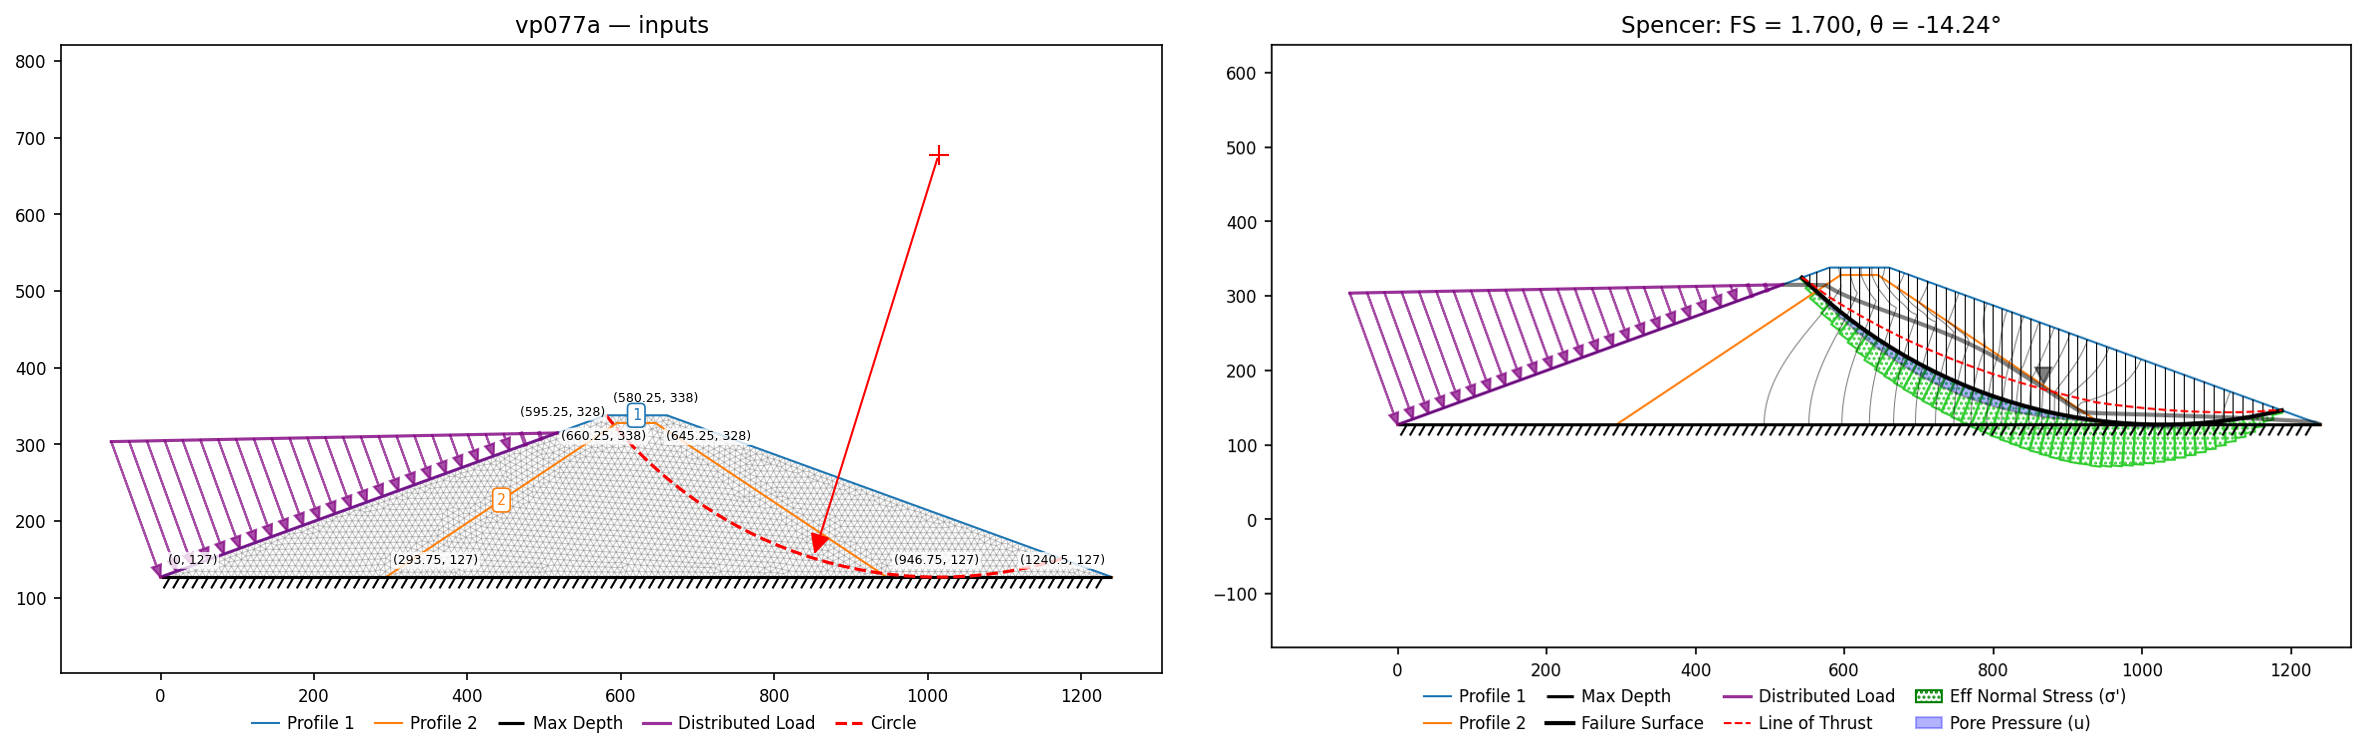
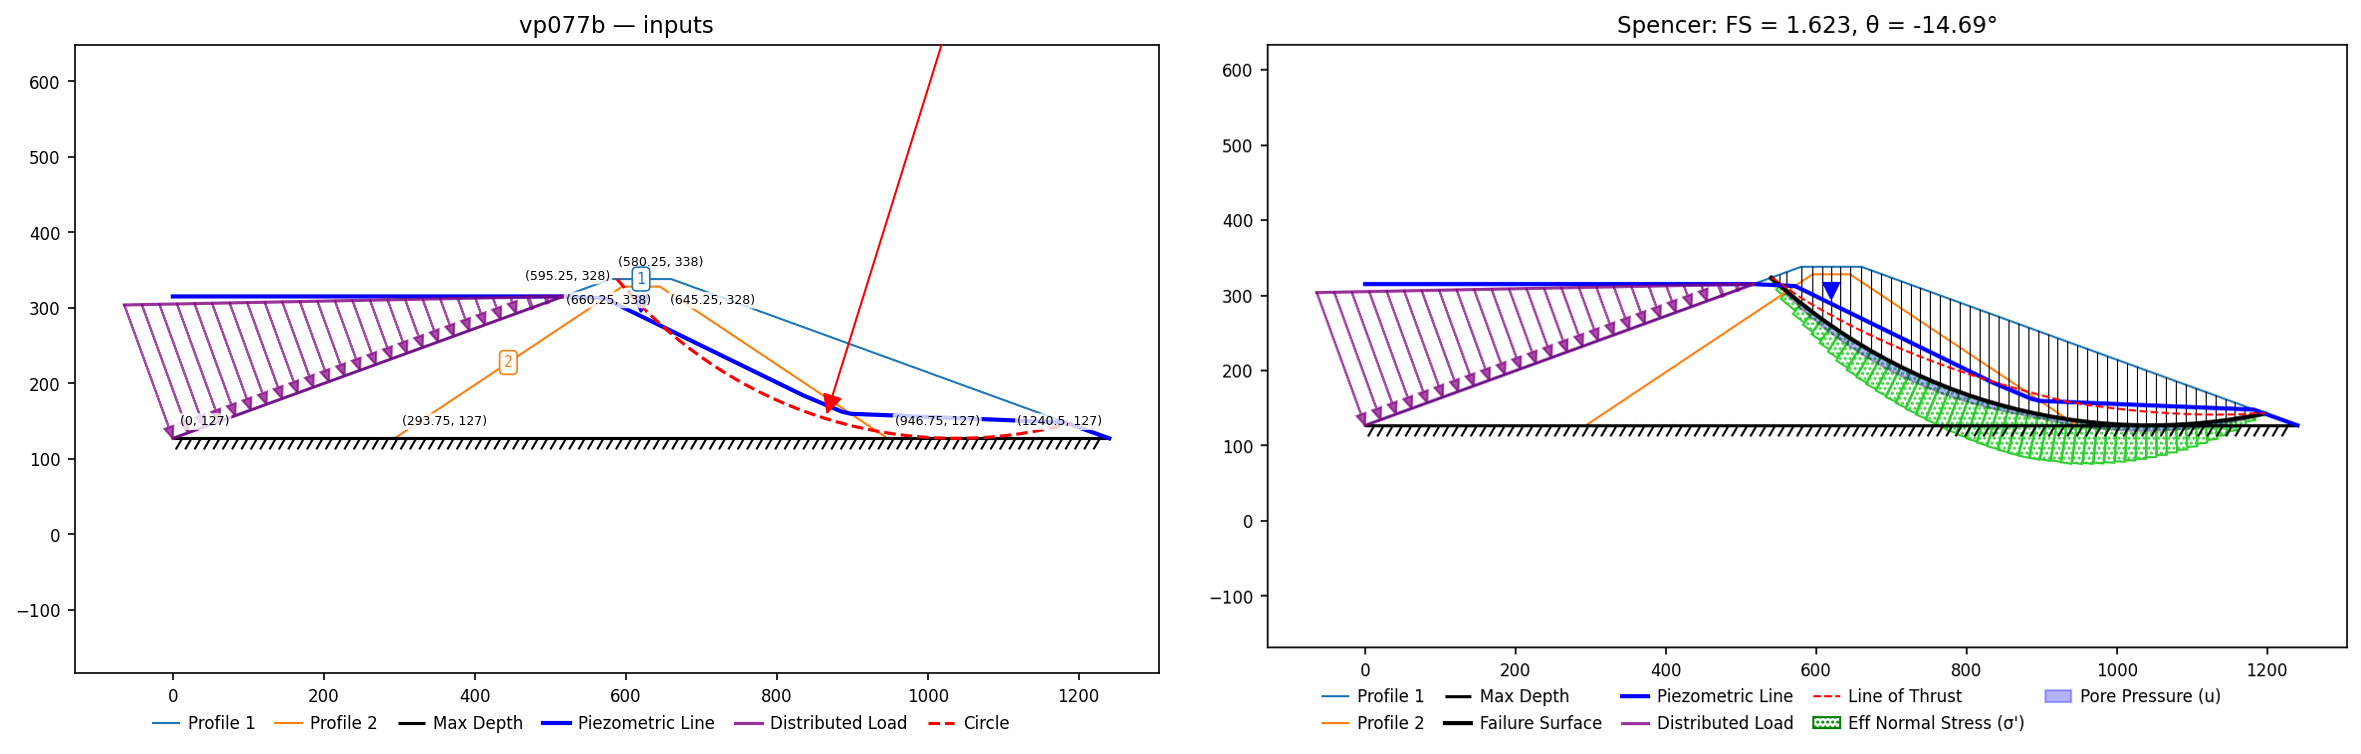
VP78: Pure cohesive slope on a foundation (D&W Fig. 14.3)
Slide #78 / Duncan & Wright (2005) Fig. 14.3: c = 1000 psf, φ = 0, γ = 100 pcf; a 50-ft slope at 1V:0.8H over a 30-ft foundation ((0,30)–(90,30)–(130,80)–(240,80), base at y = 0, all vertices labeled in Slide's figure). For φ = 0 the critical circle is the deep, base-tangent one, which the free search finds directly.
Input files: vp078.xlsx
| Method | XSLOPE (search) | Published |
|---|---|---|
| Bishop | 1.117 | Slide base-tangent 1.141; toe 1.126; D&W 1.124 |
| Spencer | 1.131 | Slide base-tangent 1.139; toe 1.200 |
xslope's free search reaches slightly below Slide's tangent-line-constrained minimum. Slide's toe-circle rows repeat identically for the 46.5-ft and 60-ft foundation variants, so only the 30-ft model is built.
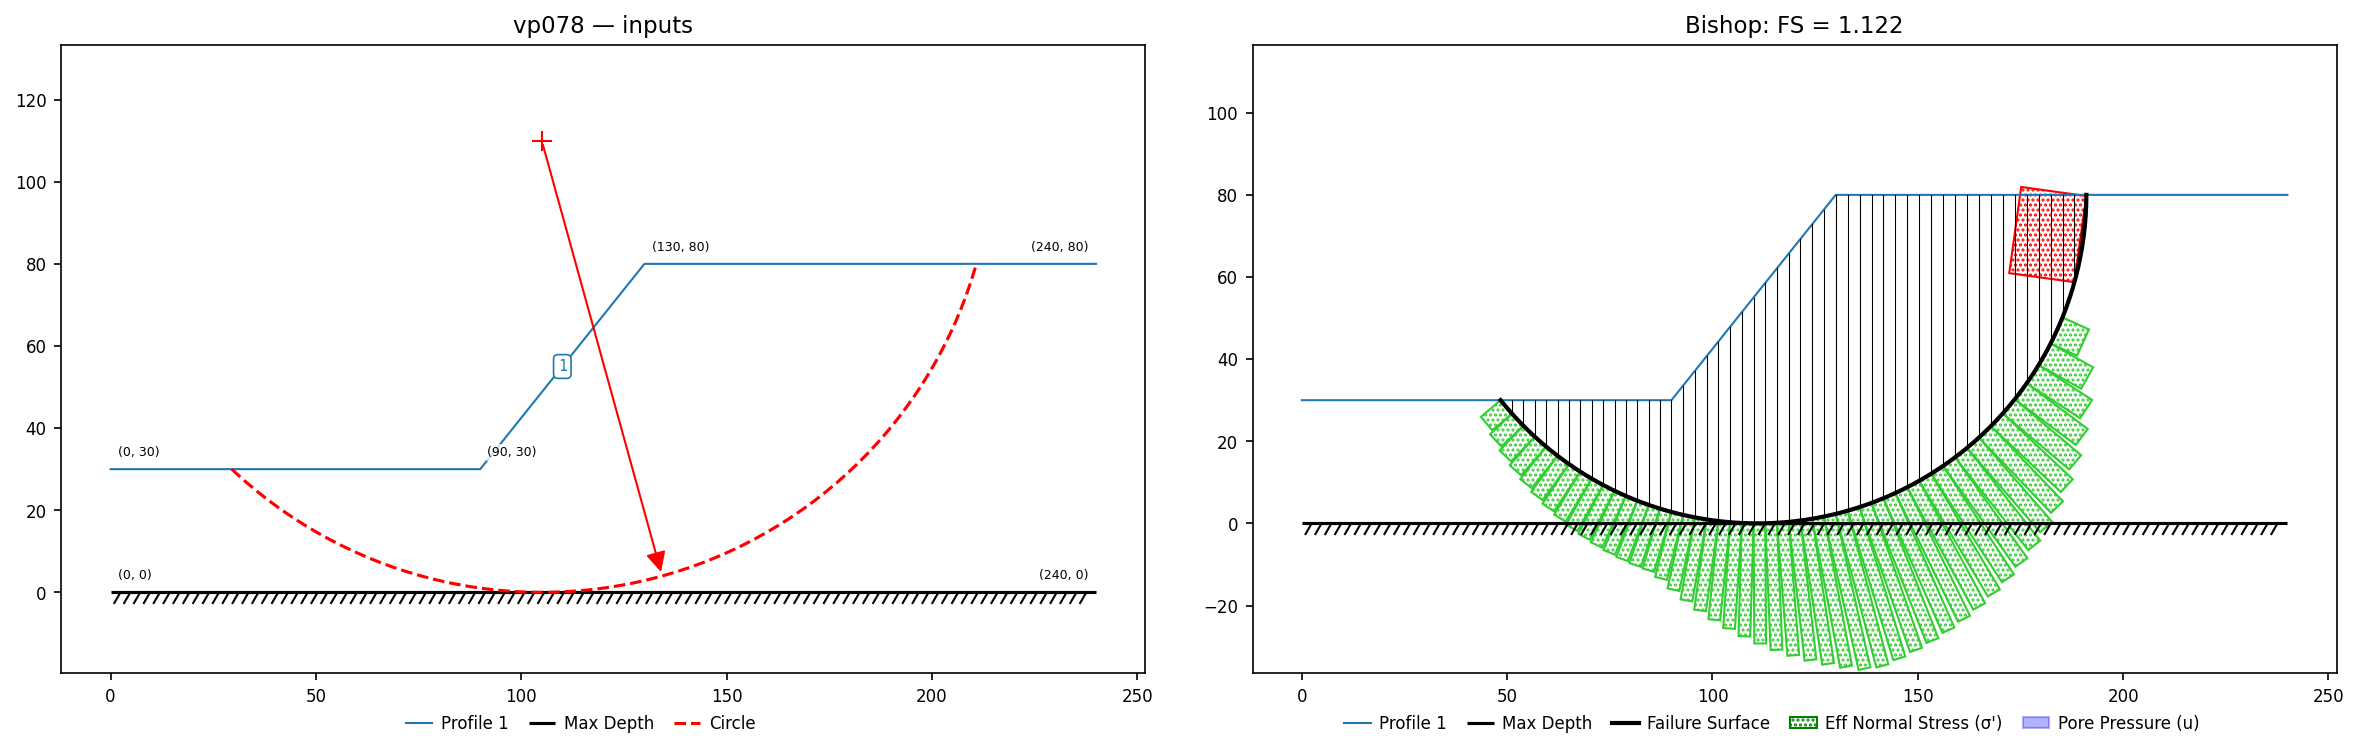
VP79: Cohesionless embankment on a φ=0 foundation (D&W Fig. 14.4)
Slide #79 / Duncan & Wright (2005) Fig. 14.4: a c=0, φ=30°, γ=120 pcf embankment (15 ft high at ~21.5°) over a 20-ft φ=0 foundation with c=450 psf; geometry fully labeled in Slide's figure ((0,20)–(40,20)–(78,35)–(130,35), base y=0). The critical mechanism is the deep circle tangent to the base; the shallow infinite-slope FS is tan30°/tan21.5° ≈ 1.46 and does not govern.
Input files: vp079.xlsx
| Method | XSLOPE (search) | Published |
|---|---|---|
| Bishop | 1.407 | Slide 1.412; D&W 1.40 |
| Spencer | 1.397 | Slide 1.400 |
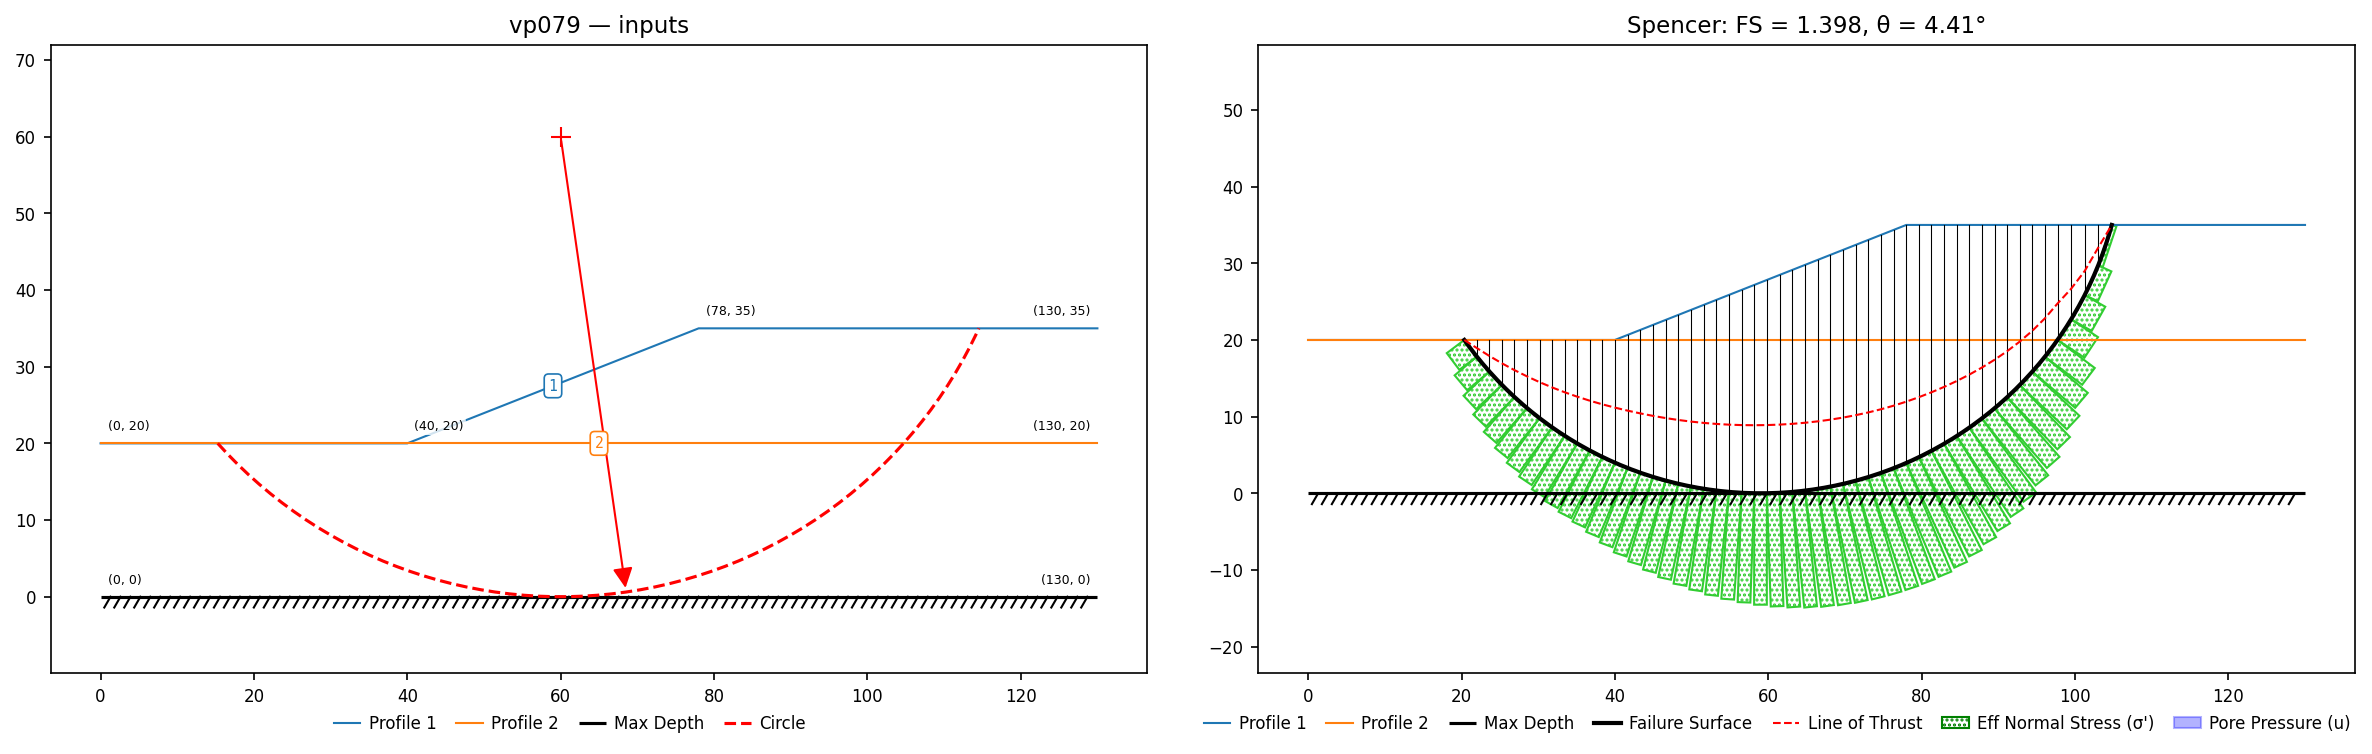
VP80: Embankment on a stratified foundation (D&W Fig. 14.5)
Slide #80 / Duncan & Wright (2005) Fig. 14.5: an embankment (c=1 psf, φ=35°, γ=120 pcf) over five alternating φ=0 clay and c≈0 sand layers (fully labeled figure, imperial units). Two circles from the published center (142, 147): tangent to the foundation top (R=87) and tangent to the 15-ft-depth line (R=102) — the deeper circle drops FS from ~2.5 to ~1.35 as it engages the 500-psf clay.
Input files: vp080a.xlsx, vp080b.xlsx
| Case | Method | XSLOPE | Published |
|---|---|---|---|
| tangent 0 ft | Bishop / Spencer | 2.533 / 2.530 | Slide 2.549 / 2.545; D&W 2.56 |
| tangent 15 ft | Bishop / Spencer | 1.389 / 1.352 | Slide 1.398 / 1.359; D&W 1.35 |
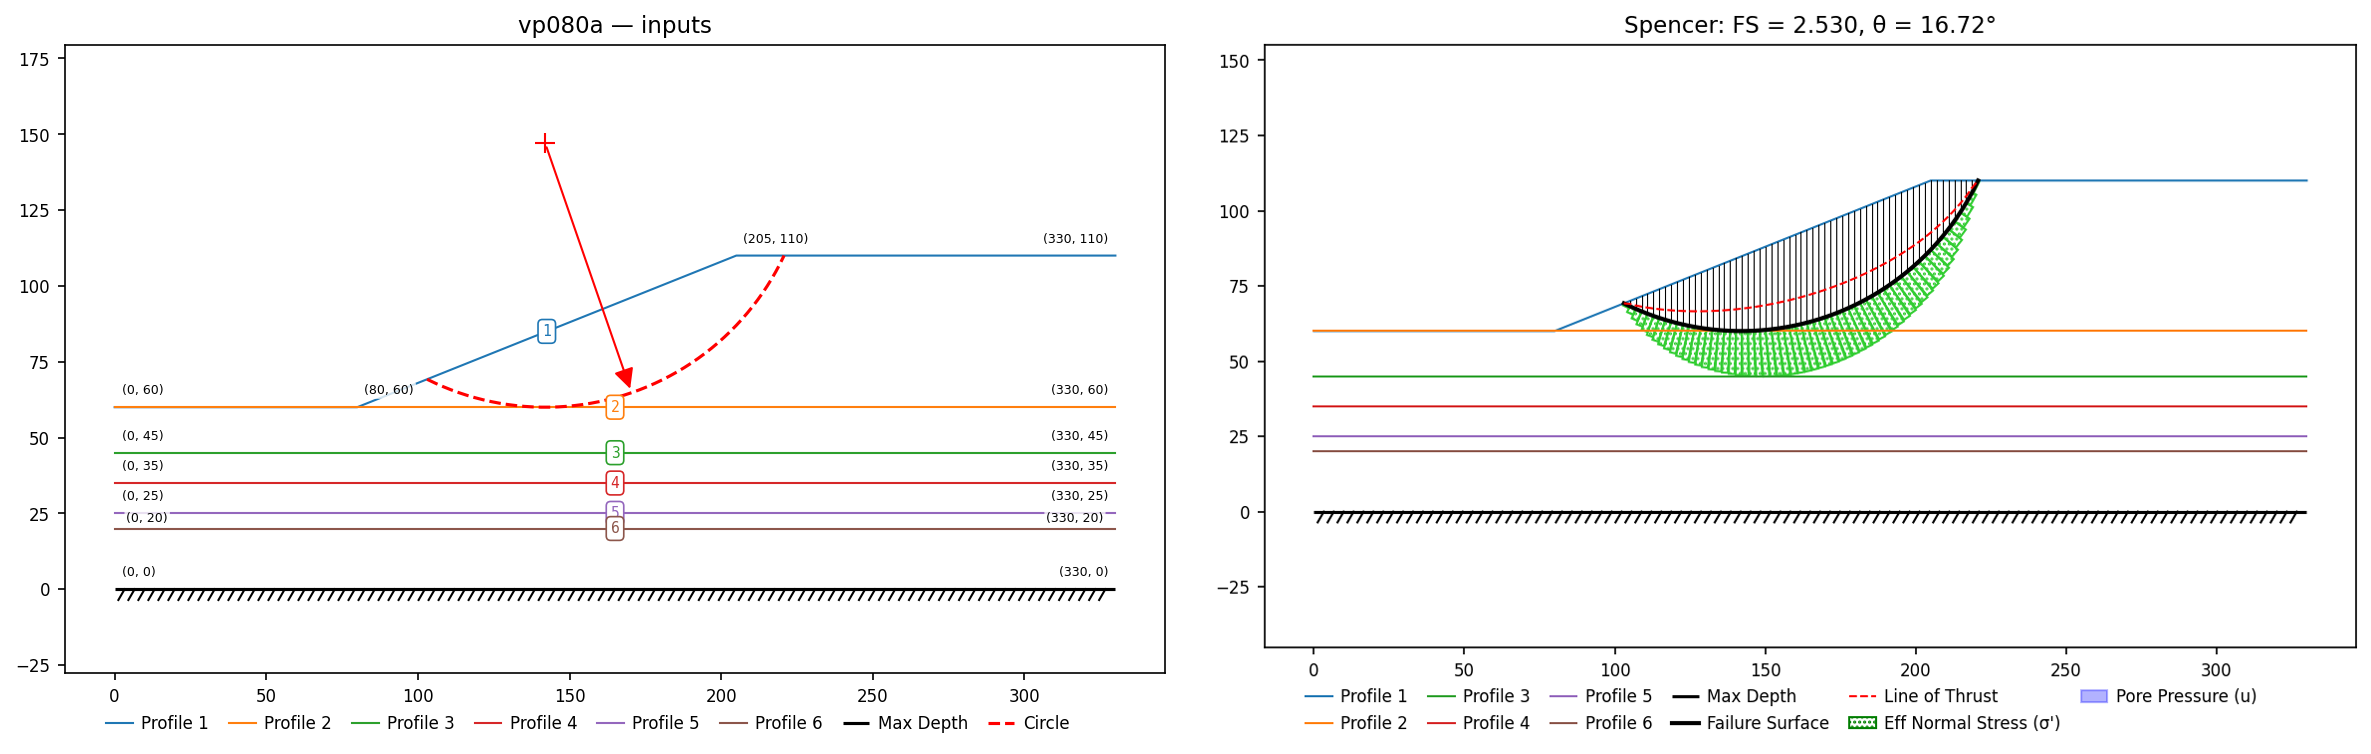
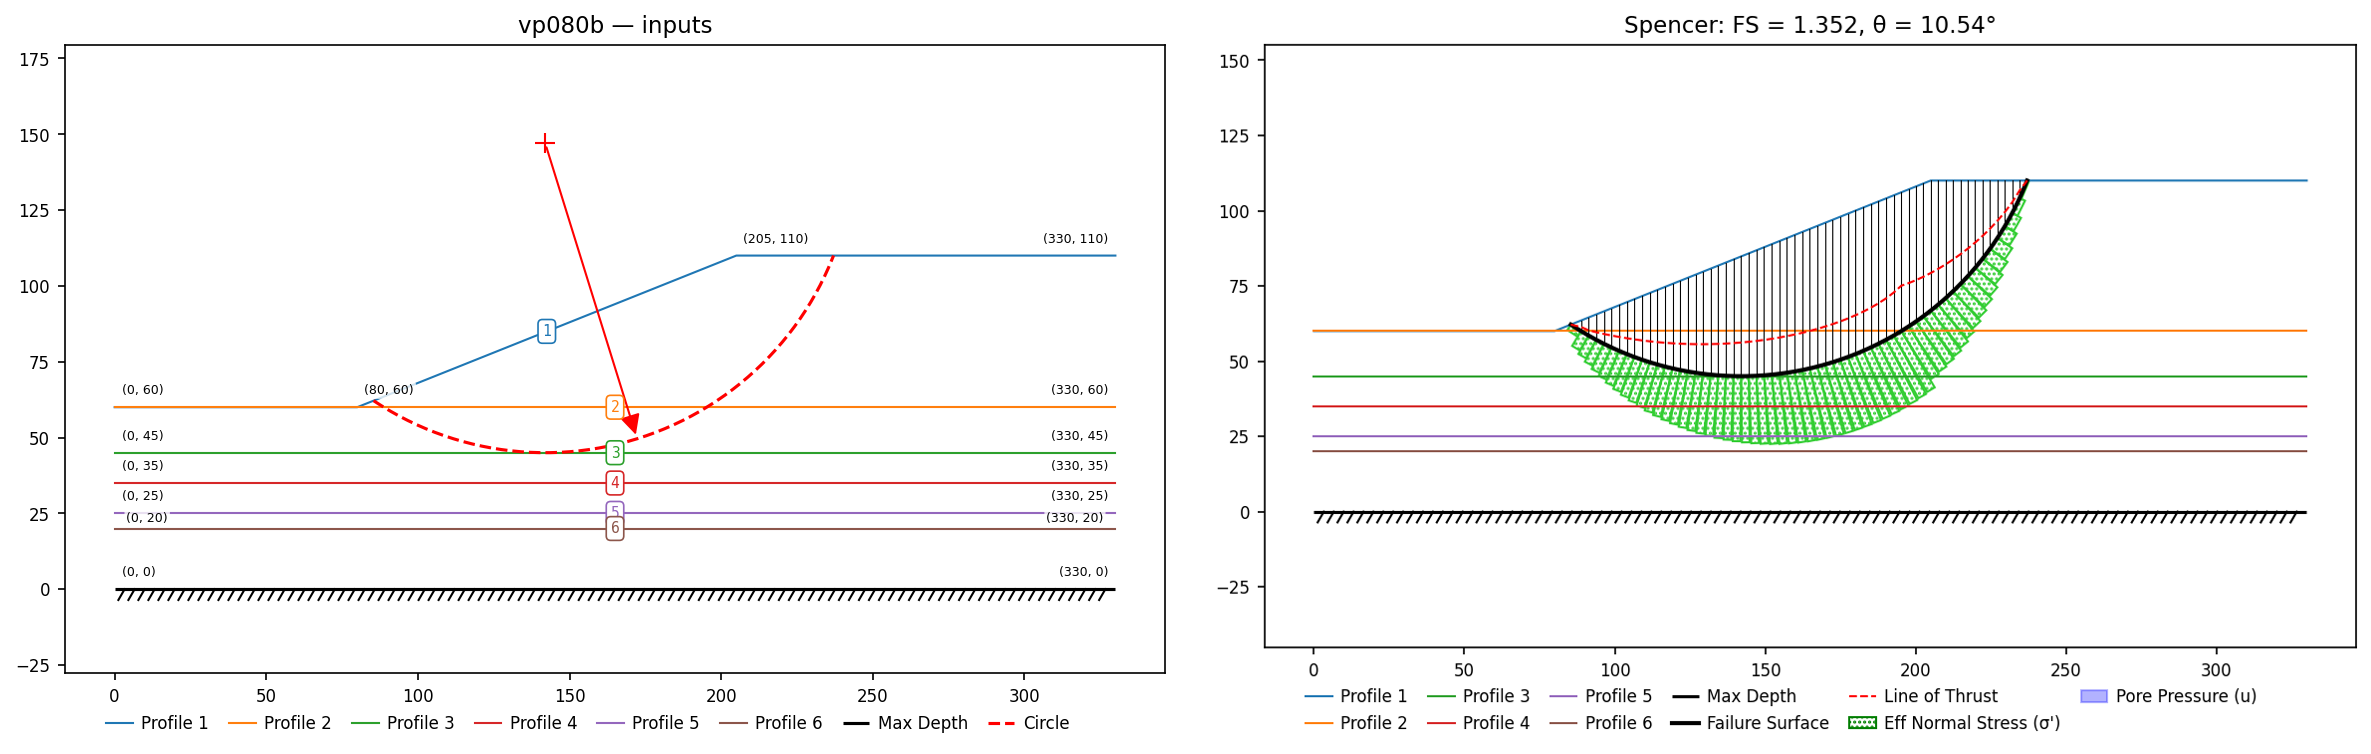
VP81: Embankment on a φ=0 foundation (D&W Fig. 14.7)
Slide #81 / Duncan & Wright (2005) Fig. 14.7: a c=0, φ=30°, γ=124 pcf embankment (19 ft at ~26.6°) over a 15-ft φ=0 foundation with c=500 psf, γ=98 pcf; geometry fully labeled in Slide's figure ((0,15)–(35,15)–(73,34)–(128,34), base y=0). The deep base-tangent circle governs.
Input files: vp081.xlsx
| Method | XSLOPE (search) | Published |
|---|---|---|
| Bishop | 1.223 | Slide 1.230; D&W 1.21 |
| Spencer | 1.204 | Slide 1.209 |
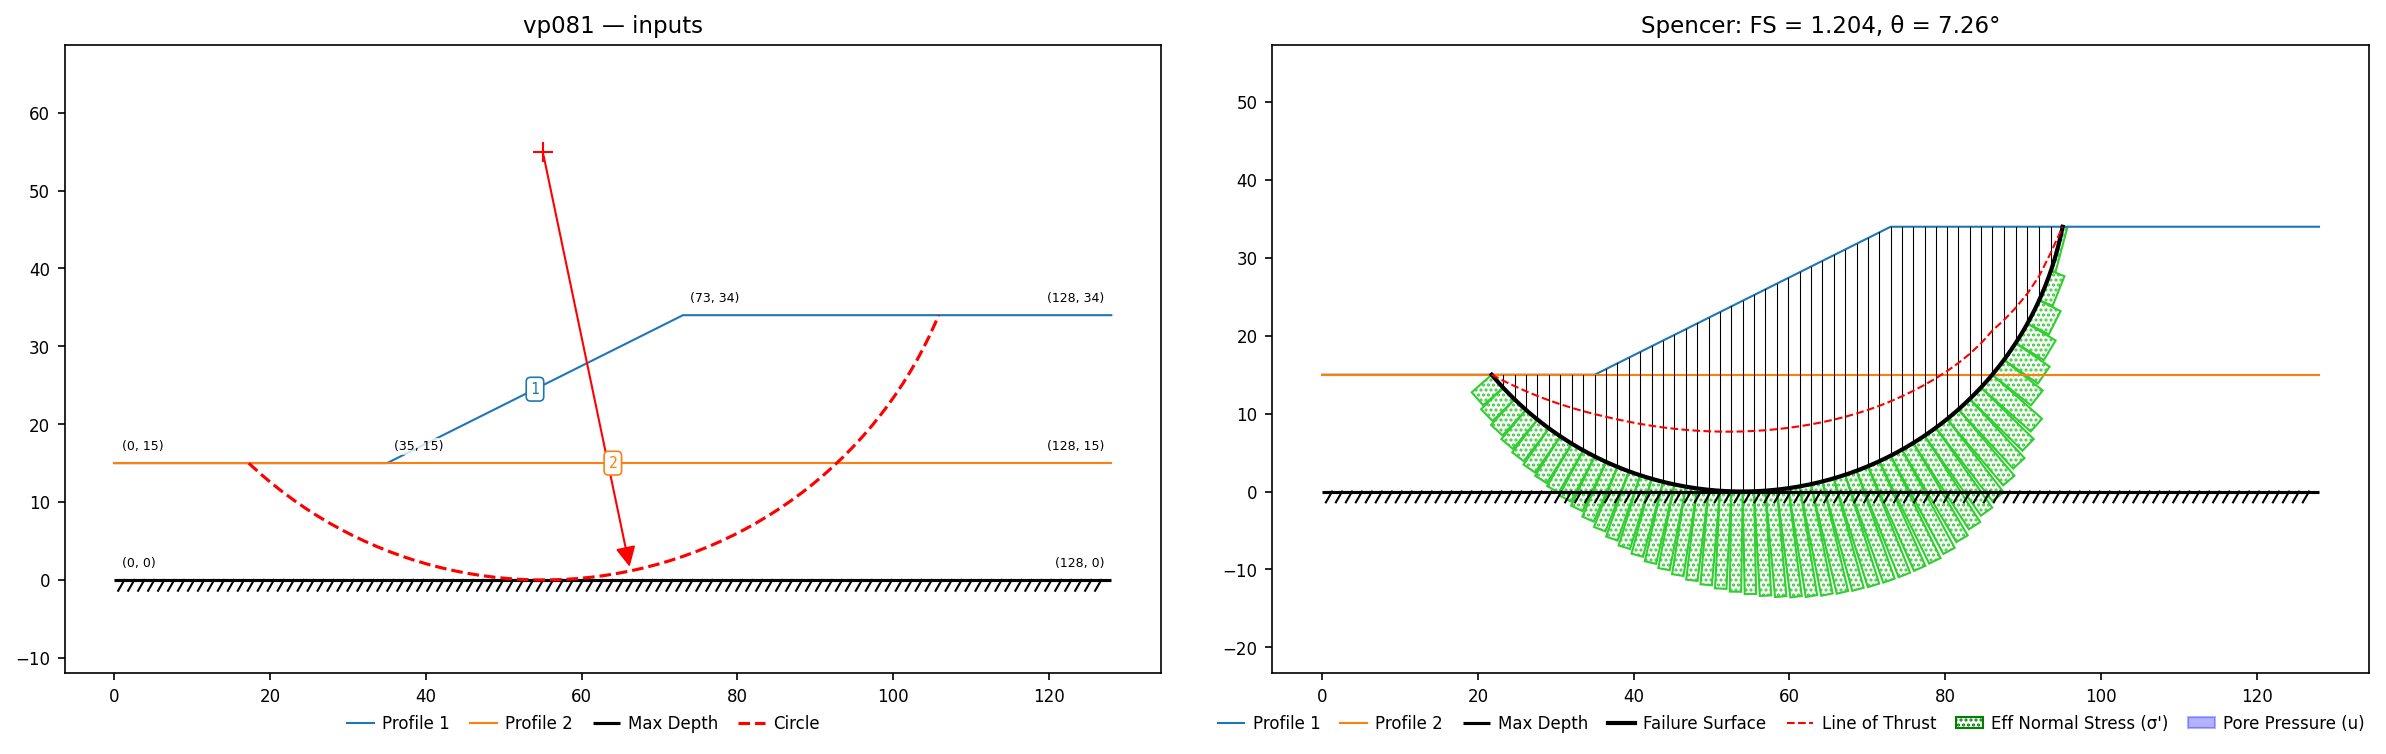
VP82: Embankment with a water table (D&W Fig. 14.20-a)
Slide #82 / Duncan & Wright (2005) Fig. 14.20-a: an embankment (c' = 600 psf, φ' = 25°, γ = 125 pcf; ground (0,60)–(60,60)–(140,20)–(200,20)) on a cohesionless foundation (c' = 0, φ' = 30°, γ = 132 pcf), with a piezometric line running (0,40)–(100,30)–(140,20)–(200,20). Free circular search.
Input files: vp082.xlsx
| Method | XSLOPE | Published |
|---|---|---|
| Bishop | 1.521 | Slide 1.533; D&W 1.535 |
| Spencer | 1.533 | Slide 1.540 |
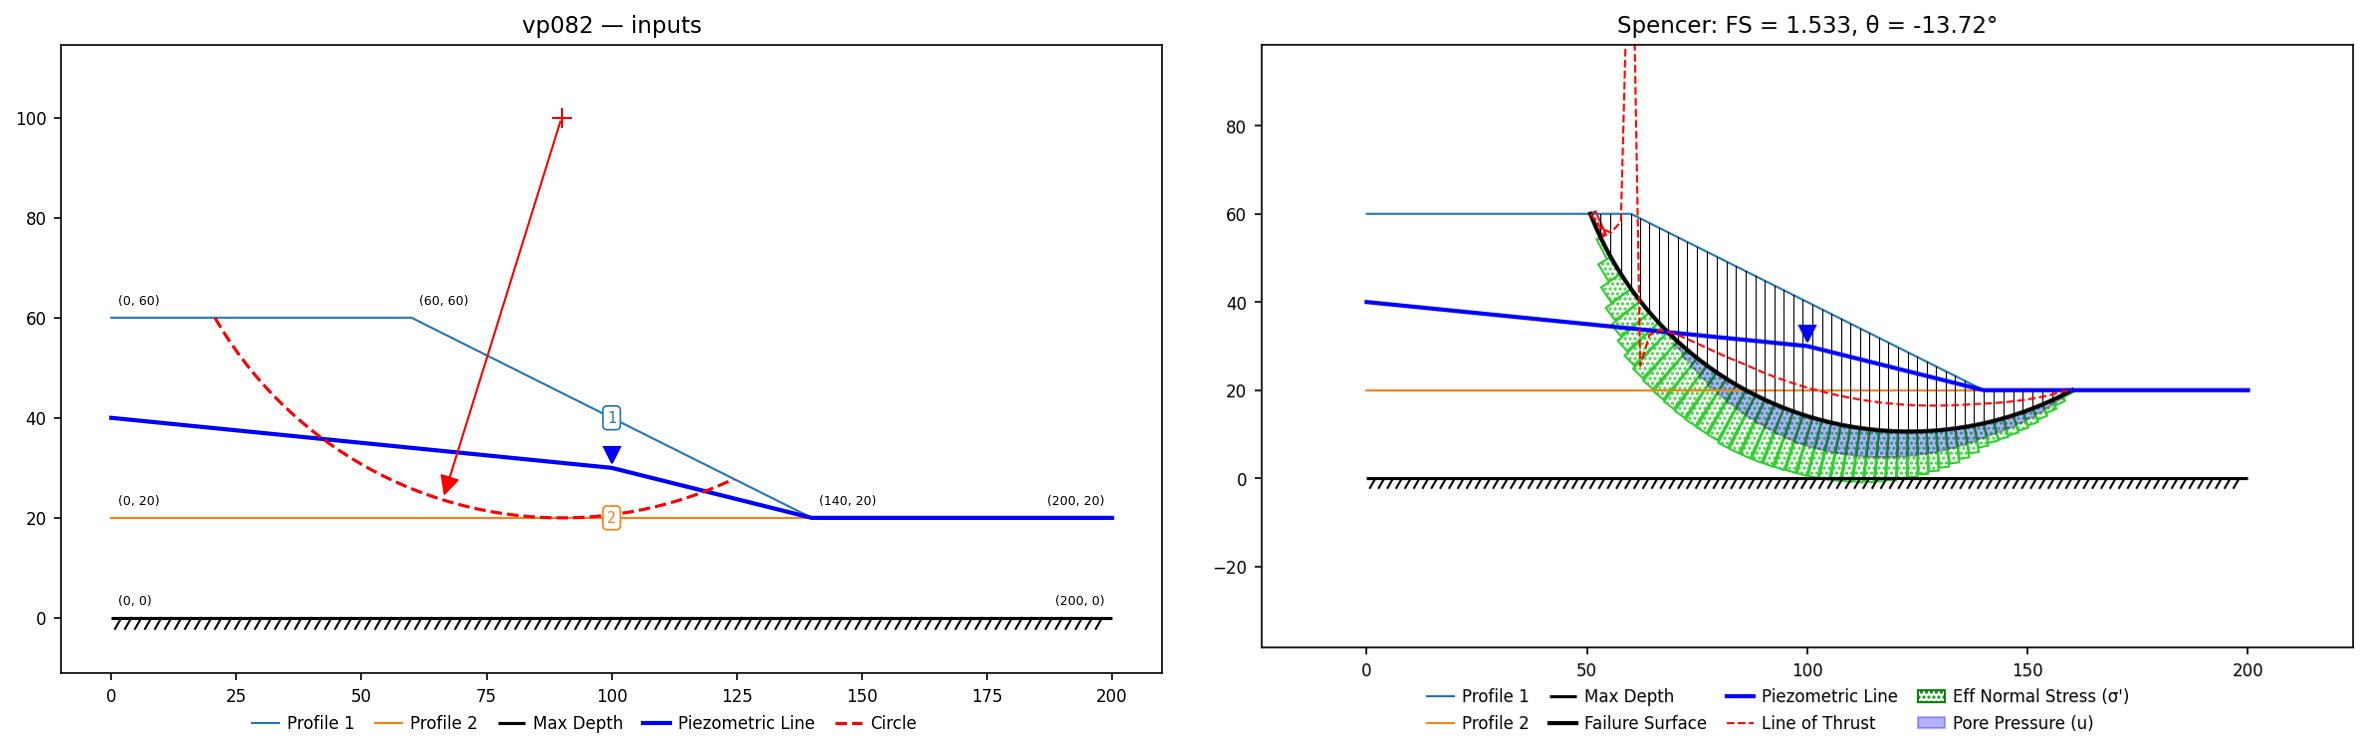
VP83: Embankment wall on an undrained foundation (D&W Fig. 14.20-b)
Slide #83 / Duncan & Wright (2005) Fig. 14.20-b: an embankment (c' = 0, φ' = 36°, γ = 123 pcf; ground (0,40)–(55,40)–(75,30)–(140,30)) on a 30-ft undrained foundation (φ = 0, γ = 97 pcf) down to a base at el. 0. Two foundation strength profiles are tested: profile I increases with depth, cu = 200 + 15·z psf, and profile II is constant at 300 psf. Free circular search.
Profile I uses XSLOPE's cp strength option, which is exactly this form — an undrained strength c at a reference elevation r_elev, growing at rate cp per foot below it.
Input files: vp083a.xlsx (profile I), vp083b.xlsx (profile II)
| Case | Method | XSLOPE | Published |
|---|---|---|---|
| I: cu = 200 + 15·z | Bishop / Spencer | 1.305 / 1.275 | Slide 1.313 / 1.285; D&W 1.300 |
| II: cu = 300 | Bishop / Spencer | 1.328 / 1.326 | Slide 1.335 / 1.330; D&W 1.312 |
With the constant profile the critical circle runs all the way down to the base of the foundation, as Slide notes; the free search finds it without being told to.
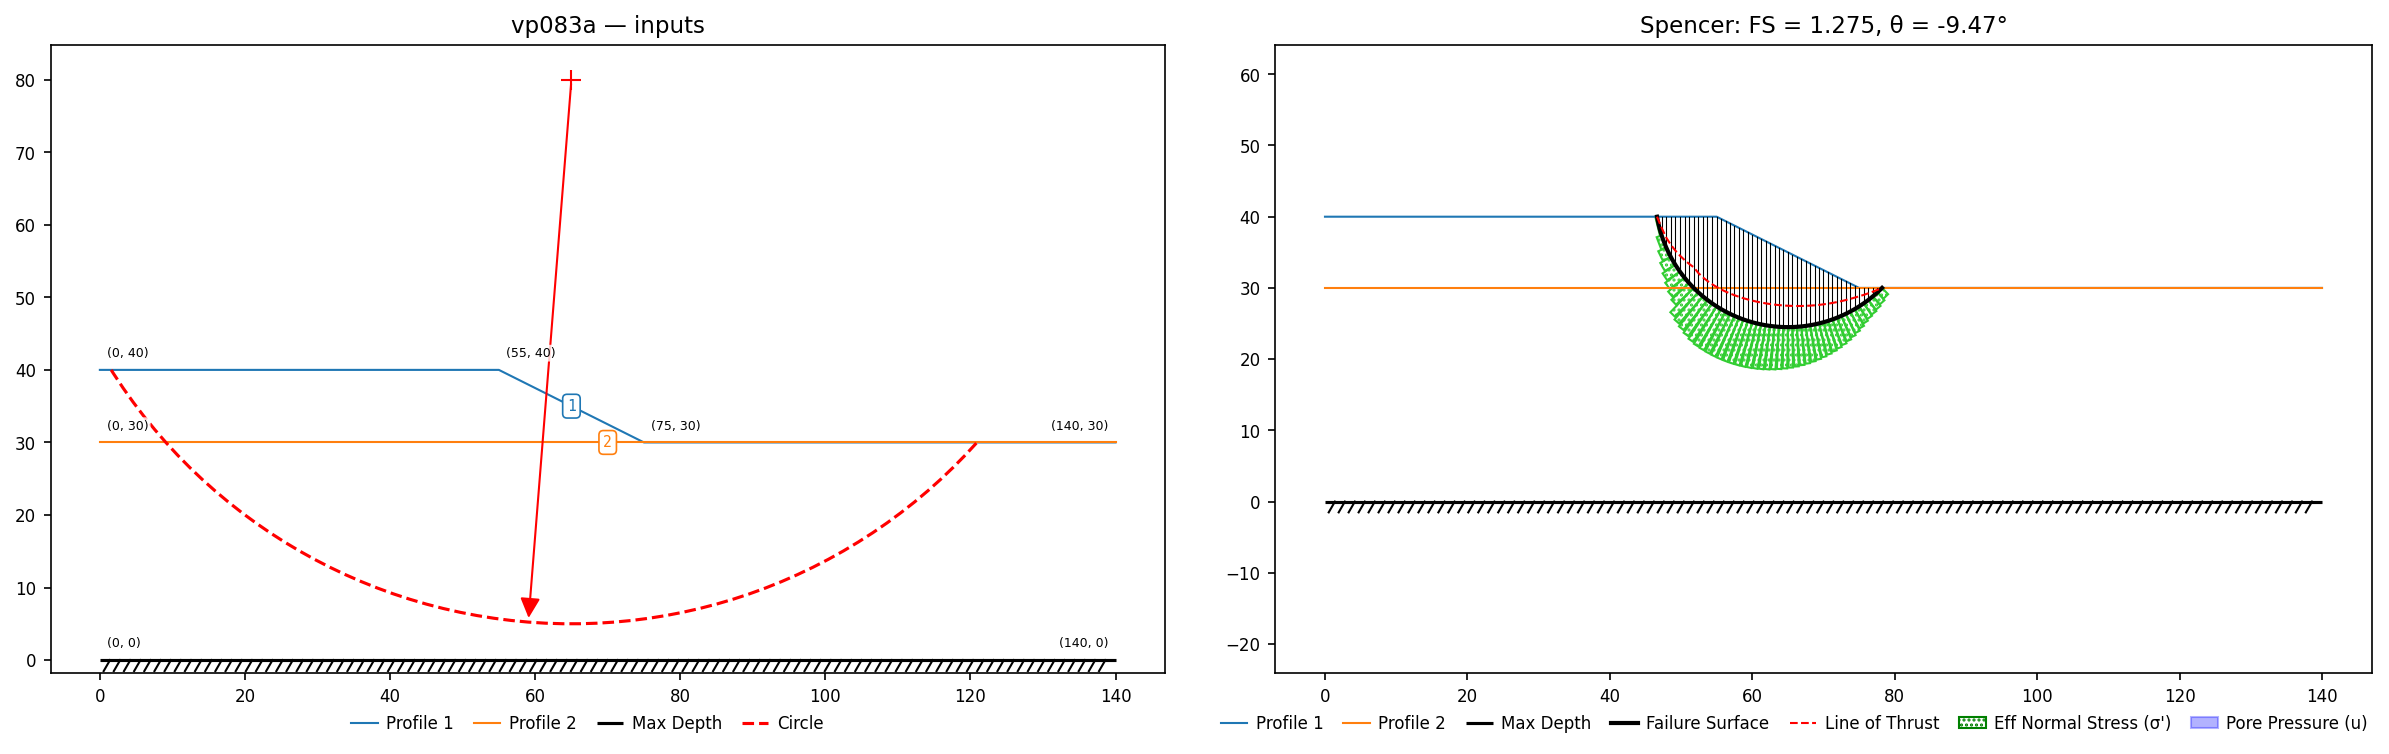
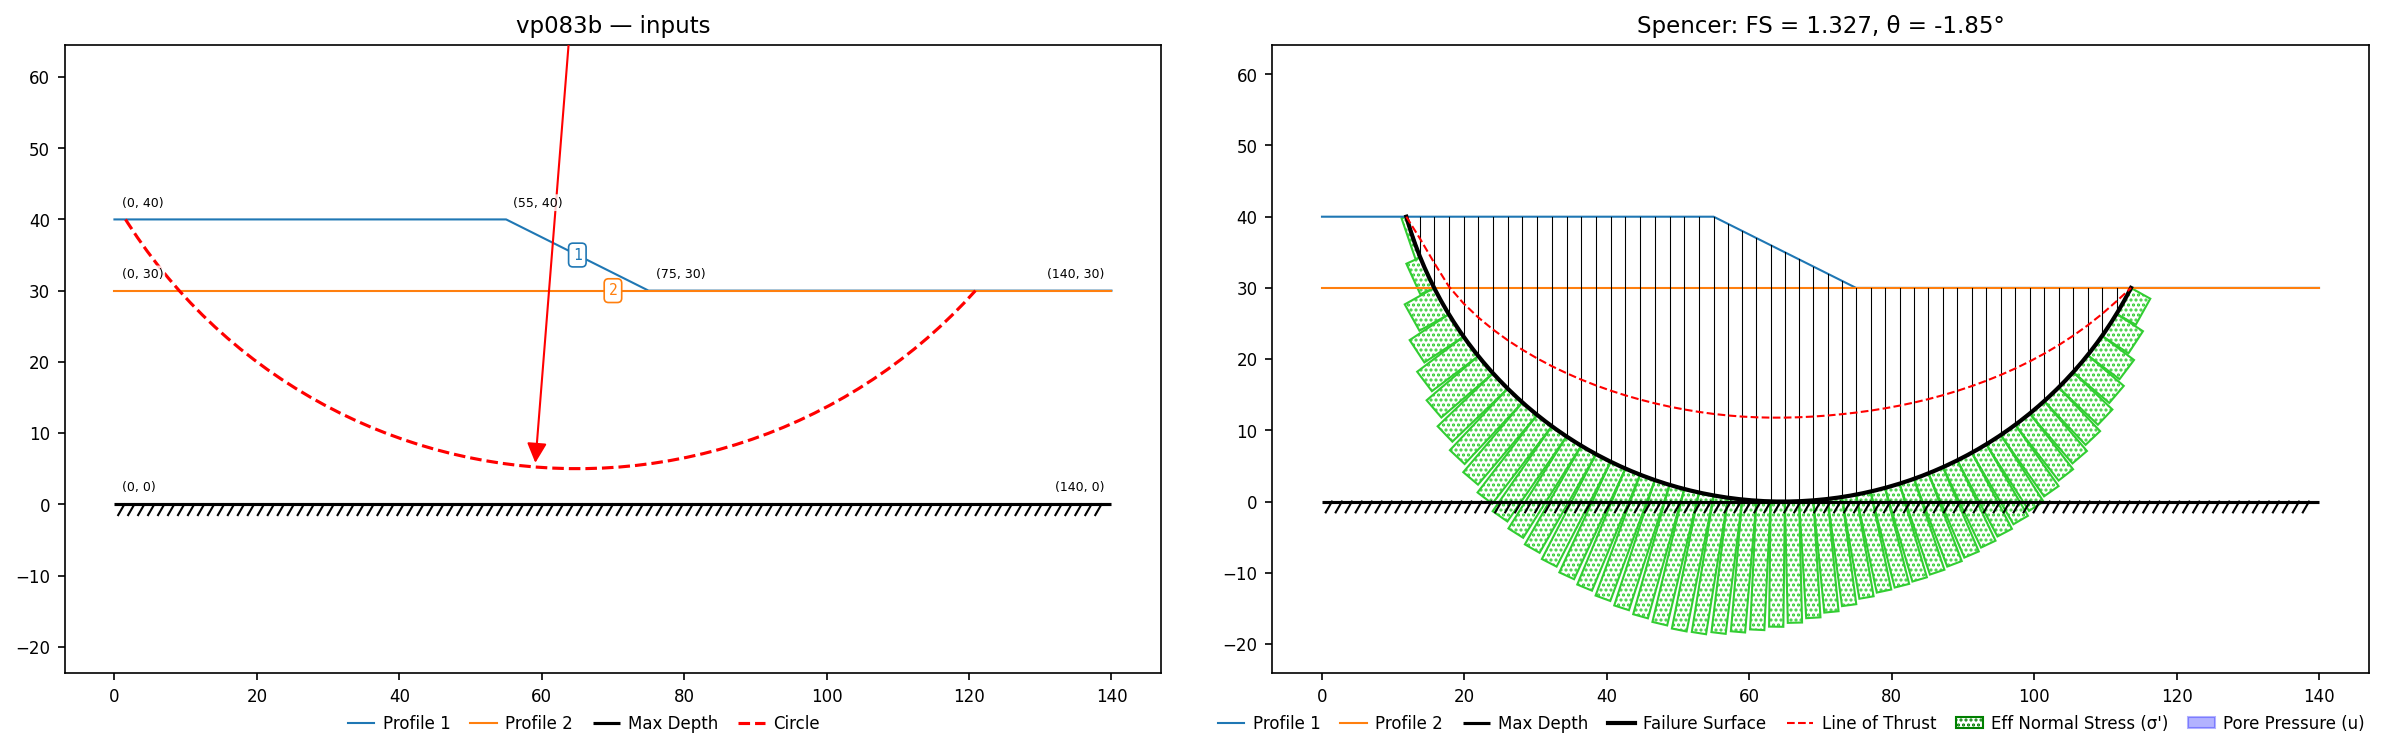
VP84: Embankment on a foundation with four strength gradients (D&W Fig. 15.9)
Slide #84 / Duncan & Wright (2005) Fig. 15.9: an embankment (c' = 0, φ' = 35°, γ = 125 pcf; ground (0,20)–(40,20)–(90,40)–(140,40)) on a 20-ft undrained foundation (φ = 0, γ = 100 pcf) whose strength is cu = 300 + cz·z. The same slope is run with four strength gradients, cz = 0, 5, 10 and 15 psf/ft — a systematic sweep of the cp option.
Input files: vp084a.xlsx, vp084b.xlsx, vp084c.xlsx, vp084d.xlsx
| Profile | cz (psf/ft) | XSLOPE Bishop / Spencer | Published |
|---|---|---|---|
| I | 0 | 0.756 / 0.751 | Slide 0.761 / 0.756; D&W 0.75 |
| II | 5 | 0.905 / 0.897 | Slide 0.909 / 0.898; D&W 0.90 |
| III | 10 | 1.042 / 1.028 | Slide 1.045 / 1.032; D&W 1.03 |
| IV | 15 | 1.151 / 1.131 | Slide 1.154 / 1.134; D&W 1.13 |
Four gradients, one geometry: the whole family tracks Slide within 0.7% and D&W within 1%. Together with VP83 this exercises the depth-varying undrained strength option across five different gradients, from constant to 15 psf/ft.
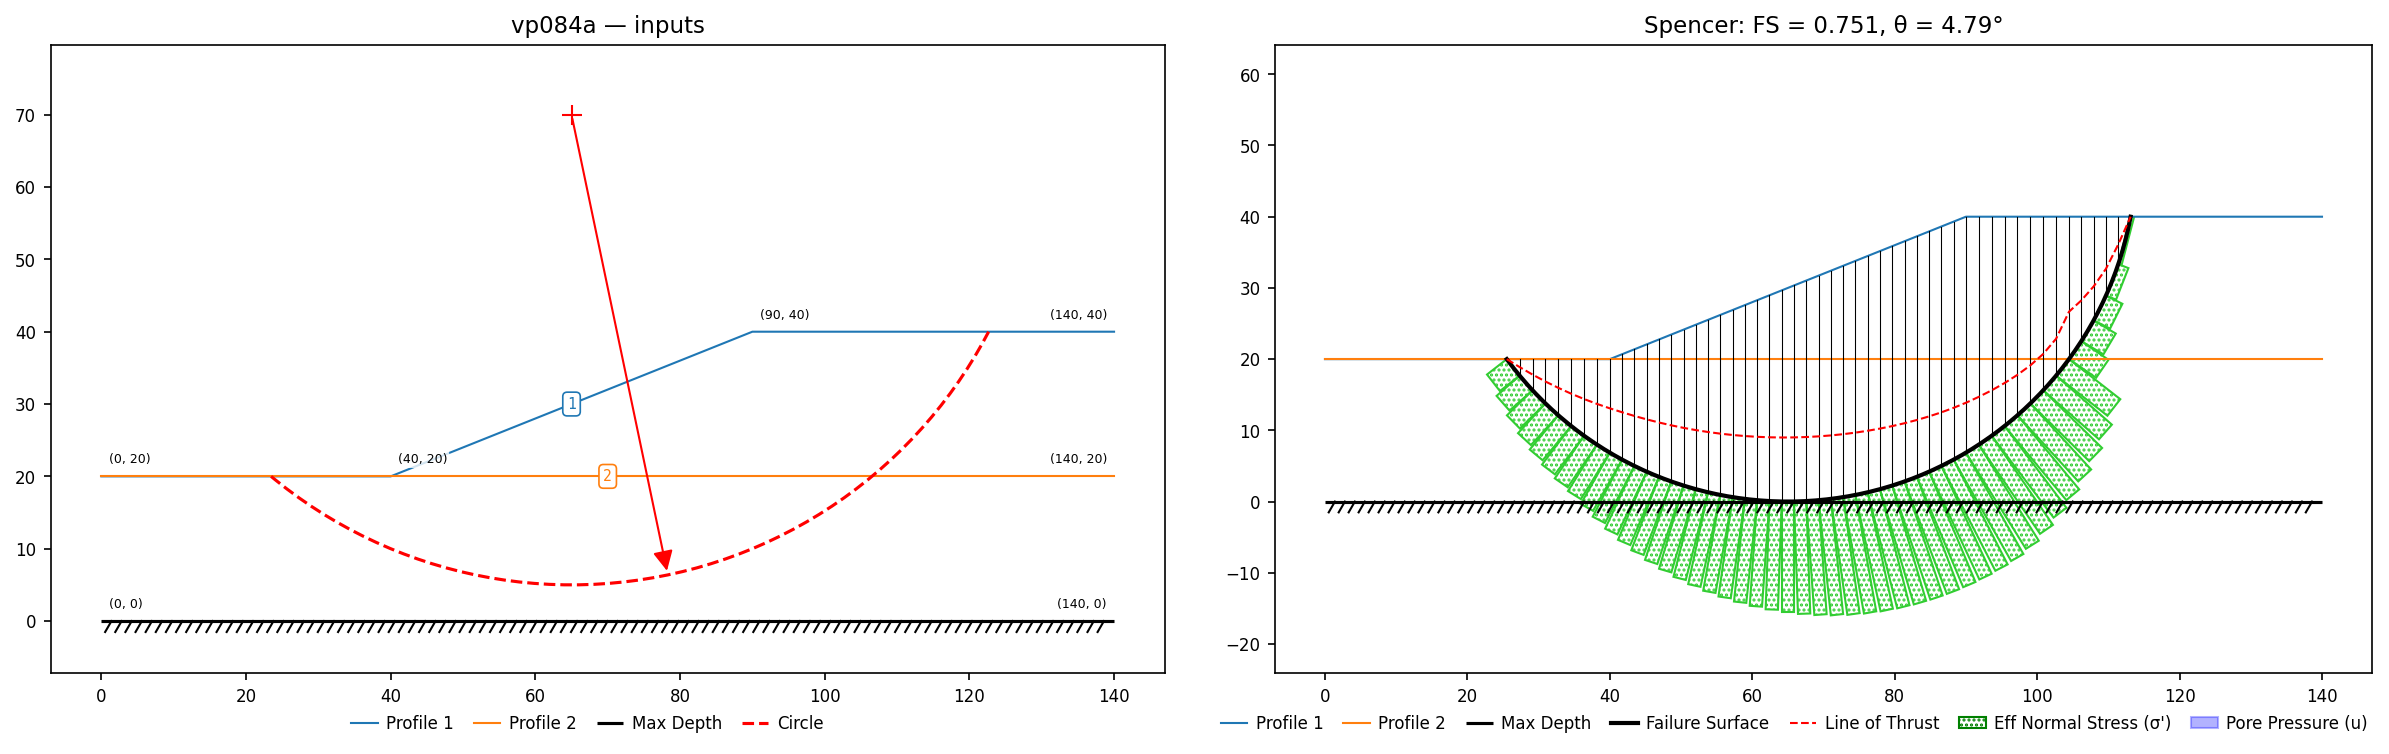
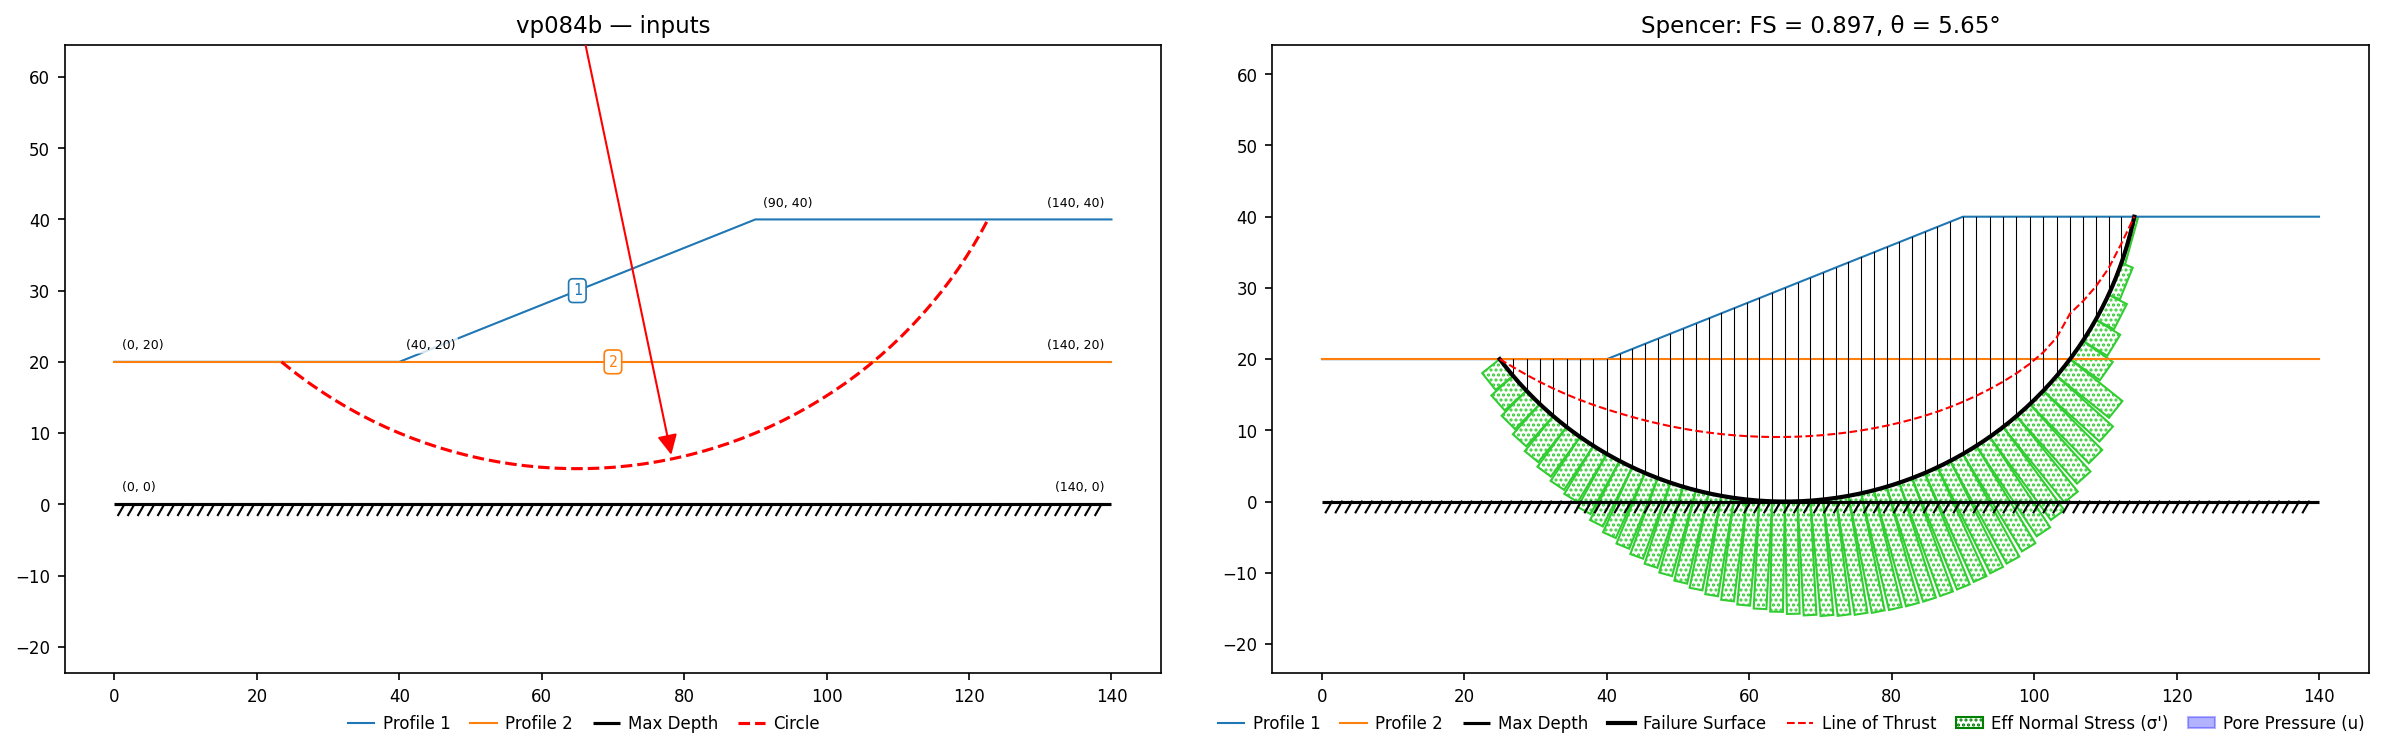
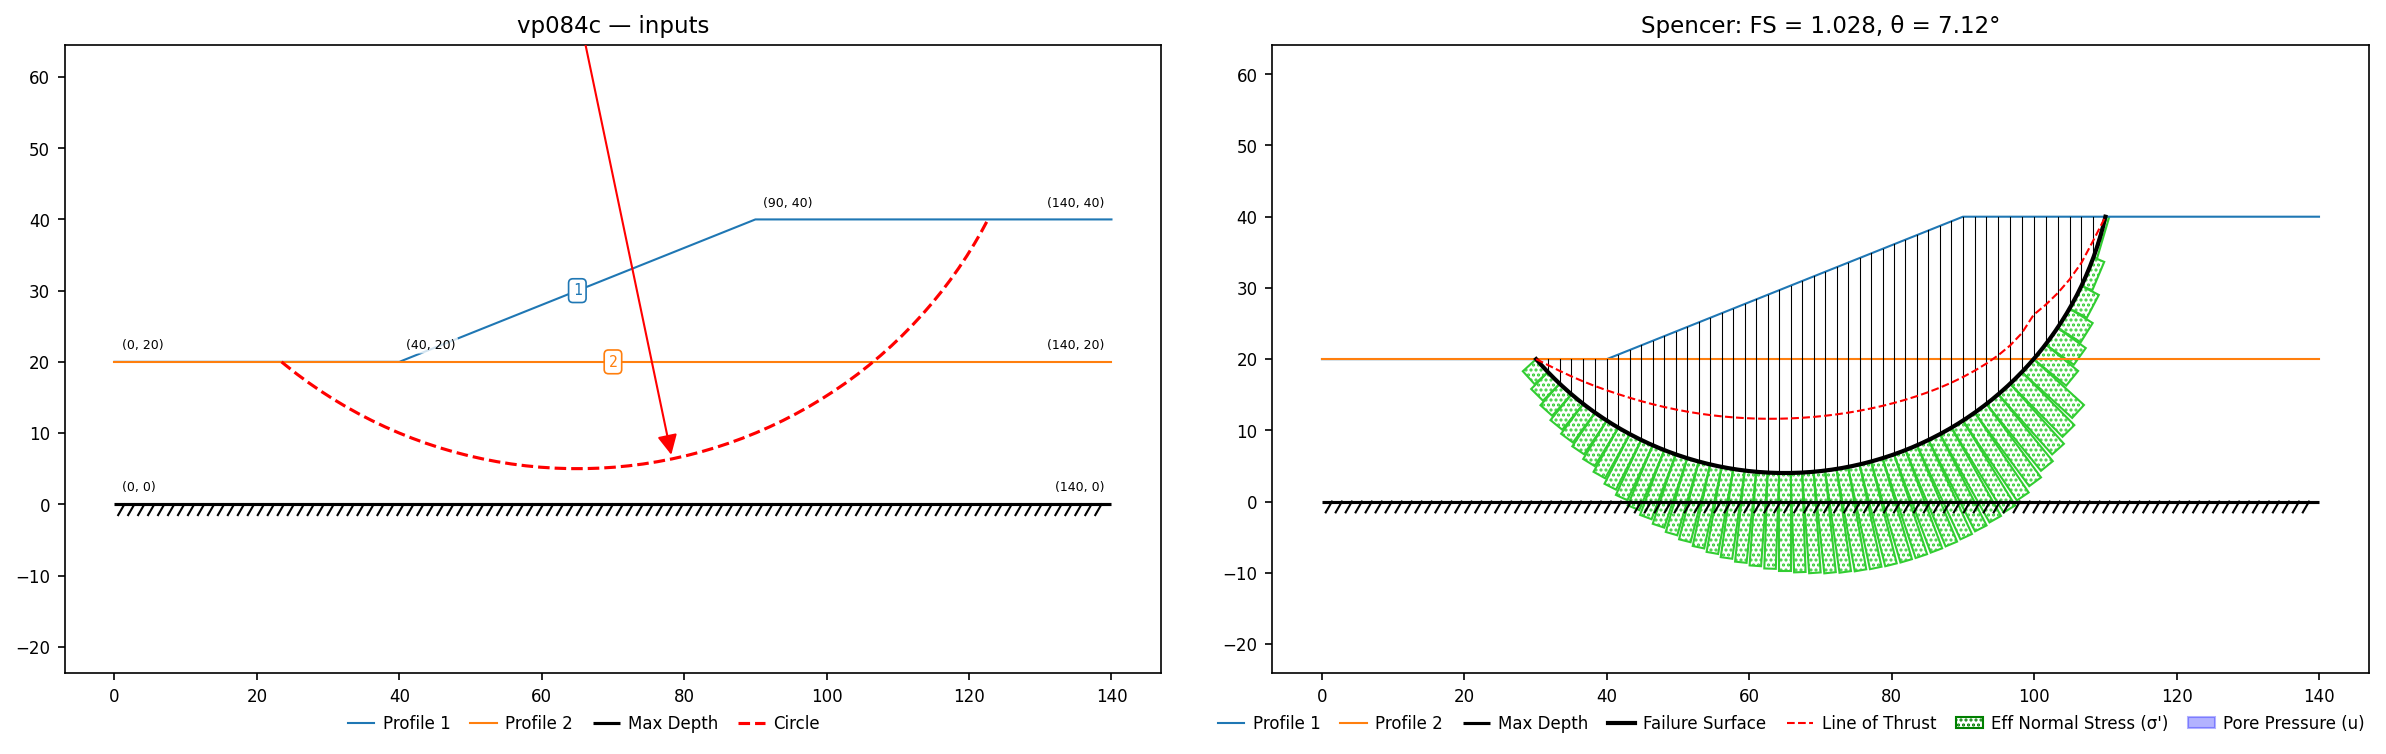
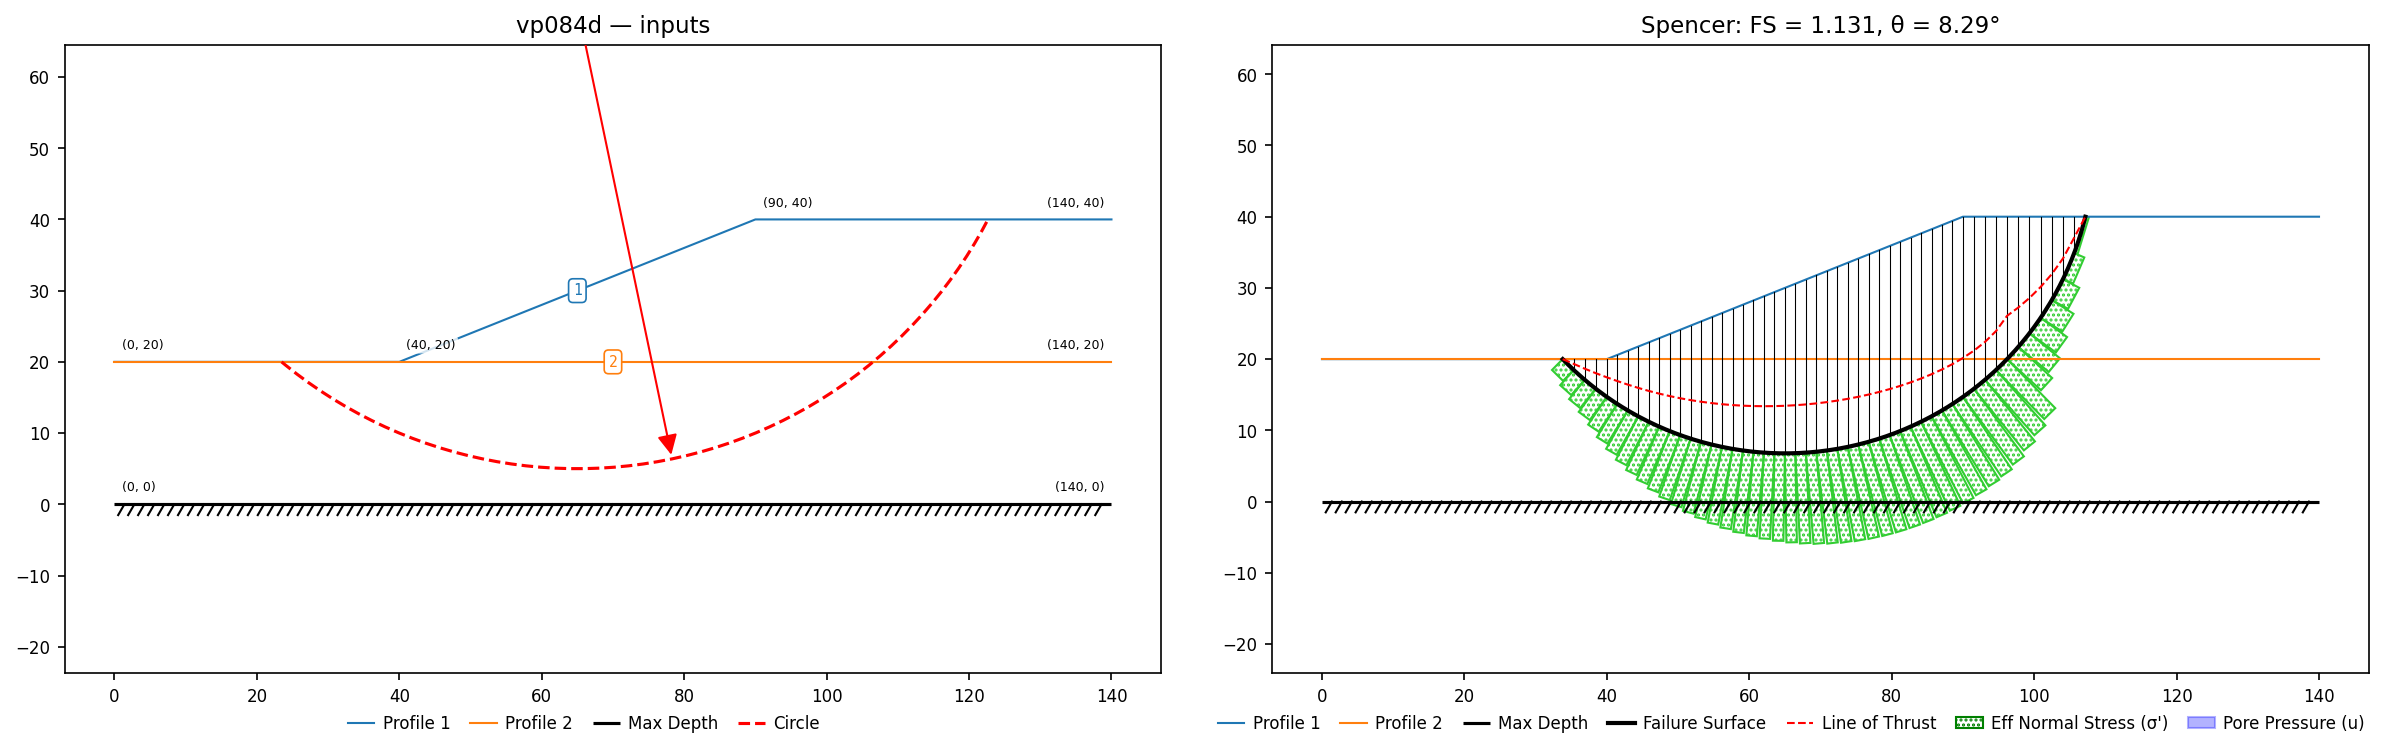
VP85: Reinforced slope, homogenous, grouted tieback
Slide #85 case 1 (active). D&W reference 1.51; Slide circular Bishop 1.531.
Slide #85 case 2 (passive). D&W reference 1.32; Slide circular Bishop 1.324.
Input files: vp085a.xlsx, vp085b.xlsx
Active support, on Slide’s printed GLE circle
| Method | XSLOPE | Published |
|---|---|---|
| Bishop | 1.567 | Slide GLE 1.575 (same circle); D&W 1.51 |
| Spencer | 1.567 | Slide GLE 1.575 (same circle) |
Passive support, on Slide’s printed Bishop circle
| Method | XSLOPE | Published |
|---|---|---|
| Ordinary | 1.319 | Slide Bishop 1.324 (same circle); D&W 1.32 |
| Bishop | 1.319 | Slide 1.324; D&W 1.32 |
Slide’s own method table scatters 1.42–2.05 here (concentrated force strains interslice assumptions), so per-circle comparison is the meaningful one.
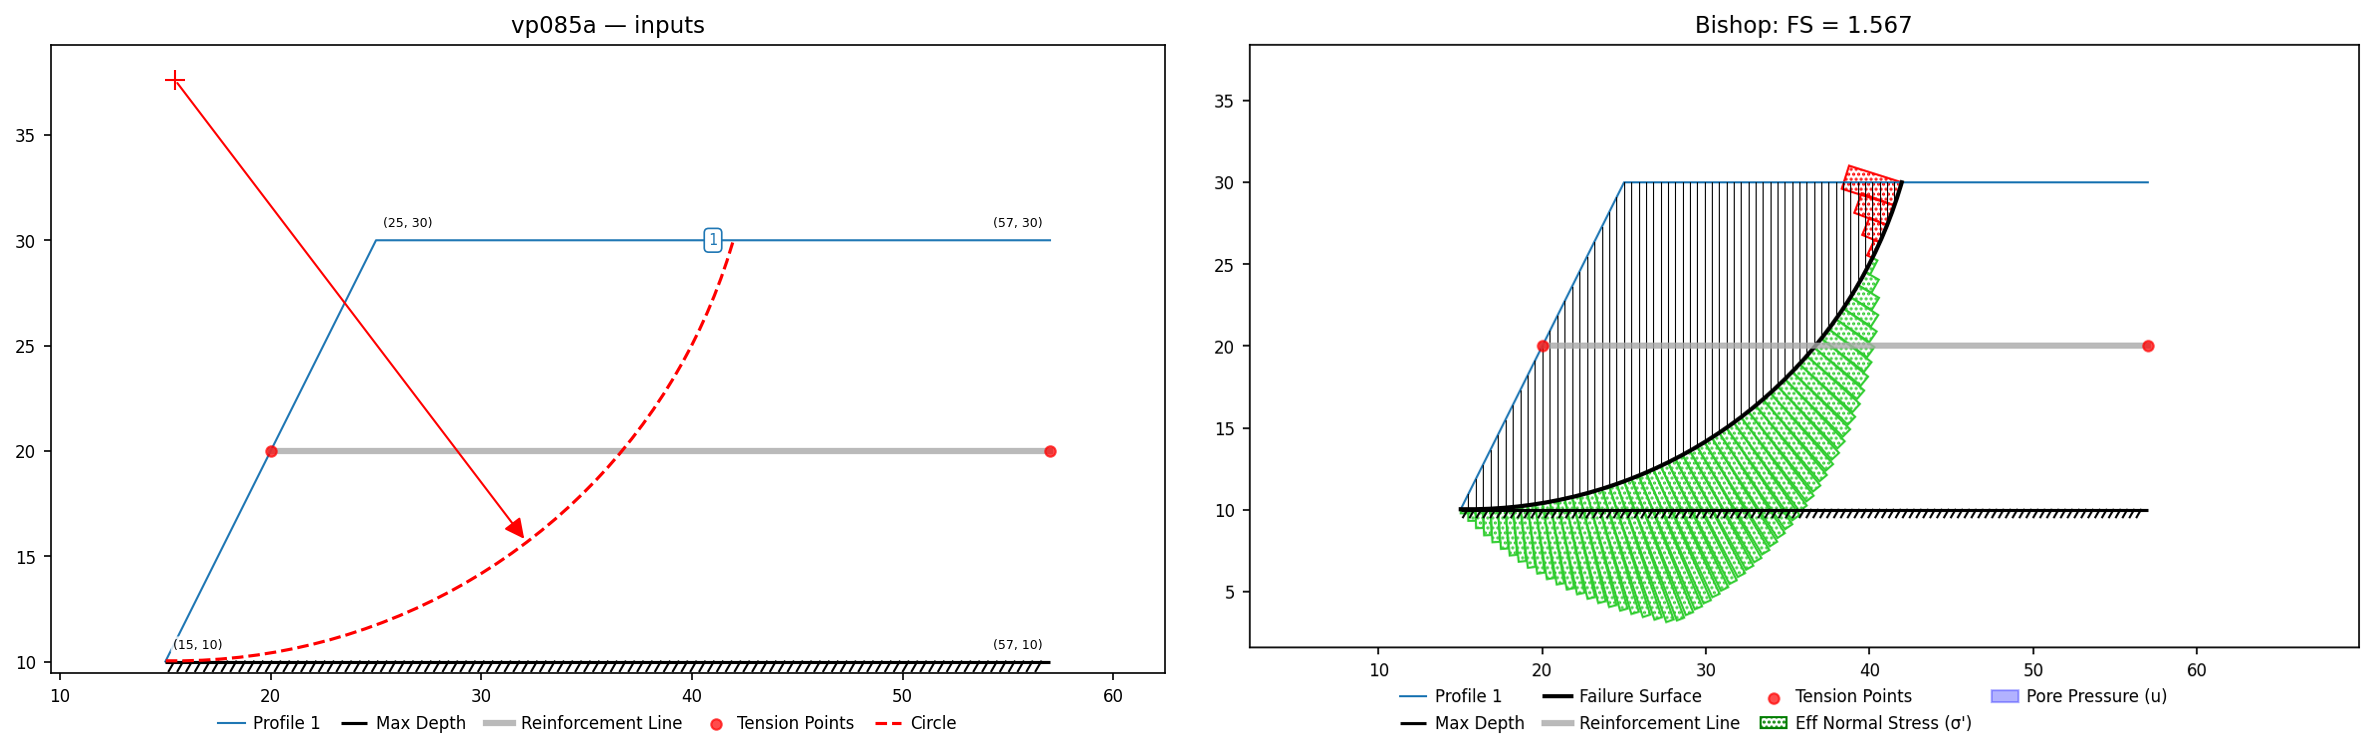
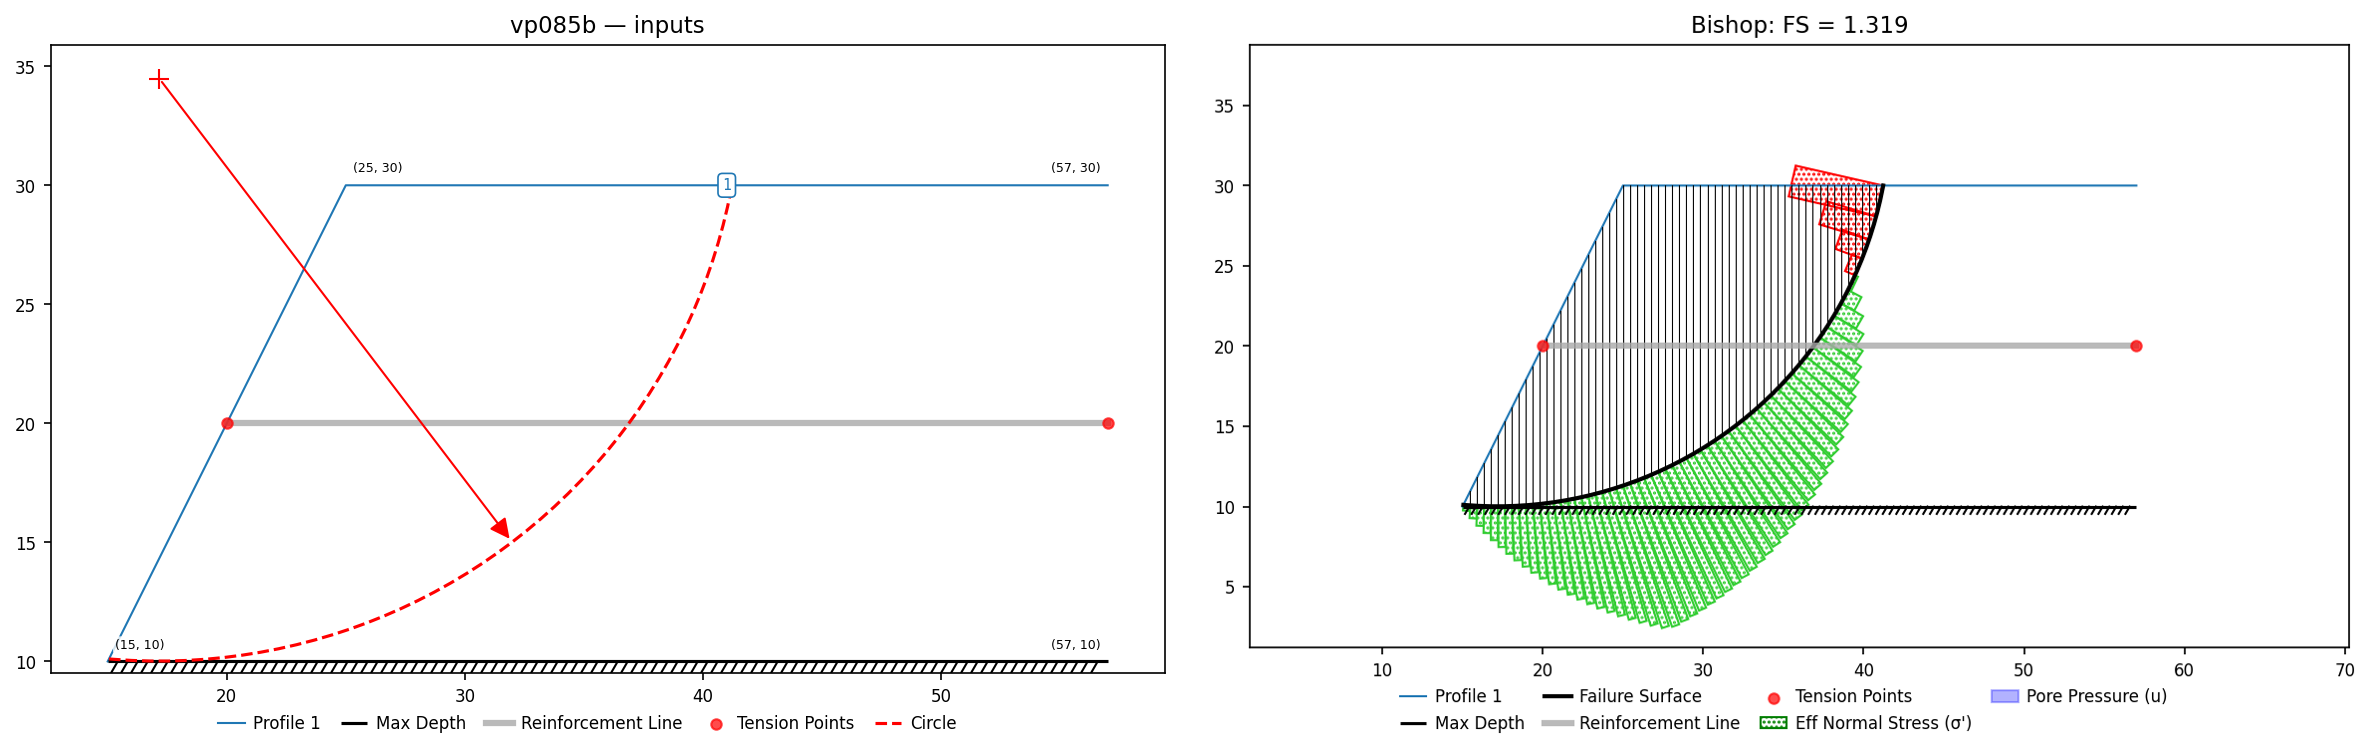
VP86: Reinforced slope, homogenous, grouted tieback
Slide #86: Duncan & Wright (2005) Fig. 7.28 / STABGM reinforced fill on a strong rock foundation: 5 geogrids (800 lb/ft, 20 ft long, every 4 ft). Slide2 circular: Bishop 1.629, Spencer 1.620, GLE 1.622; D&W reference 1.61.
Input files: vp086.xlsx
| Method | XSLOPE | Published |
|---|---|---|
| Bishop | 1.617 | Slide 1.629 |
| Spencer | 1.611 | Slide 1.620 |
Duncan & Wright reference 1.61.
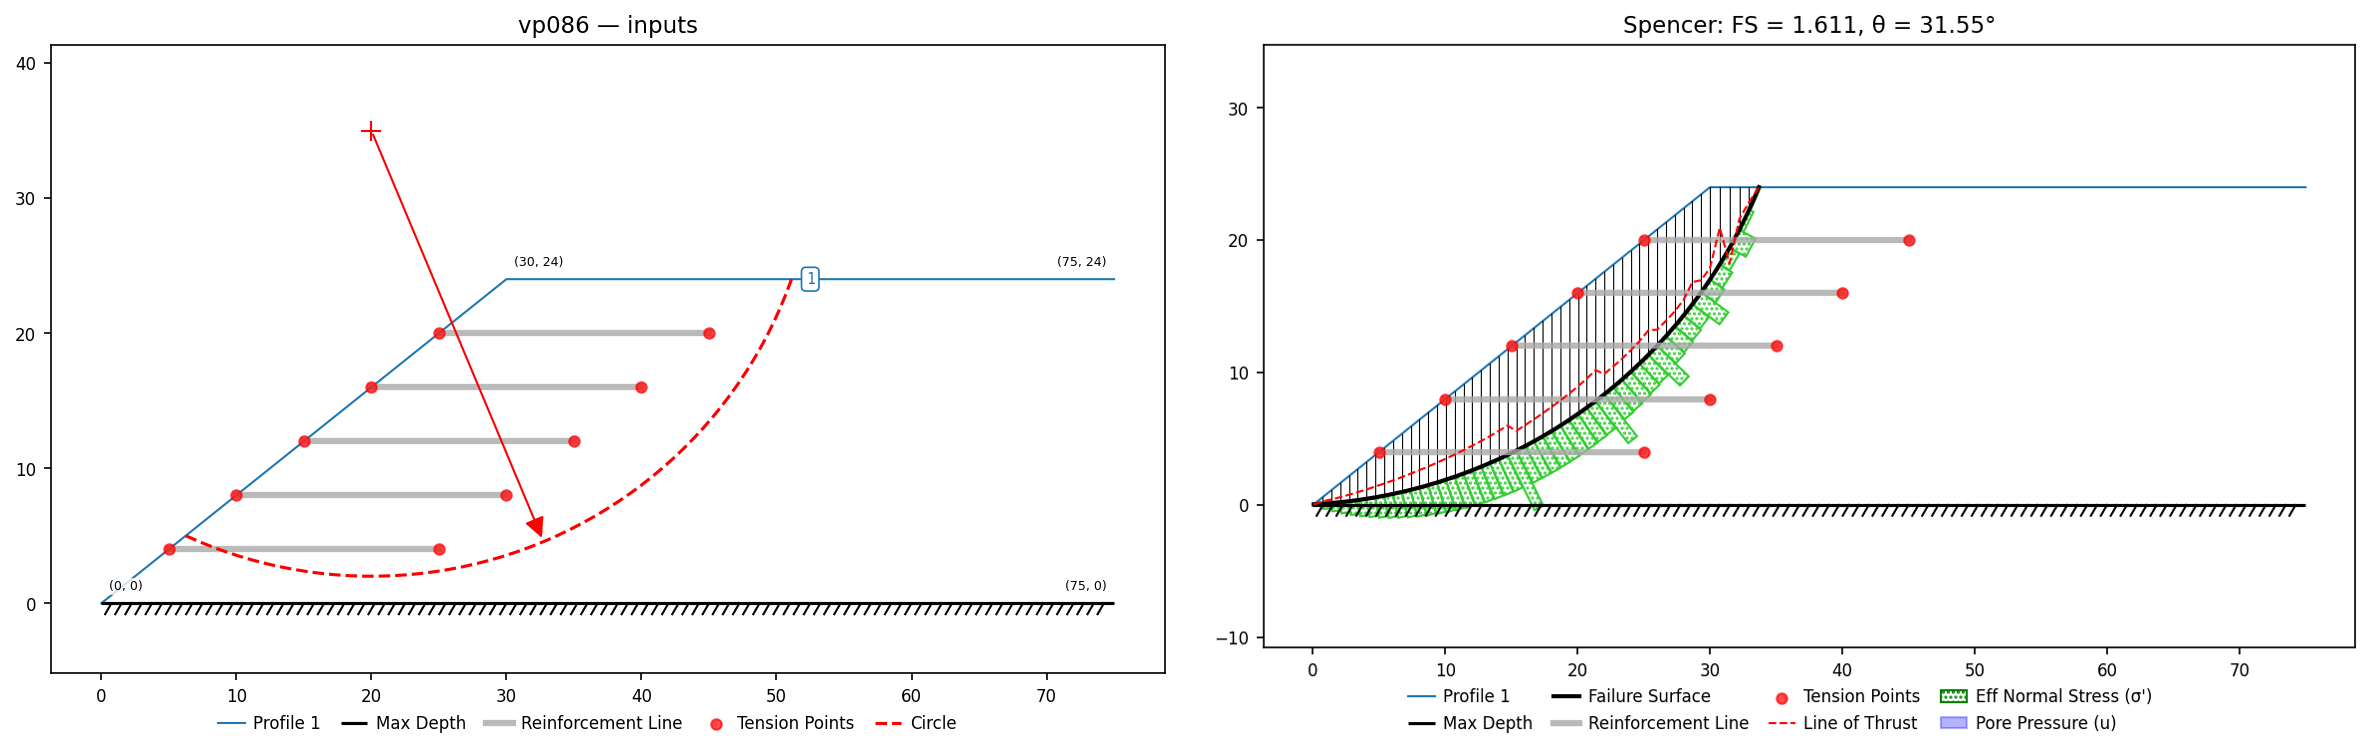
VP87–VP94: Geosynthetic multitiered MSE walls (Leshchinsky & Han 2004)
Slide #87–#94 reproduce the parametric study in Leshchinsky & Han (2004): a three-tier segmental (block-faced) MSE wall — three 3-m tiers offset 1.2 m, 0.3-m block columns (c=2.5 kPa, φ=34°), reinforced/retained fill c=0/φ=34°, foundation c=10 kPa/φ=34° (6 m deep), γ=18 kN/m³ throughout — with geotextile layers every 0.6 m, L=6.3 m, and the tensile strength Ta the paper required for FS=1.0 in each variation. Pullout resistance is 80% of the fill strength (translated to xslope anchorage lengths from the local overburden at each layer end); the geotextile force is applied horizontally (dir=axial, appl=passive — Slide's convention, verified against its printed VP87 circle). Each problem's Slide-printed critical circle is stored in the file, so the test tags evaluate a deterministic surface.
Two manual quirks resolved during the build: (1) Slide's VP89/92/93 results were computed with the baseline Ta = 10 supports even though their support tables print the paper's per-case required strengths (11.4/9.25/11.6) — with Ta=10 xslope lands within 1% of all three Slide numbers, and with the paper's strengths it lands on L&H's design intent (FS ≈ 1.0). (2) VP91's printed circle exits exactly tangent to the crest and needs a hair of extra radius to intersect.
| # | Case | Method (Slide's figure) | XSLOPE | Slide | L&H reference |
|---|---|---|---|---|---|
| 87 | Baseline (Ta=10) | Bishop | 1.031 | 1.040 | 0.99 (FLAC) / 1.00 (Bishop) |
| 88 | Fill φ=25 (Ta=22) | Spencer | 1.057 | 1.043 | 0.99 / 1.00 |
| 89 | L=4.2 m (Ta=11.4) | Spencer | 1.011 (0.980 at Ta=10) | 0.971 (used Ta=10) | 0.98 / 1.00 |
| 90 | Two types (7.5/11.0) | Bishop | 1.012 | 1.004 | 1.01 / 1.00 |
| 91 | Foundation c=0, φ=18 | Spencer | 0.960 | 0.964 | 0.86 (FLAC, bearing) / 1.00 |
| 92 | Water hw=3 m (Ta=9.25) | Bishop | 1.010 (1.039 at Ta=10) | 1.037 (used Ta=10) | 1.01 / 1.00 |
| 93 | Surcharge q=20 (Ta=11.6) | Bishop | 1.017 (0.961 at Ta=10) | 0.958 (used Ta=10) | 1.02 / 1.00 |
| 94 | Five 1.8-m tiers (Ta=10.1) | Bishop | 1.020 | 1.040 | 1.00 |
VP92 models the paper's hw as pore pressure in the foundation soil only (a drained MSE fill), plus the 3-m pond standing against the lower tier — treating the fill as saturated drops FS to ~0.89 and reconciles with neither program. xslope's free circular search finds slightly more critical circles than Slide's grid on several of these (e.g. 0.99 on the baseline, matching the L&H reference).
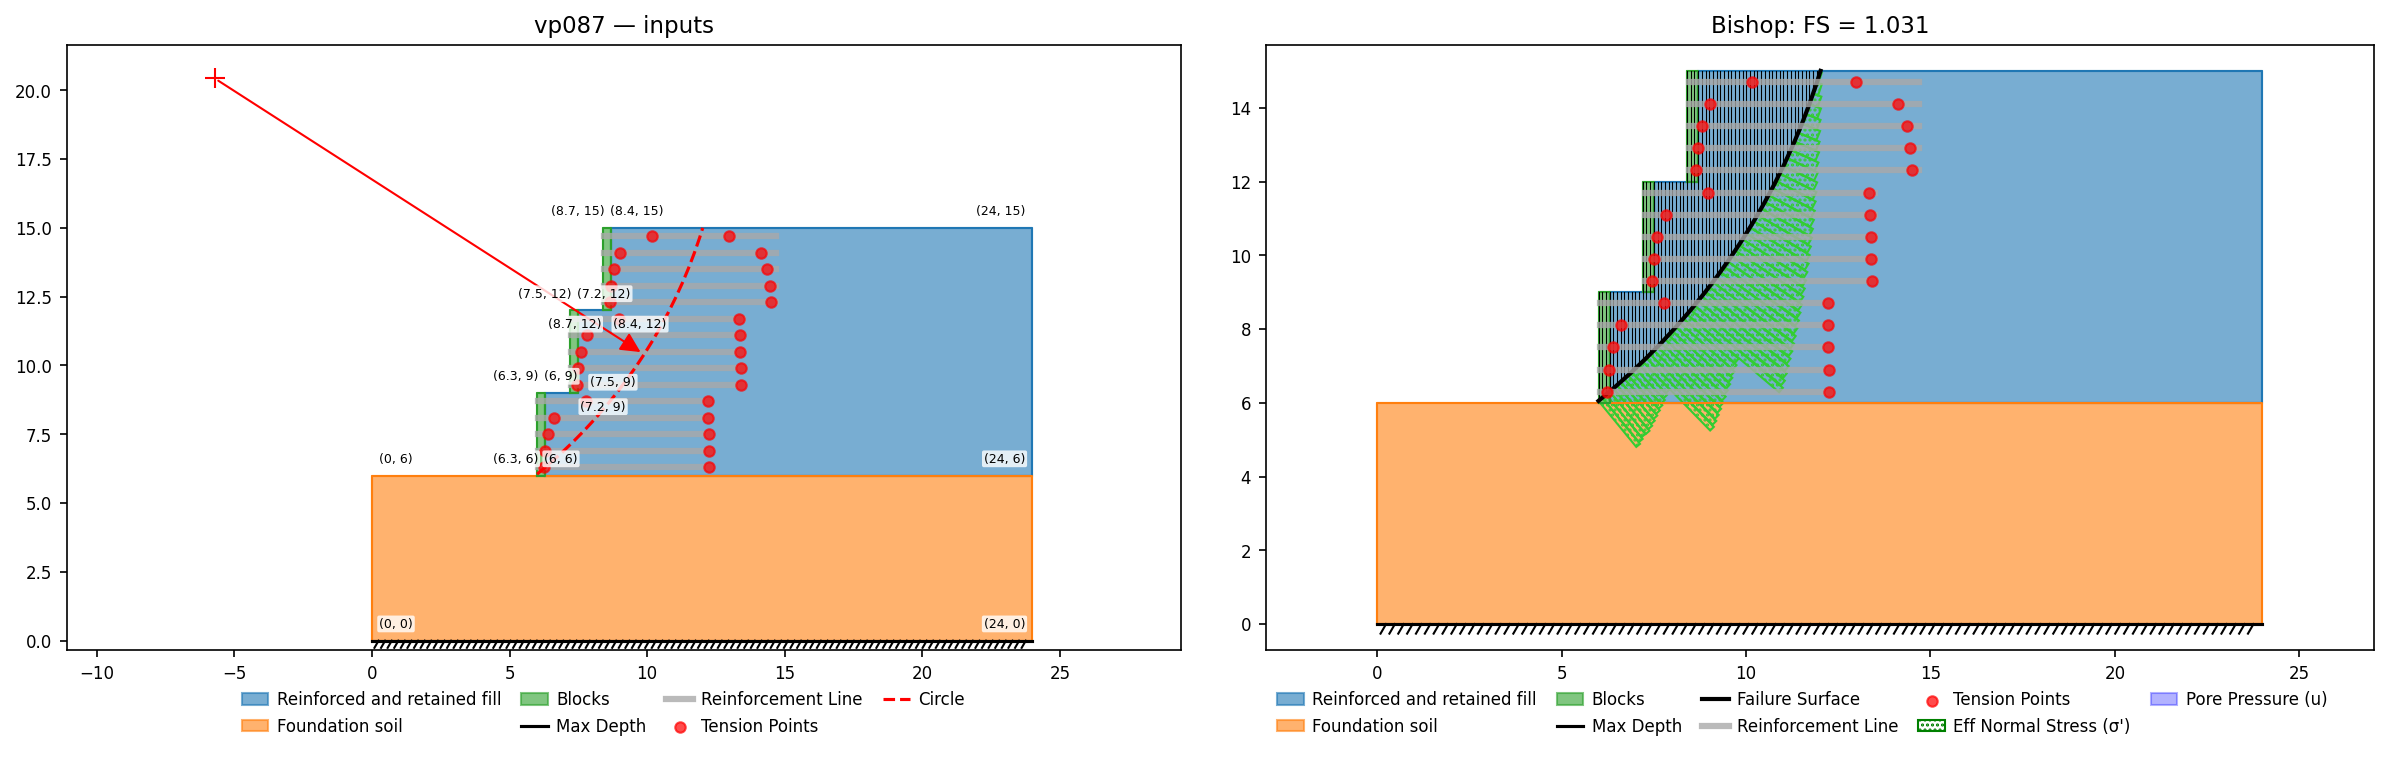
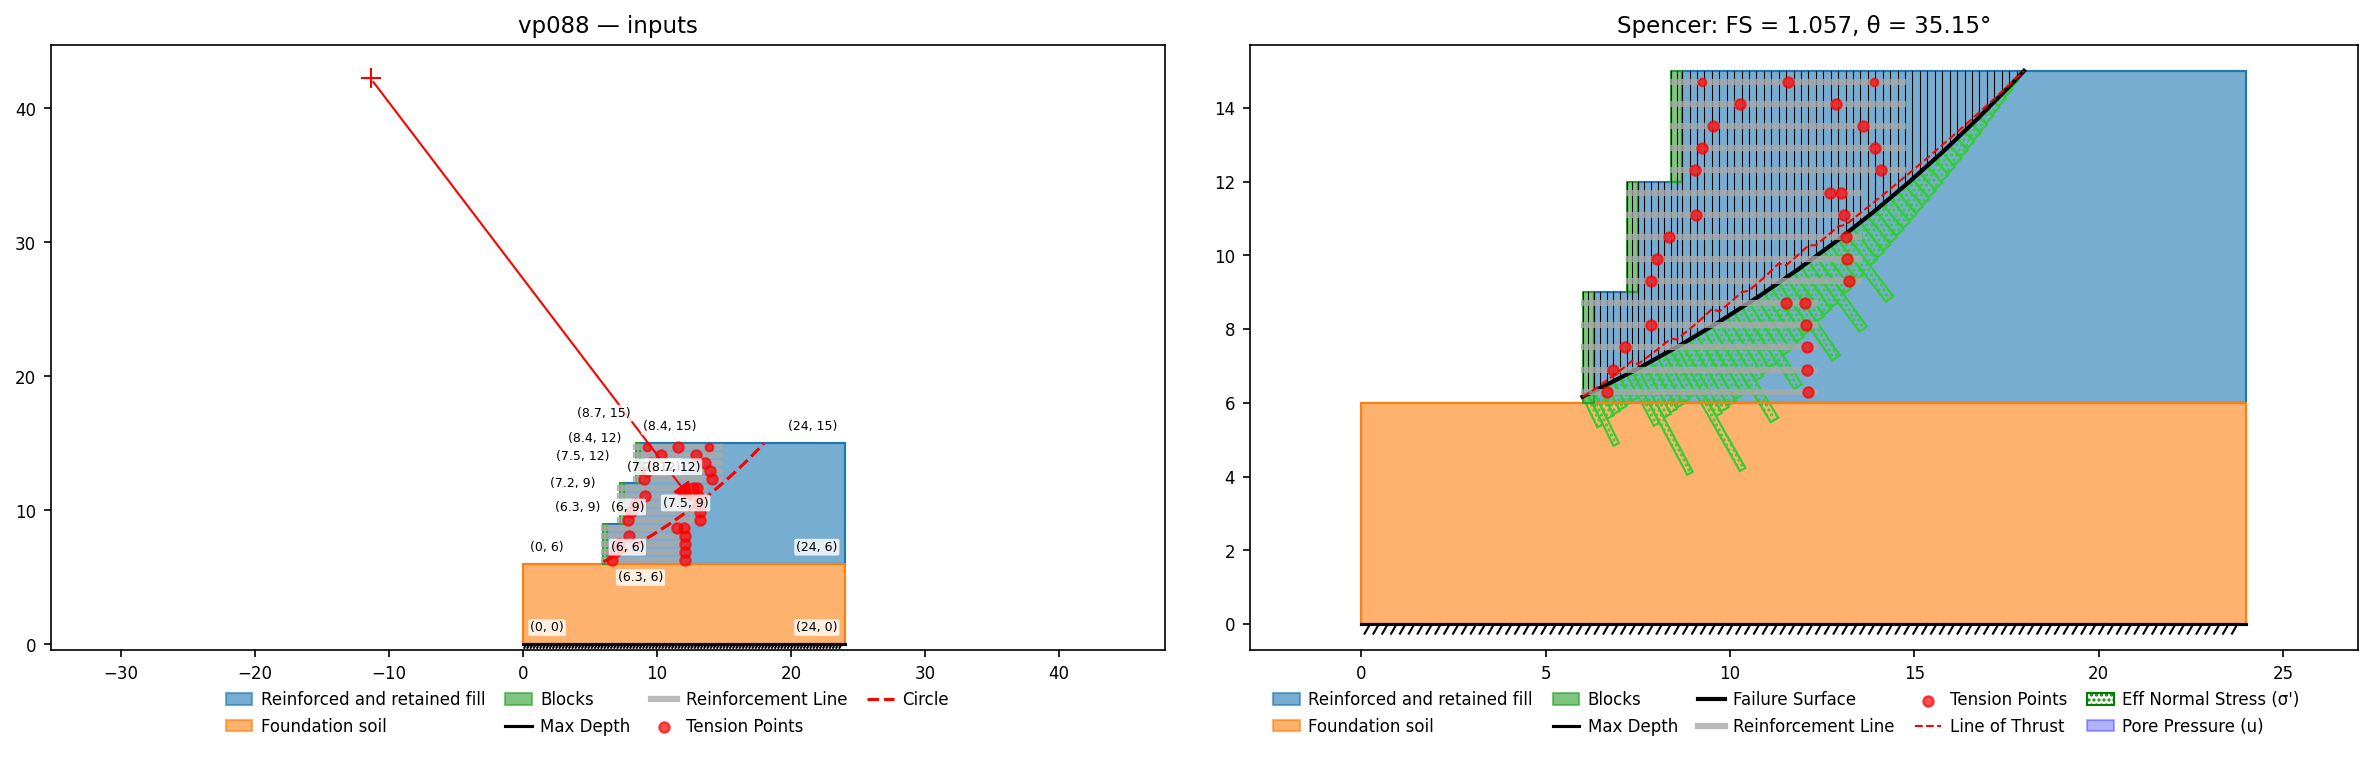
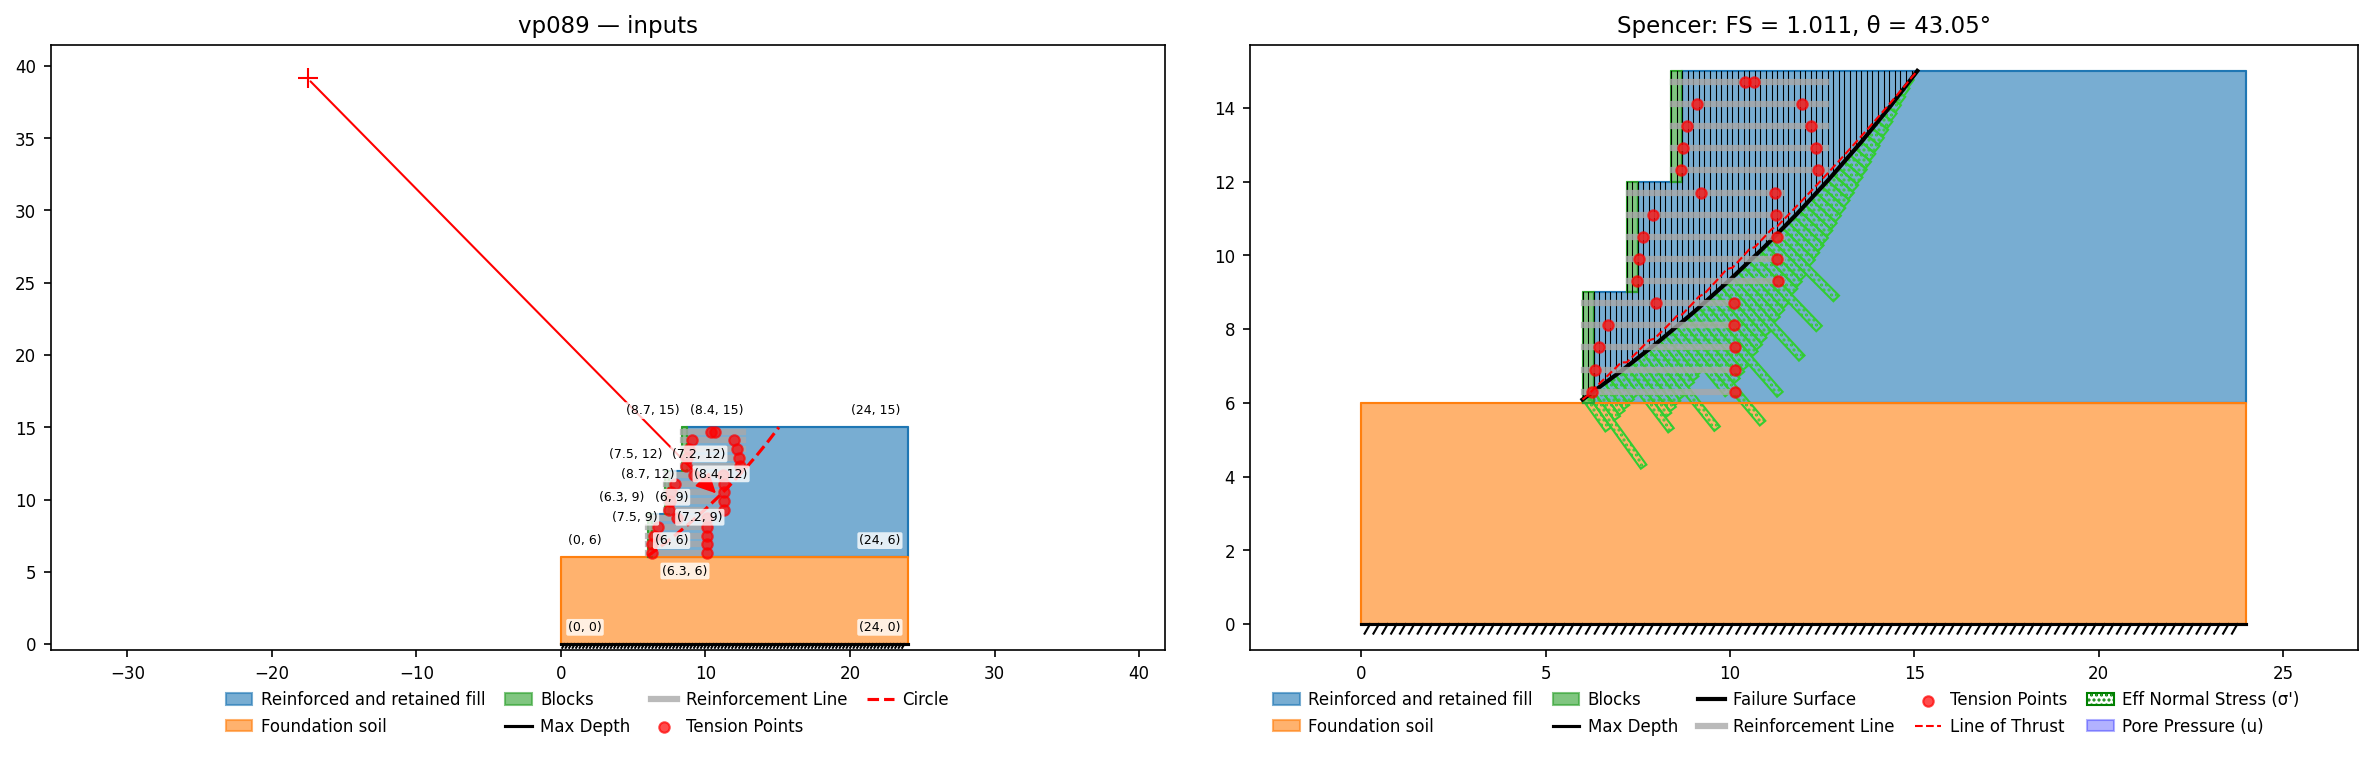
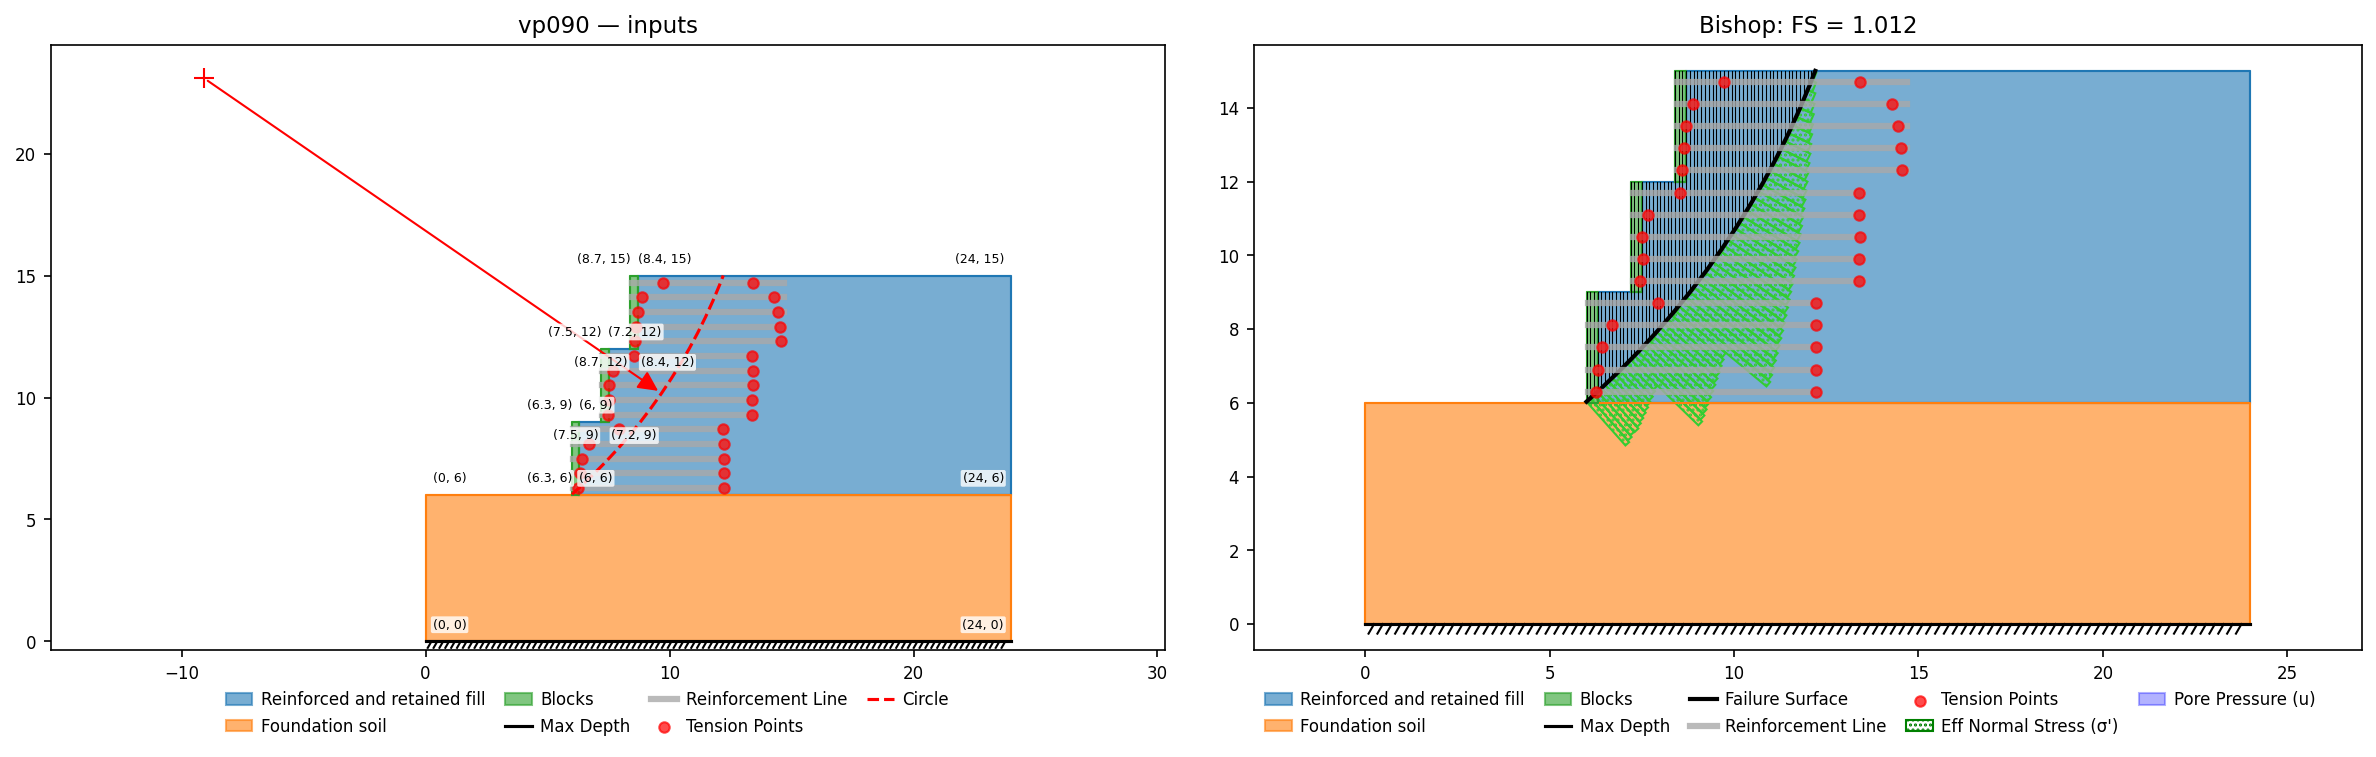
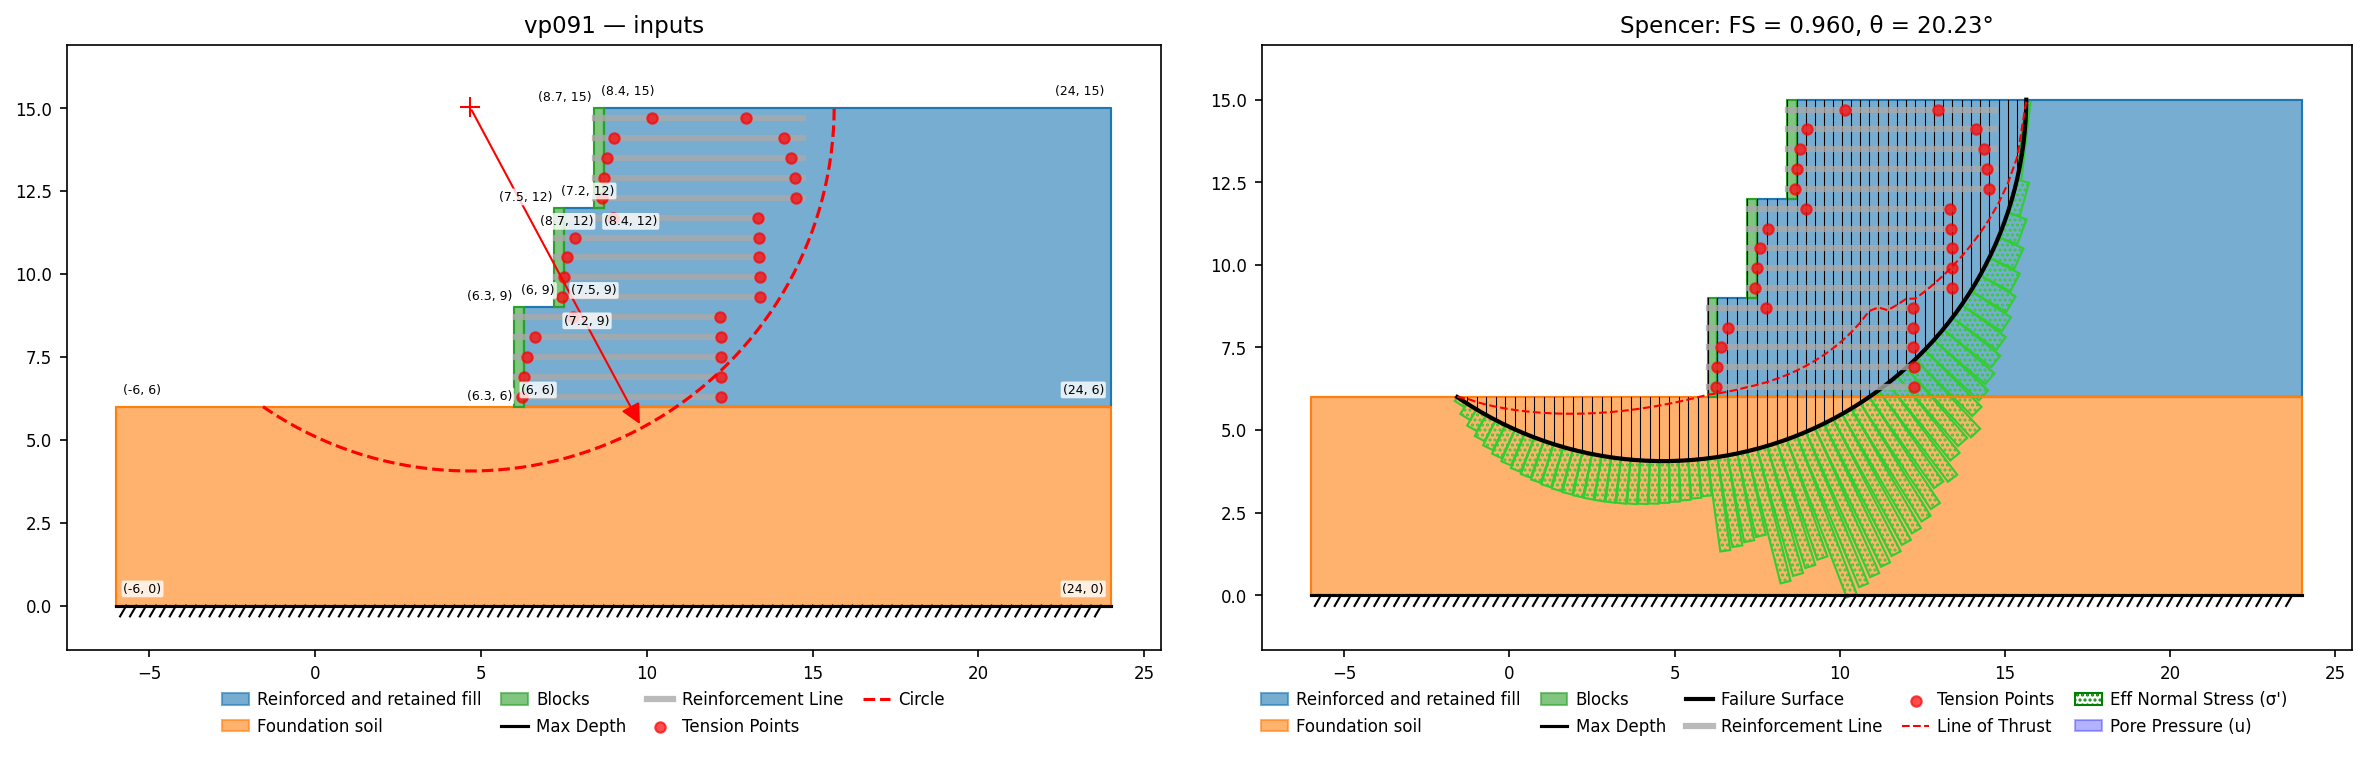
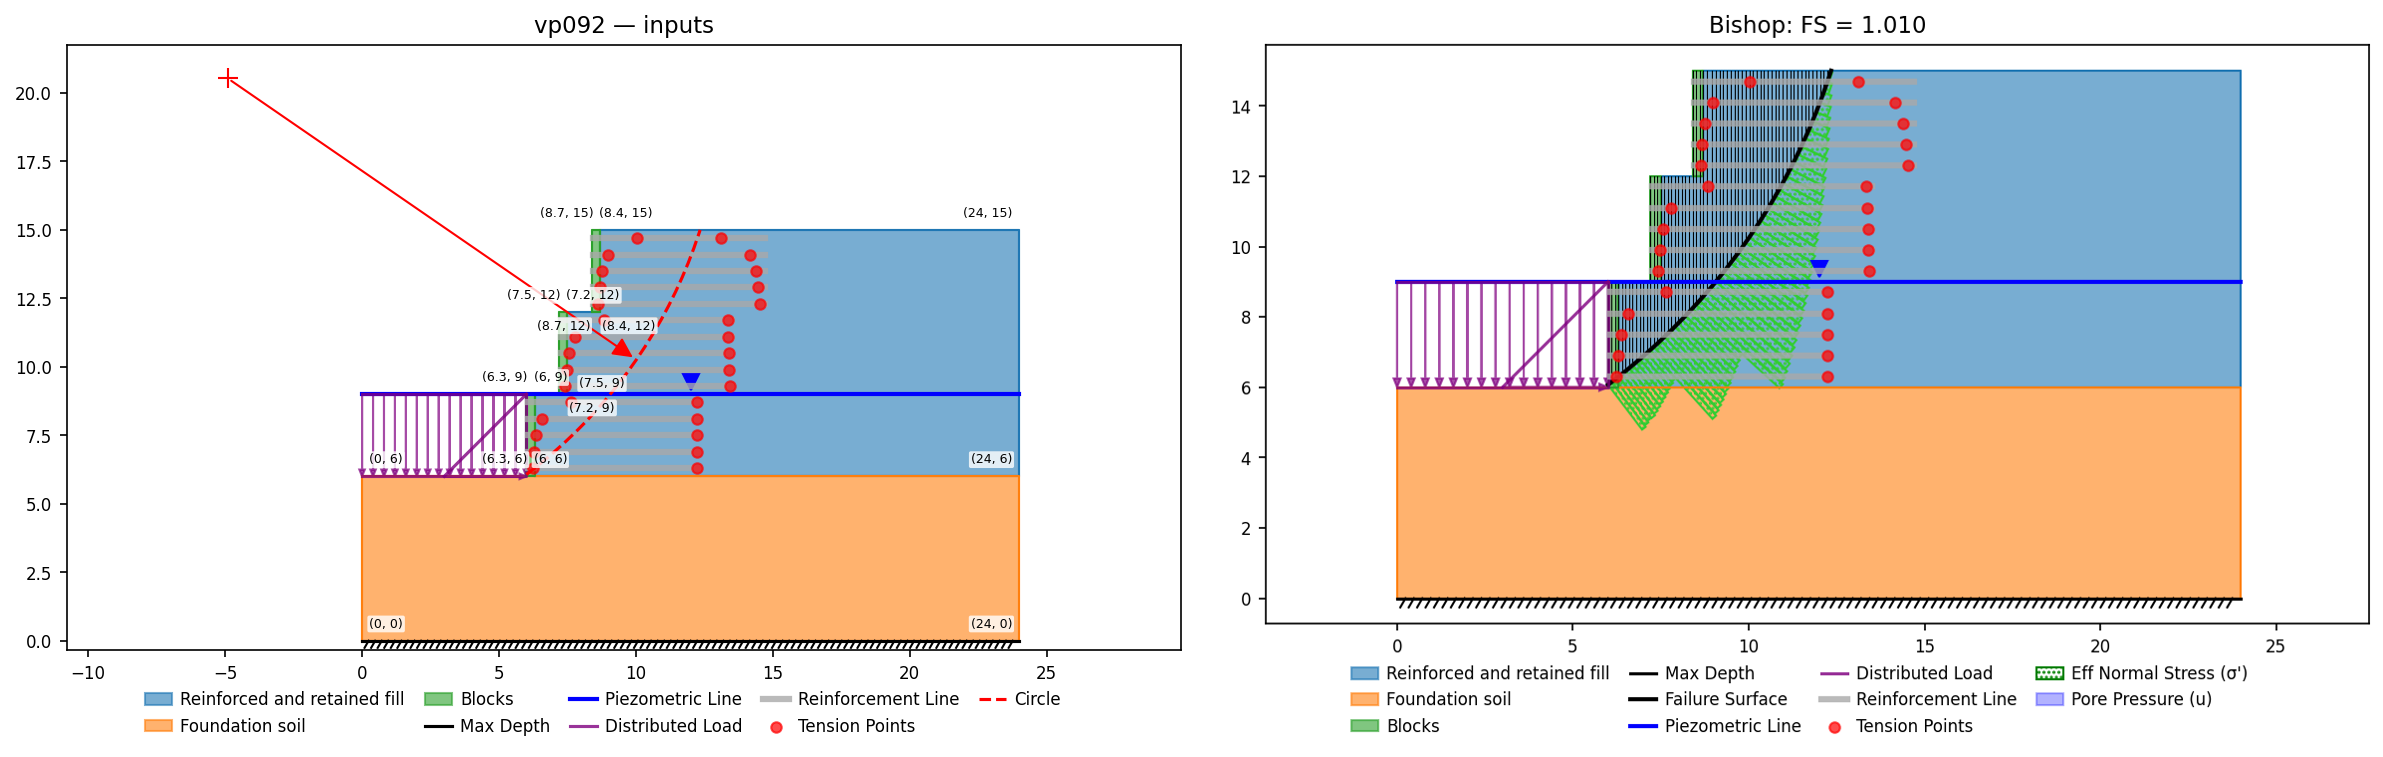
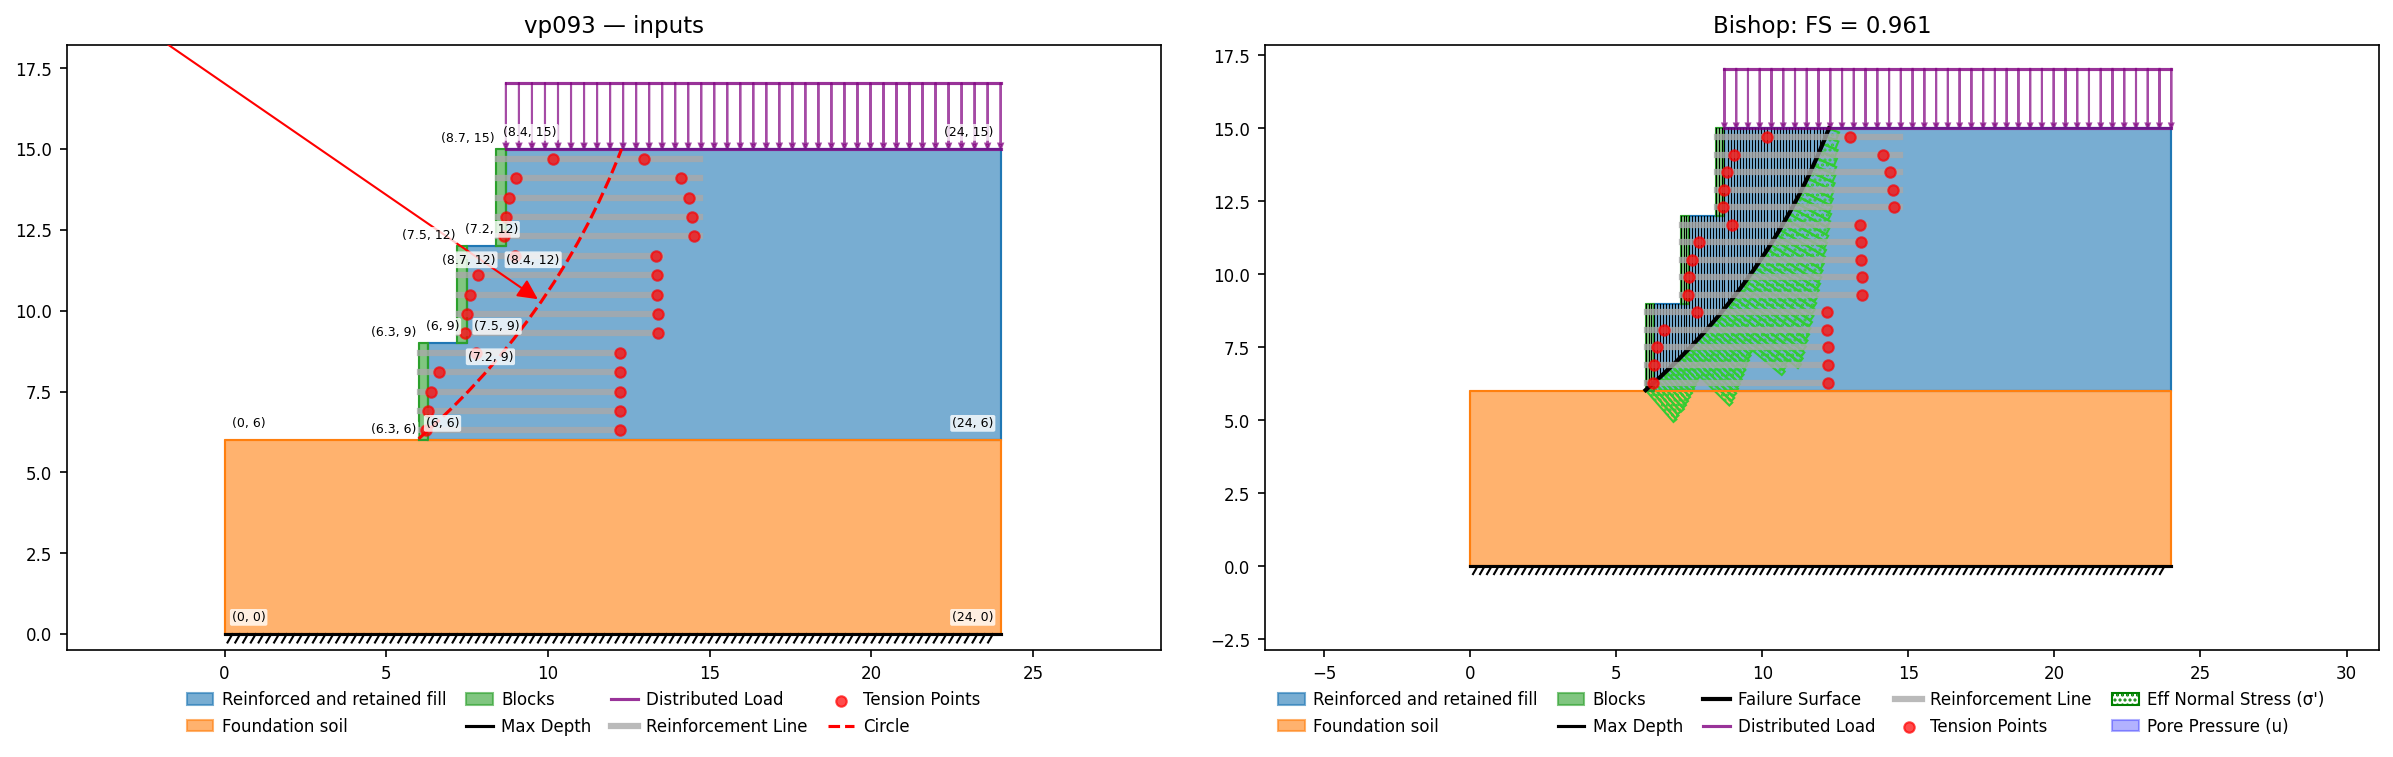
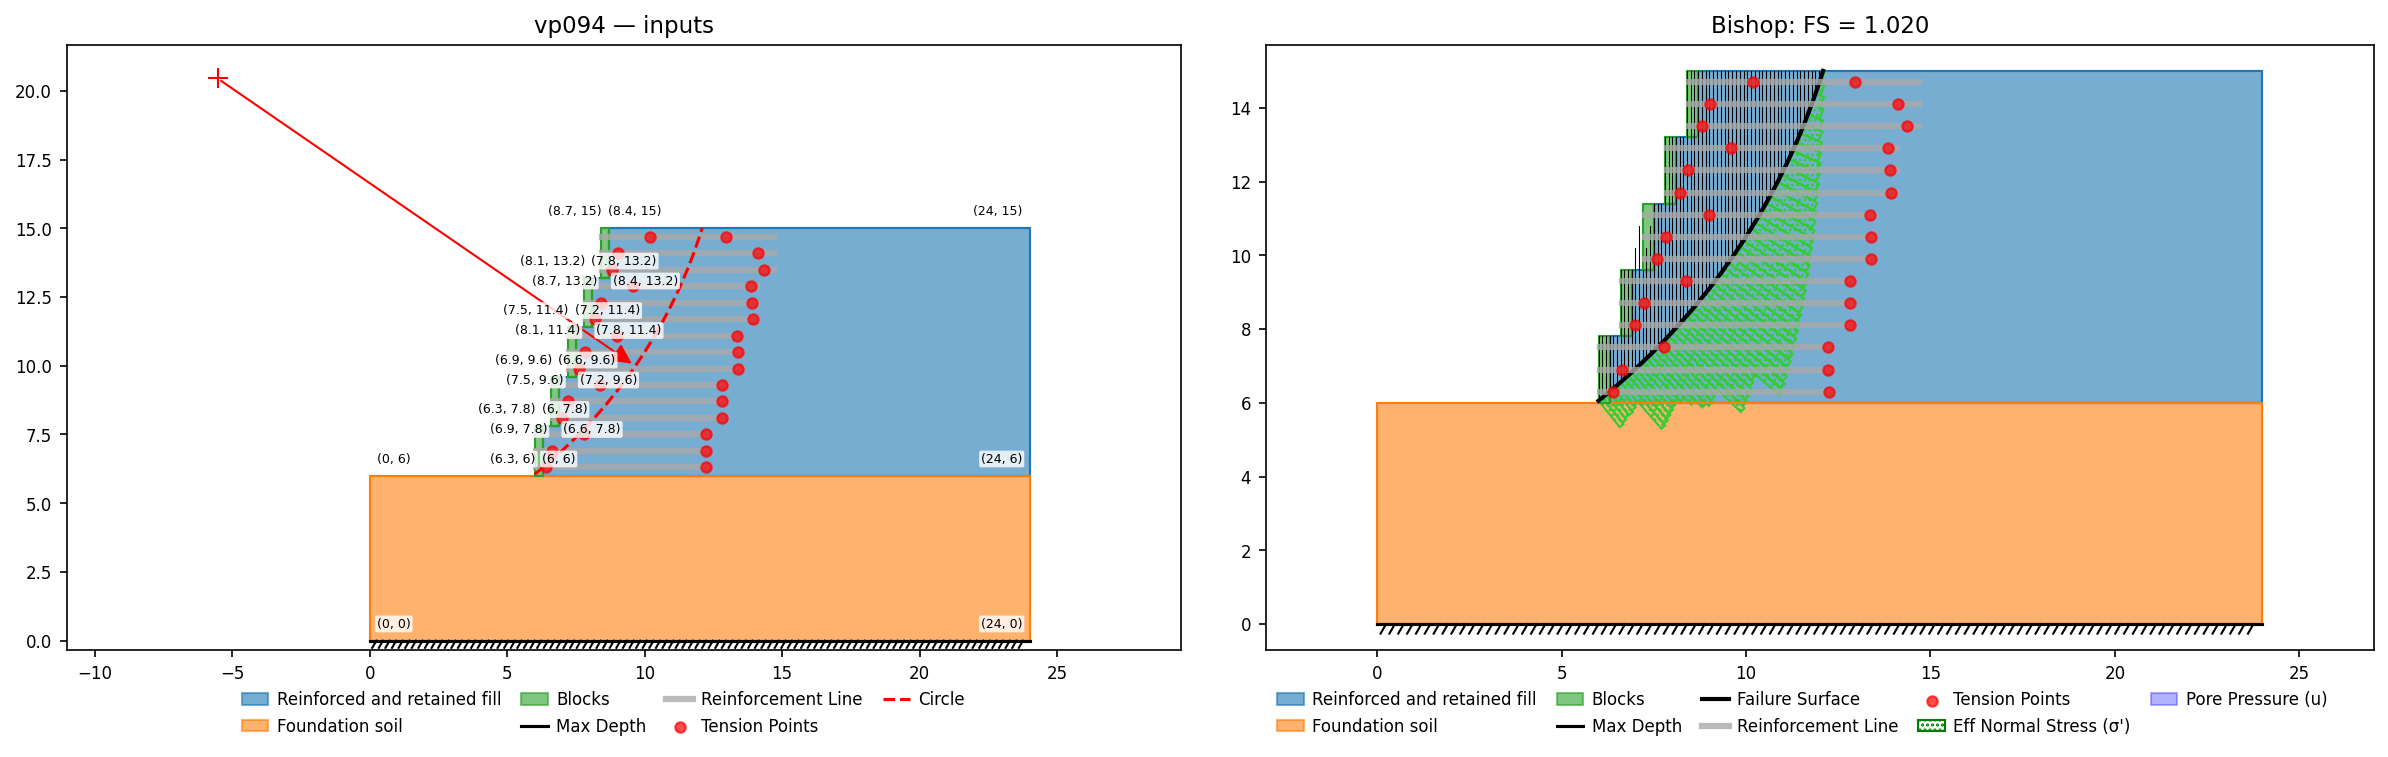
VP96: Embankment dam, homogenous, rapid drawdown, water table
Slide #96 / USACE EM 1110-2-1902 (2003) Appendix G example: 3:1 then 2.5:1 embankment face, max pool el. 103 drawn down to 24, specified circle (169.5, 210, R=210). Material: c'=0, phi'=30, gamma=135 pcf with the Kc=1 envelope d=1379 psf, psi=18.2 deg (Figure G-5). Duncan-Wright- Wong 3-stage: Slide 1.443, USACE reference 1.44. (Slide's #95 runs the same model with the older Corps 2-stage method: 1.347.)
Input files: vp096.xlsx
| Method | XSLOPE | Published |
|---|---|---|
| Bishop | 1.432 | Slide 1.443; USACE 1.44 |
| Spencer | 1.434 | Slide 1.443; USACE 1.44 |
Duncan-Wright-Wong 3-stage on the specified circle; Kc=1 envelope d=1379 psf, ψ=18.2°.
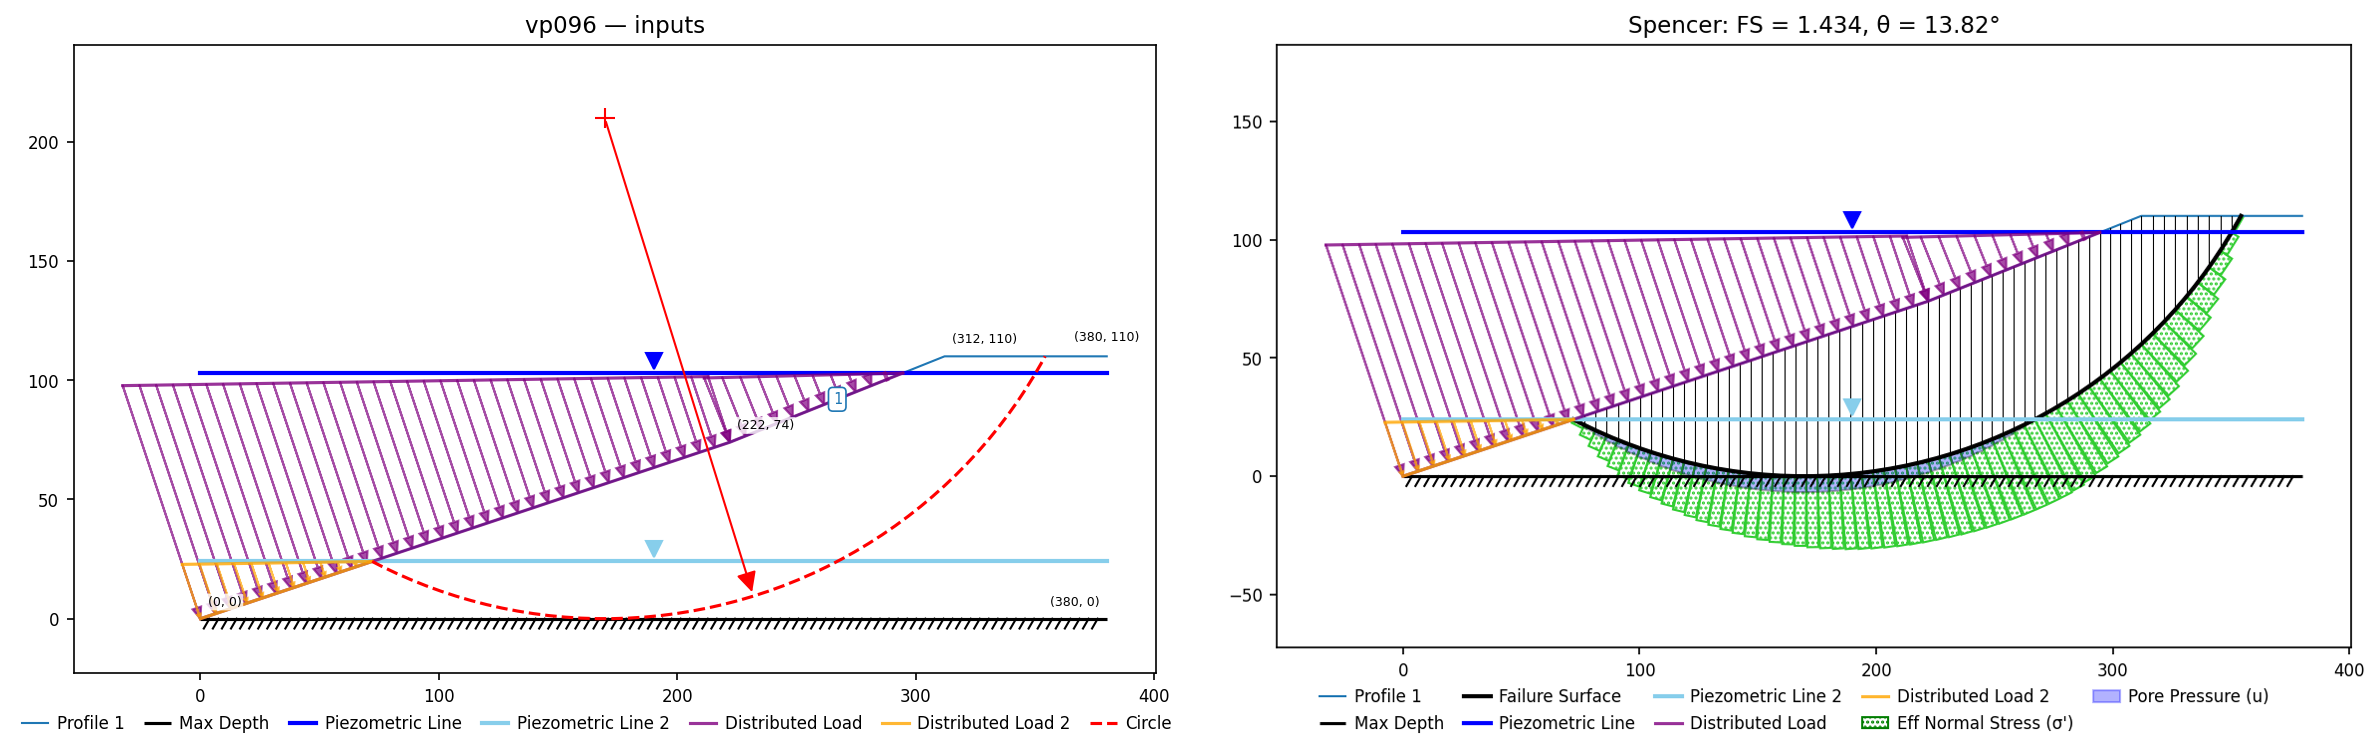
VP97: Embankment dam, homogenous, rapid drawdown, water table
Slide #97: Pilarcitos Dam (Duncan, Wright & Wong 1990). Homogeneous earthfill, gamma=135 pcf, c'=0, phi'=45; R-envelope cR=60 psf, phiR=23. Kc=1 envelope via D&W (2014) eqs 9.6-9.7: d = cR cos(phiR) cos(phi') / (1-sin(phiR)) = 64.1 psf, psi = 24.4 deg (the same equations reproduce the USACE App G values 1379/18.2 exactly). Drawdown 72 -> 37 ft. DWW 3-stage 1.05; Slide 3-stage 1.043 (Corps 2-stage 0.823/0.82).
Input files: vp097.xlsx
| Method | XSLOPE | Published |
|---|---|---|
| Bishop | 1.042 | Slide 1.043; DWW 1.05 |
| Spencer | 1.044 | Slide 1.043; DWW 1.05 |
The dam that actually failed in drawdown sits right at FS ≈ 1.
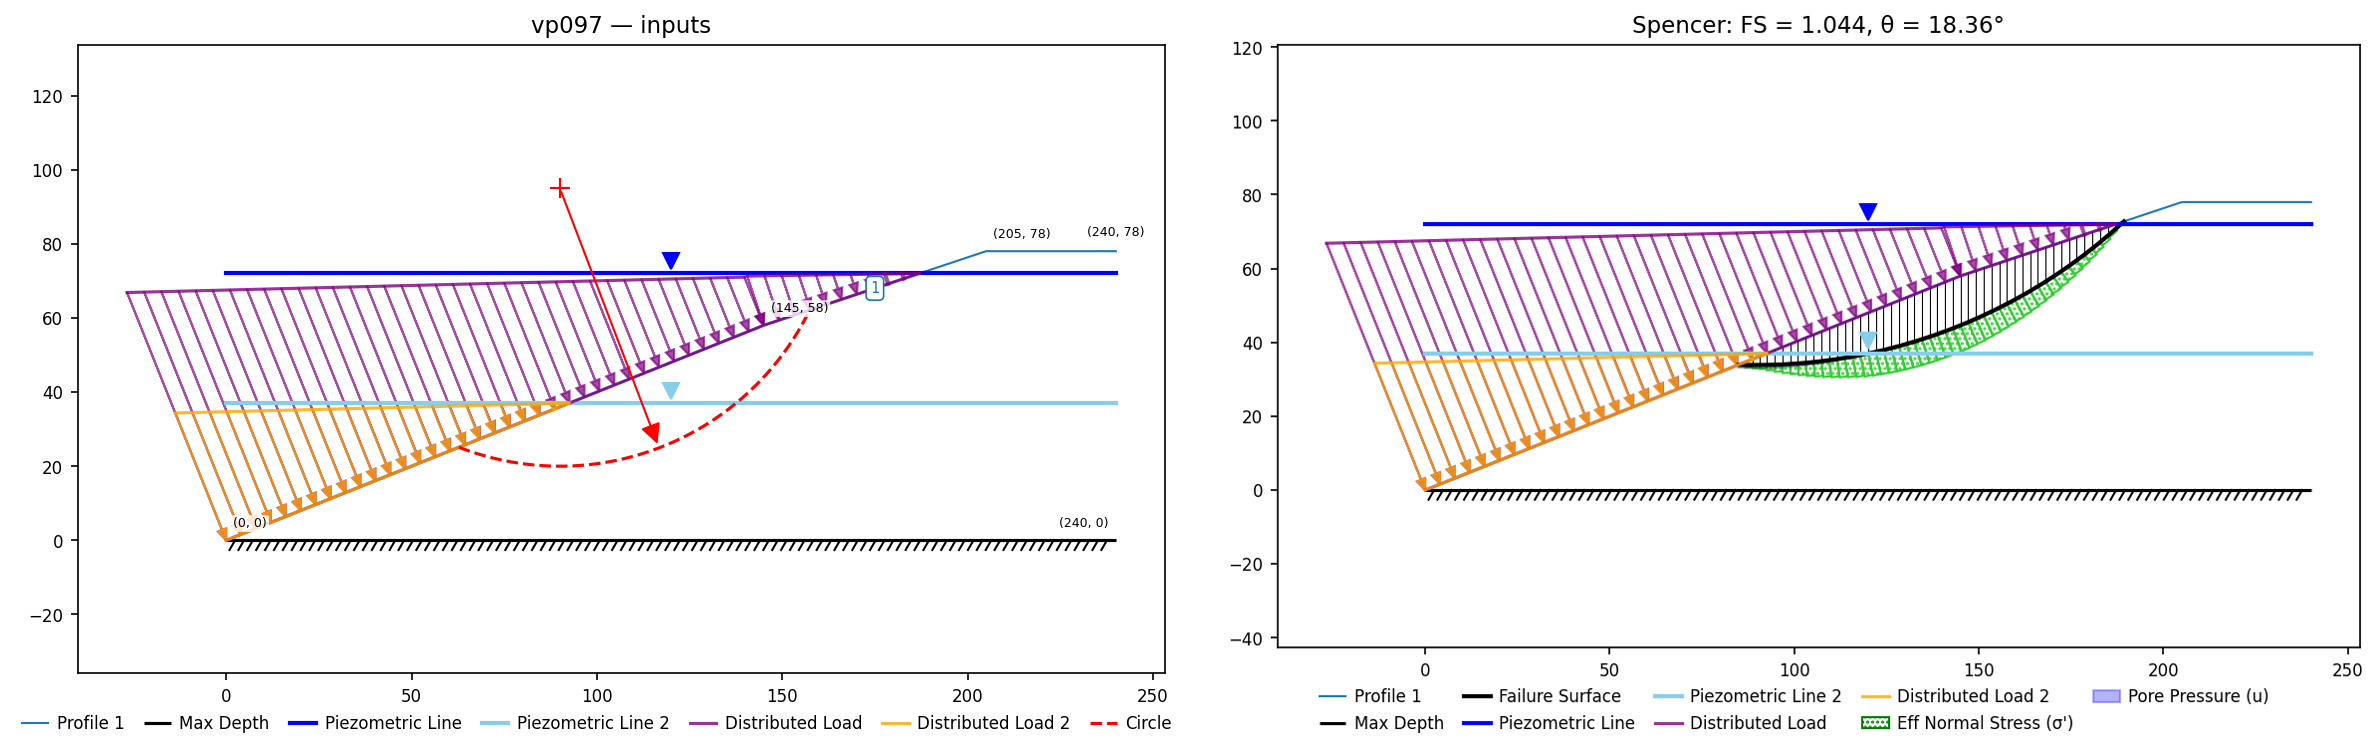
VP98: Walter Bouldin Dam rapid drawdown (Duncan, Wright & Wong 1990)
Slide #98: the Walter Bouldin Dam failure case — a rolled earthfill dam that failed during a 32-ft drawdown in 1975. Pool drops 47 ft → 15 ft. Five zones (riprap, clayey silty sand, micaceous sand, cretaceous clay, clayey sandy gravel) rebuilt from Slide's coordinate-labeled Figure 98.1 with the interior boundaries traced from its color zones (axis-calibrated, ±1 ft); the Kc=1 undrained envelopes come from the paper's own Table 2 — (750 psf, 15°), (480, 13°), (280, 15.5°) — with riprap and gravel drained.
Input files: vp098.xlsx
| Method | XSLOPE | Published |
|---|---|---|
| DWW 3-stage (Spencer, circular search) | 1.046 | Slide 1.039; DWW 1.04 |
The critical circle ((52,21)→(157,60)) falls where the dam actually slid. Slide's Corps 2-stage (0.931) and Lowe & Karafiath (1.075) rows exercise staged procedures xslope does not implement.
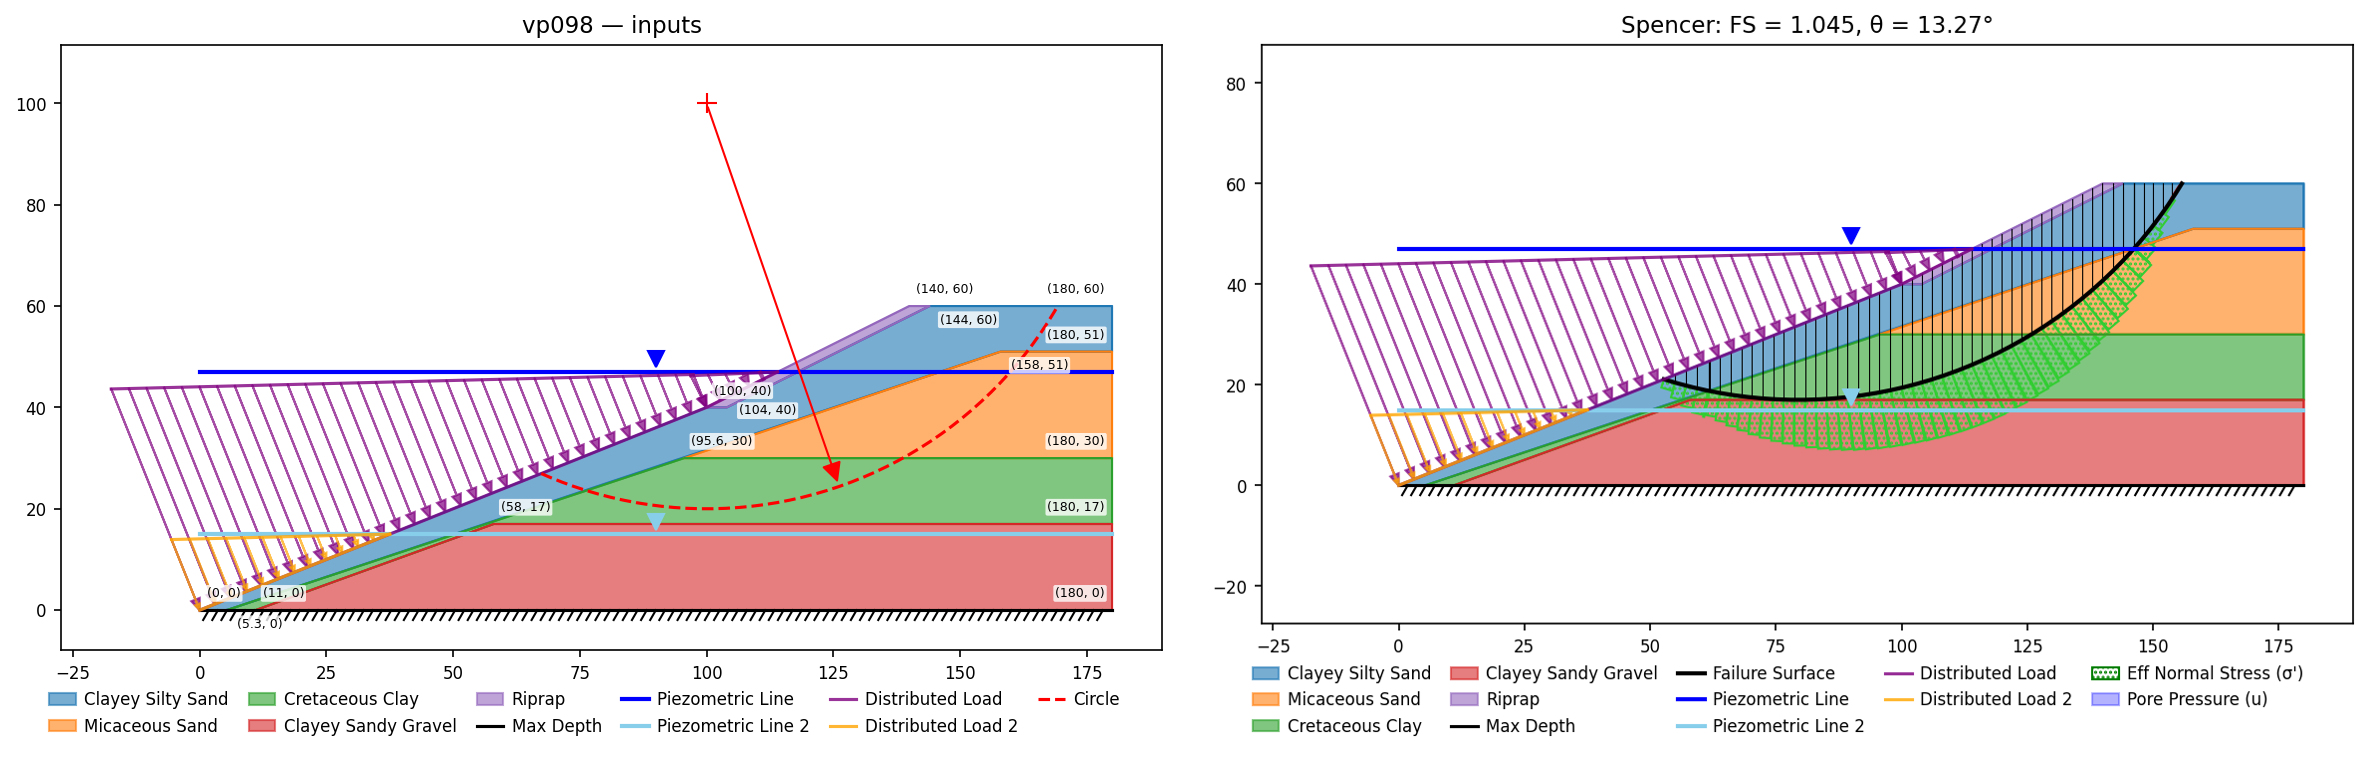
VP99: Pumped-storage project dam rapid drawdown (DWW 1990)
Slide #99: the paper's hypothetical pumped-storage dam — silty clay core and random zone (c′=0, φ′=36°, Kc=1 envelope 2250 psf/20°), free-draining rockfill shells (φ′=37°), drawdown 285 ft → 120 ft (paper El 545 → 380). The core and random zone carry identical strengths, so only the rockfill/clay boundary affects the result.
The geometry is re-pinned from the vendor GeoStudio model of the same DWW problem (SLOPE/W §2.42, "Staged rapid drawdown – Pumped Storage Project Dam.gsz"), read with xslope.geostudio.read_gsz. The original build was traced by eye from Slide's unlabeled Figure 99.1 and came out ≈19 ft short in crest-to-base height (dam 281 ft rather than 300), which left FS ≈7% low. The .gsz point table fixes it exactly: its frame, translated by y−260 to keep the 285/120 pool levels, puts the base at −10, crest at 290, and the three upstream benches at el. 60/120/190. The two vendors' figures genuinely differ (berm elevations, core width); GeoStudio's is the one that matches the published FS.
Input files: vp099.xlsx
| Method | XSLOPE | Published |
|---|---|---|
| DWW 3-stage (Spencer, circular search) | 1.527 | Slide 1.534; SLOPE/W 1.550; DWW 1.56 |
With the vendor geometry, XSLOPE lands within 0.5% of Slide (1.527 vs 1.534) and inside the Slide / SLOPE/W / DWW band (1.53–1.56), closing the earlier ≈7% gap. Tagged as a regression lock.
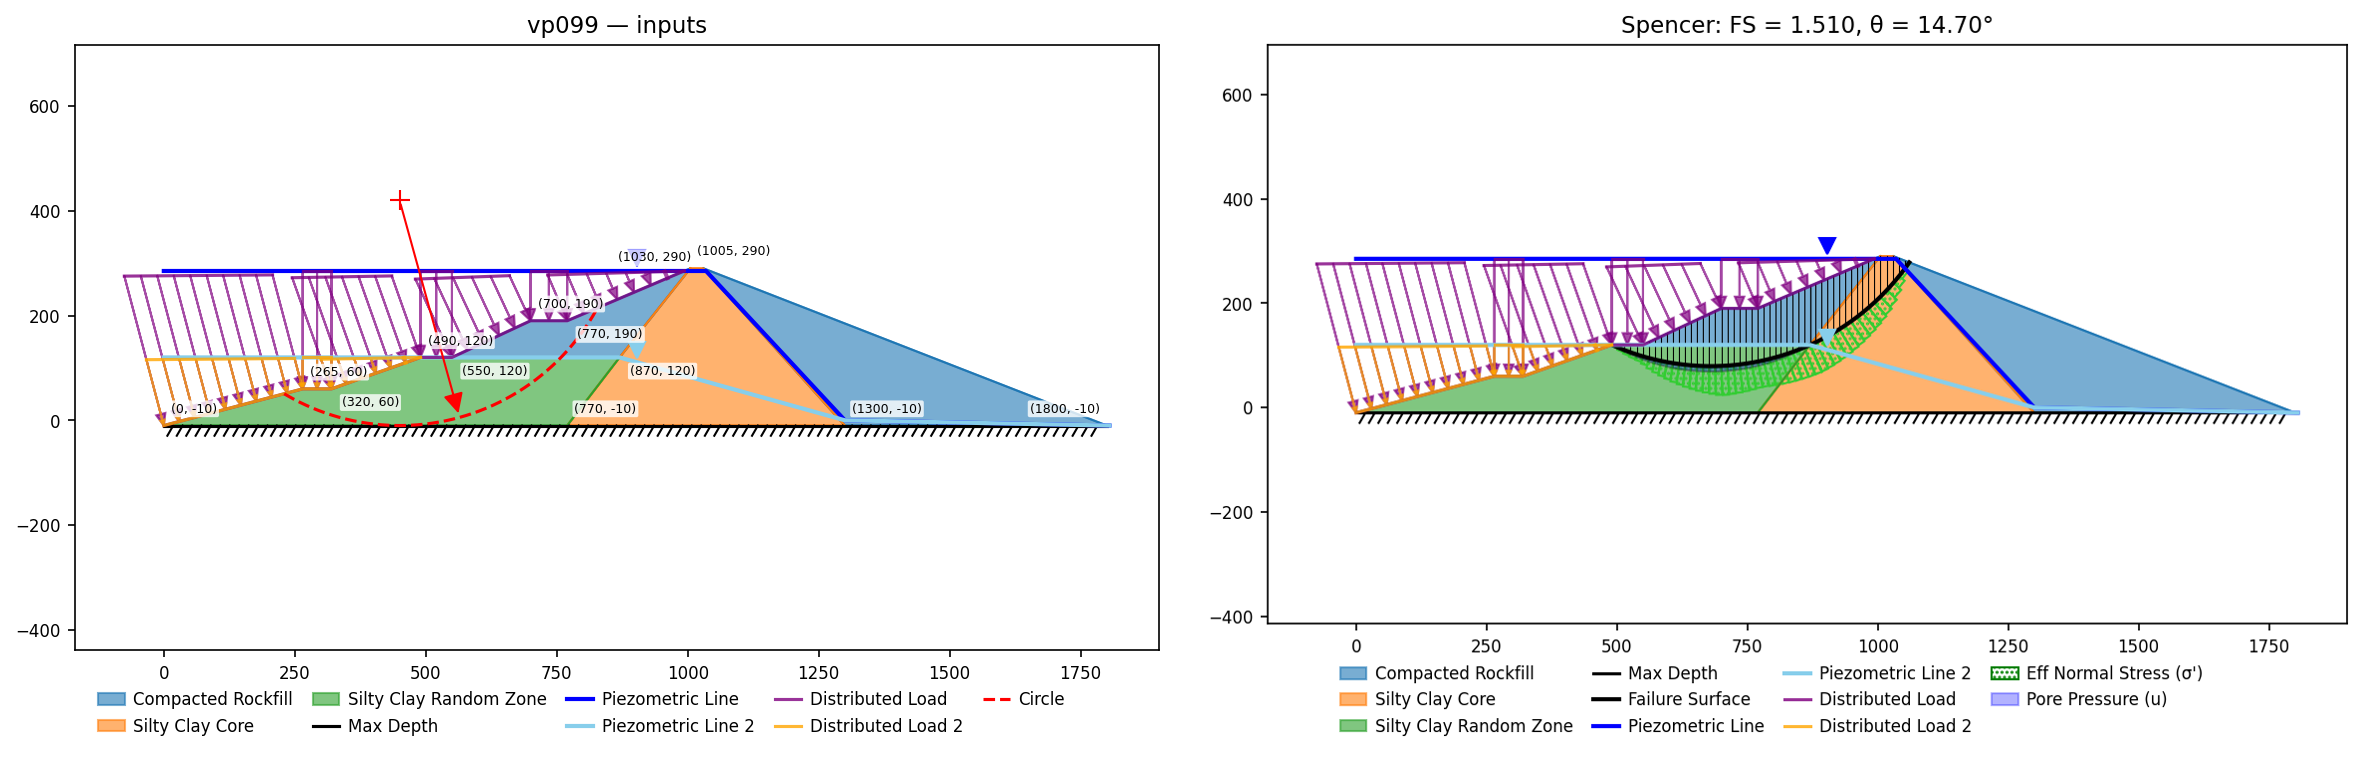
VP100: Embankment dam, homogenous, rapid drawdown, water table
Slide #100: complete drawdown (100 -> 0), B-bar = 1: the residual pore pressure is hydrostatic below the slope surface, i.e. piezo = ground, no external pond. Slide B-bar method 1.212; Morgenstern chart 1.20.
Input files: vp100.xlsx
Complete drawdown (100 → 0)
| Method | XSLOPE | Published |
|---|---|---|
| Bishop | 1.201 | Morgenstern chart 1.20; Slide (B-bar) 1.212 |
| Spencer | 1.206 | — |
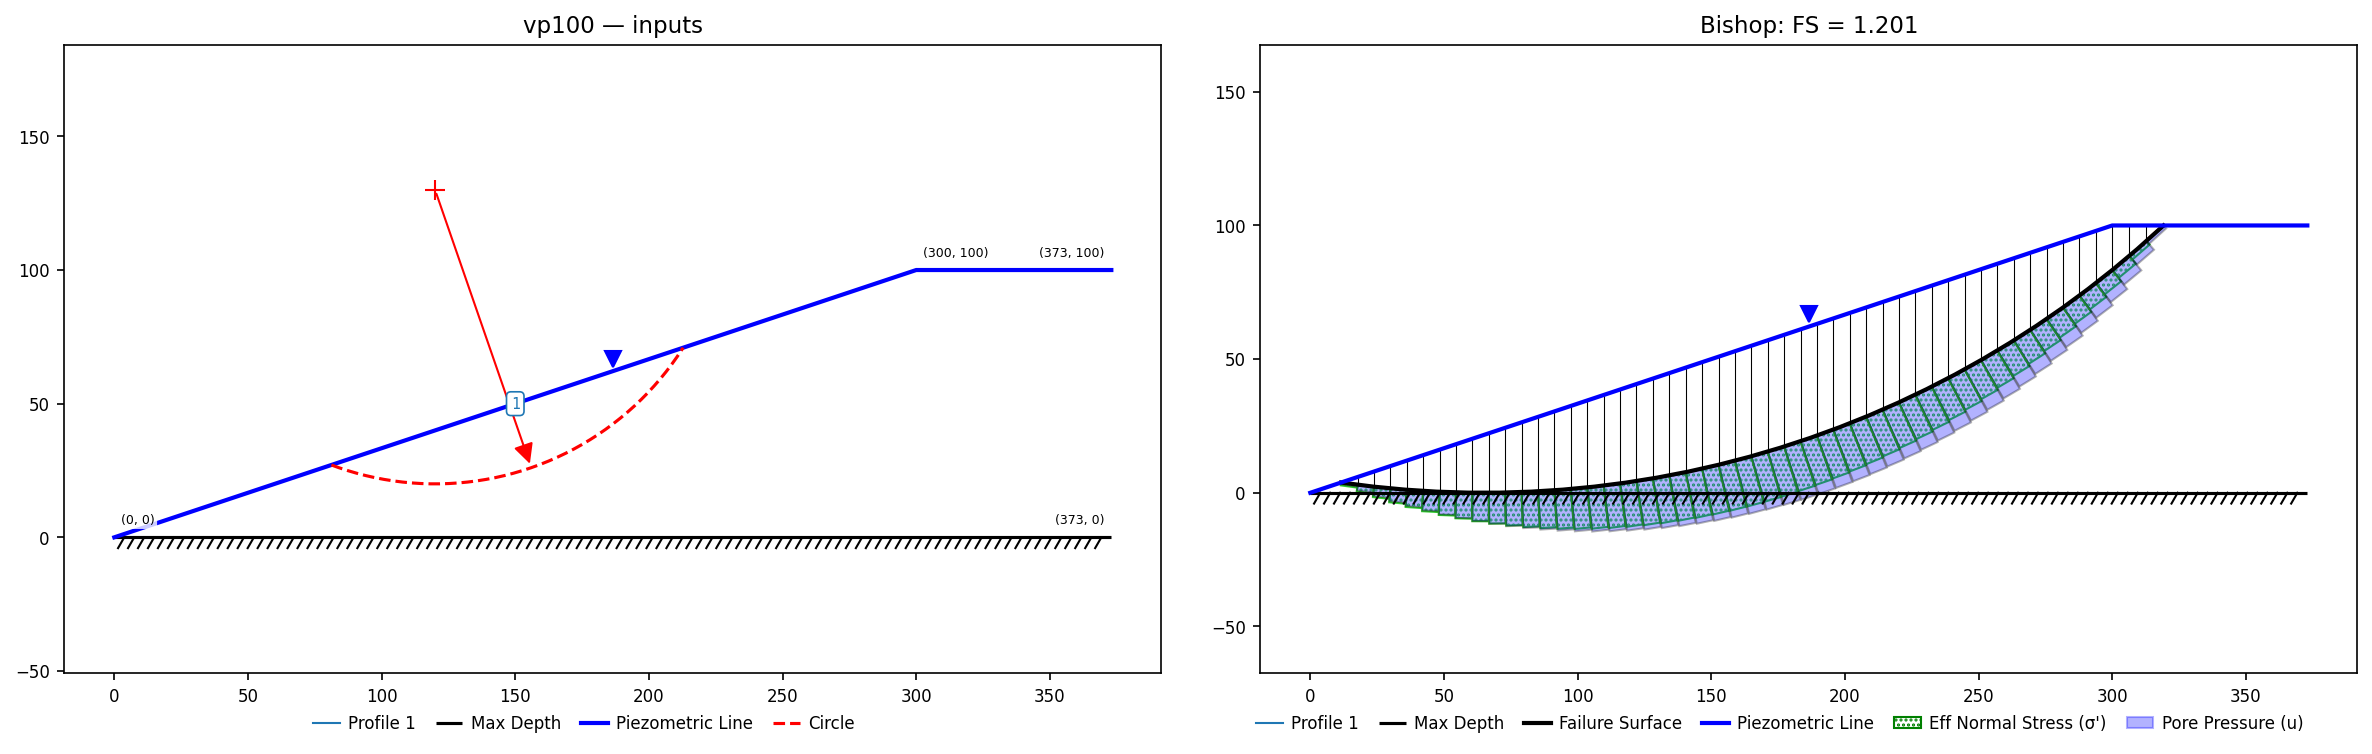
VP101: Embankment dam, homogenous, rapid drawdown, water table
Slide #101: partial drawdown (100 -> 50), B-bar = 1: piezo follows the ground where the face is above the pool and stays at 50 below it, with the remaining pond loading the submerged face. Slide 1.417; Morgenstern chart 1.41.
Input files: vp101.xlsx
Partial drawdown (100 → 50)
| Method | XSLOPE | Published |
|---|---|---|
| Bishop | 1.416 | Slide 1.417; Morgenstern chart 1.41 |
| Spencer | 1.422 | — |
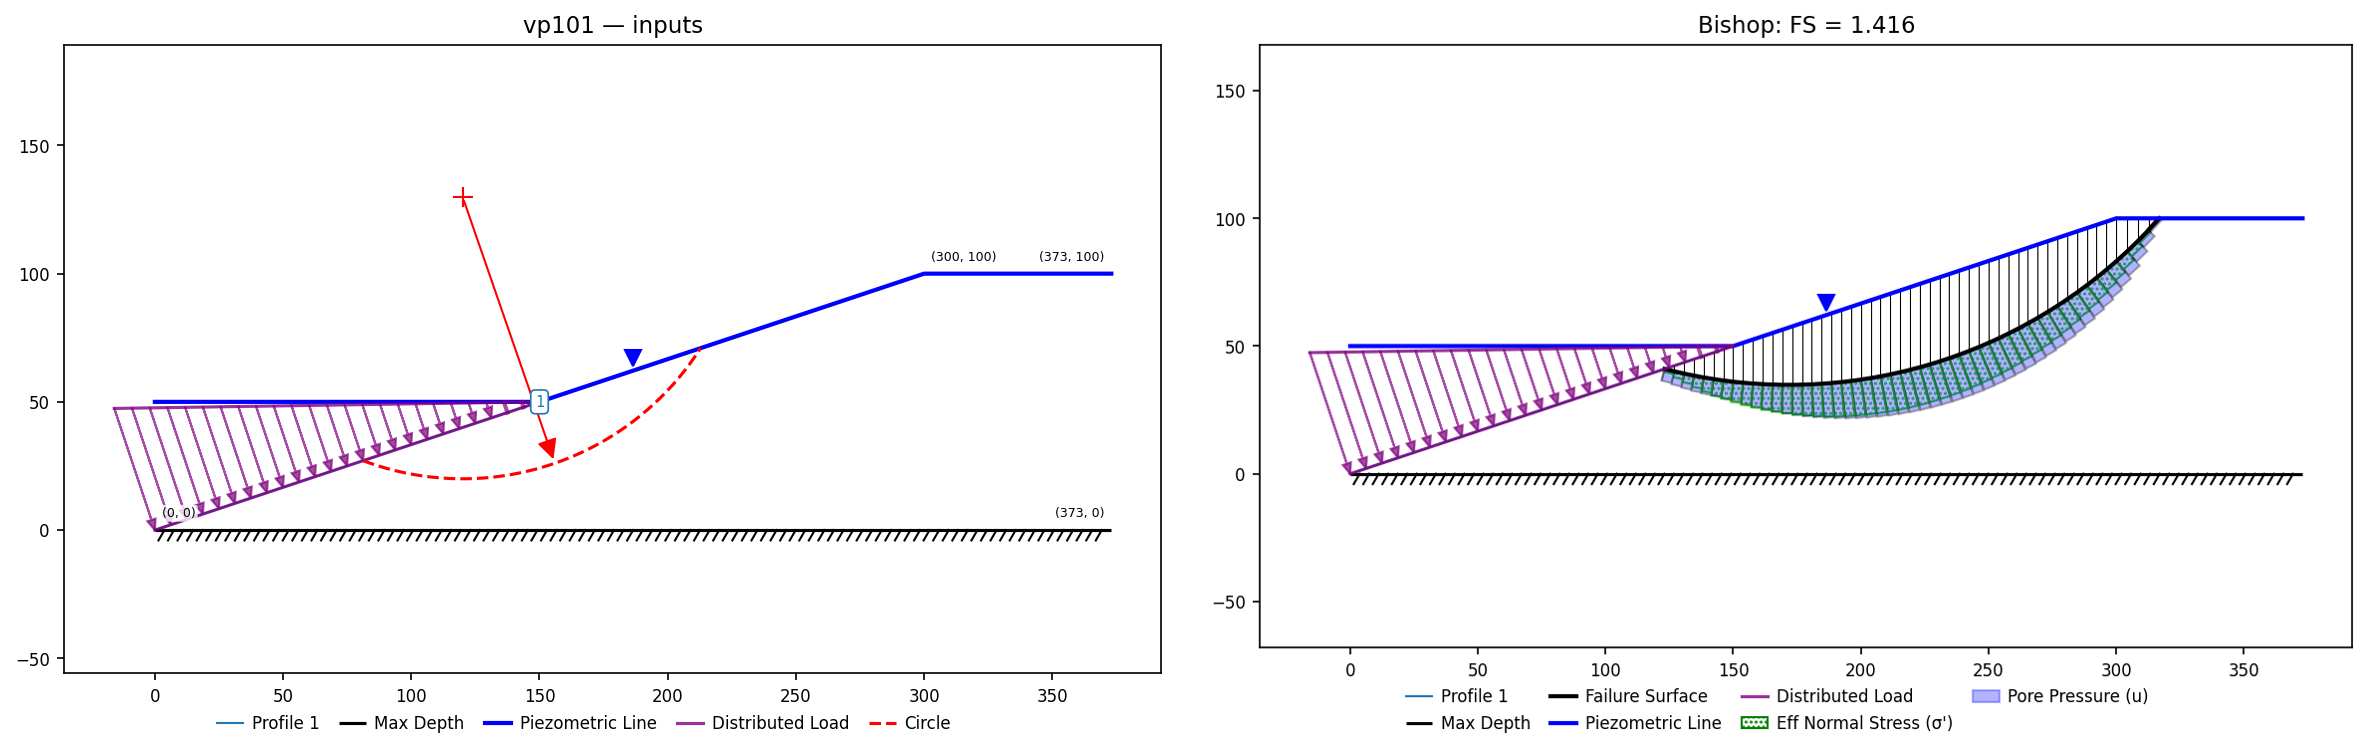
VP102: Earth dam before rapid drawdown (Huang & Jia 2008)
Slide #102 / Huang & Jia (2008), Strength reduction FEM in stability analysis of soil slopes subjected to transient unsaturated seepage: a homogeneous earth dam (c' = 13.8 kPa, φ' = 37°, γ = 18.2 kN/m³; ground (0,7)–(34,7)–(87,24)–(100,29)–(107,29)–(158,7)–(191,7)) with the reservoir at el. 24 — the upstream face breaks slope exactly at the waterline.
The bulk of the Slide problem is a transient drawdown series (factors of safety at 60–1500 h for φb = 0° and 37°). XSLOPE has no transient unsaturated seepage, so this entry reproduces the two end members Slide reports separately: the dry dam, and the initial steady-state seepage condition from which the drawdown starts (pool at el. 24, tailwater at the downstream ground, pore pressures from XSLOPE's FE seepage solver).
Input files: vp102a.xlsx (dry), vp102b.xlsx (initial steady seepage)
| Case | Method | XSLOPE | Published |
|---|---|---|---|
| Dry | Bishop / Spencer | 2.381 / 2.379 | Slide 2.455; Huang & Jia 2.43 |
| Steady state (t = 0) | Bishop / Spencer | 1.711 / 1.719 | Slide 1.745; Huang & Jia 1.70 |
Both critical surfaces are shallow wedges on the downstream face, which makes them sensitive to the toe geometry: on Slide's own printed circles XSLOPE gives 2.390 and 1.721, so the search is not the source of the difference. The steady-state case straddles the two references (−1.5% from Slide, +1.1% from Huang & Jia); the dry case sits 1.7% below Huang & Jia's strength-reduction FEM value, which is the primary reference here.
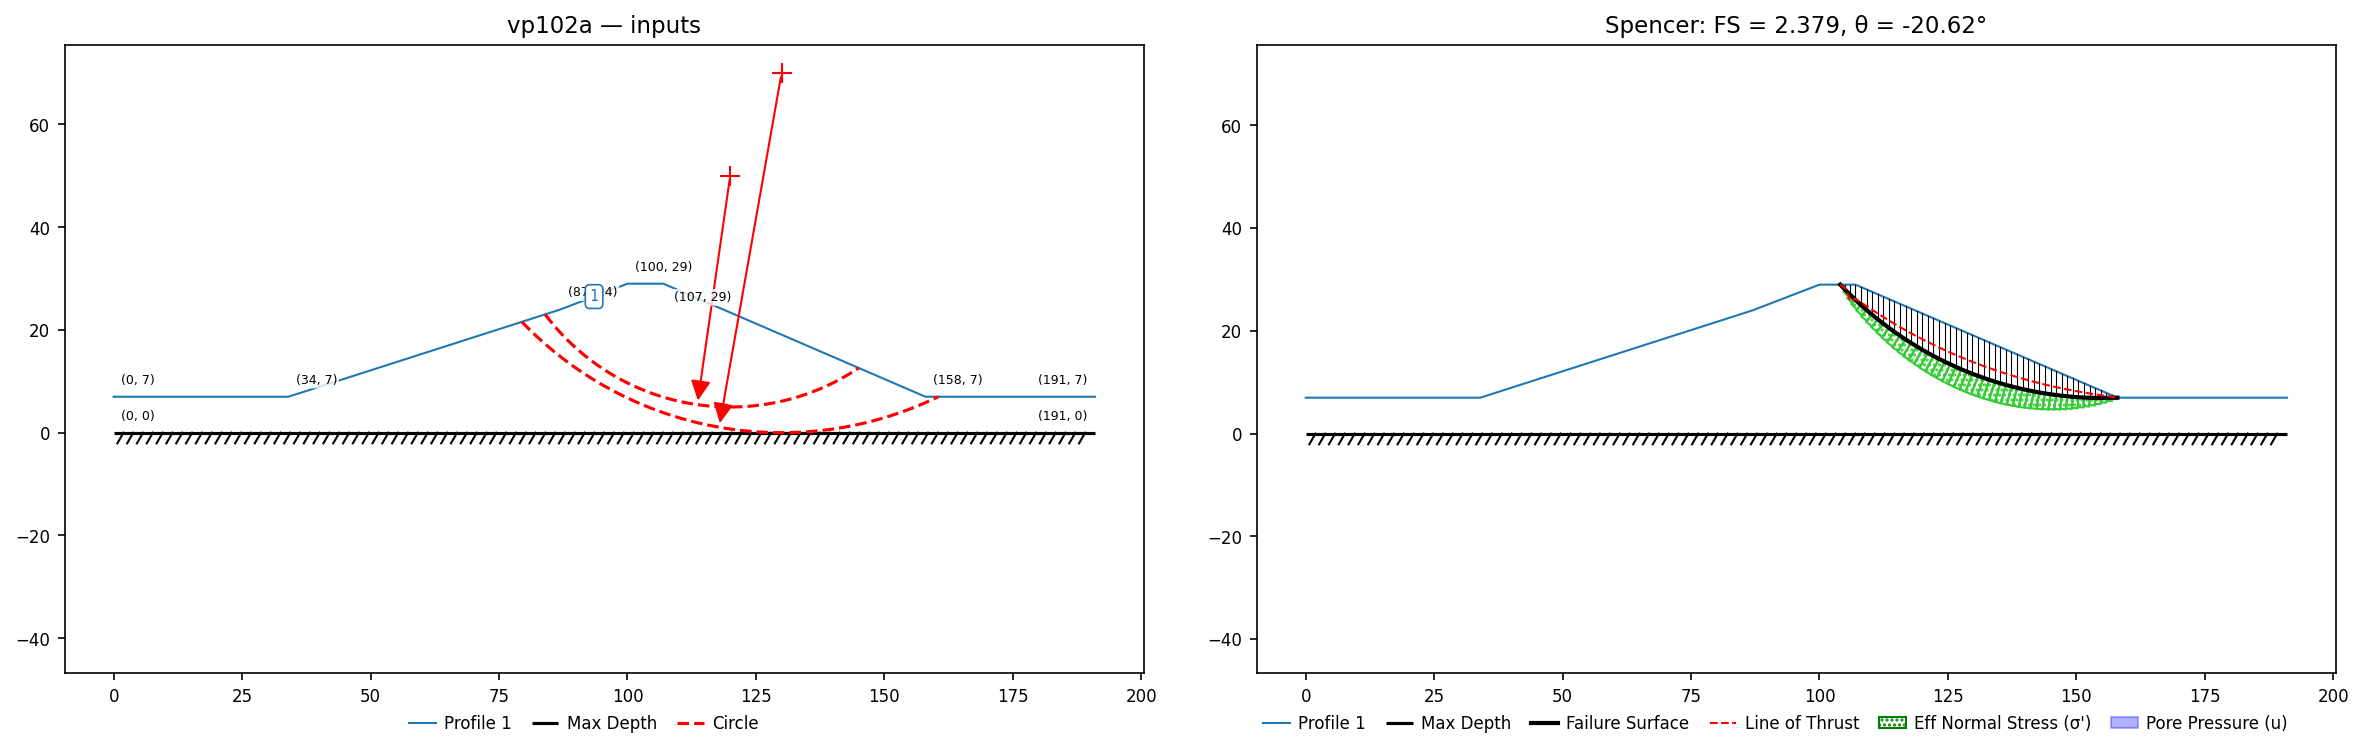
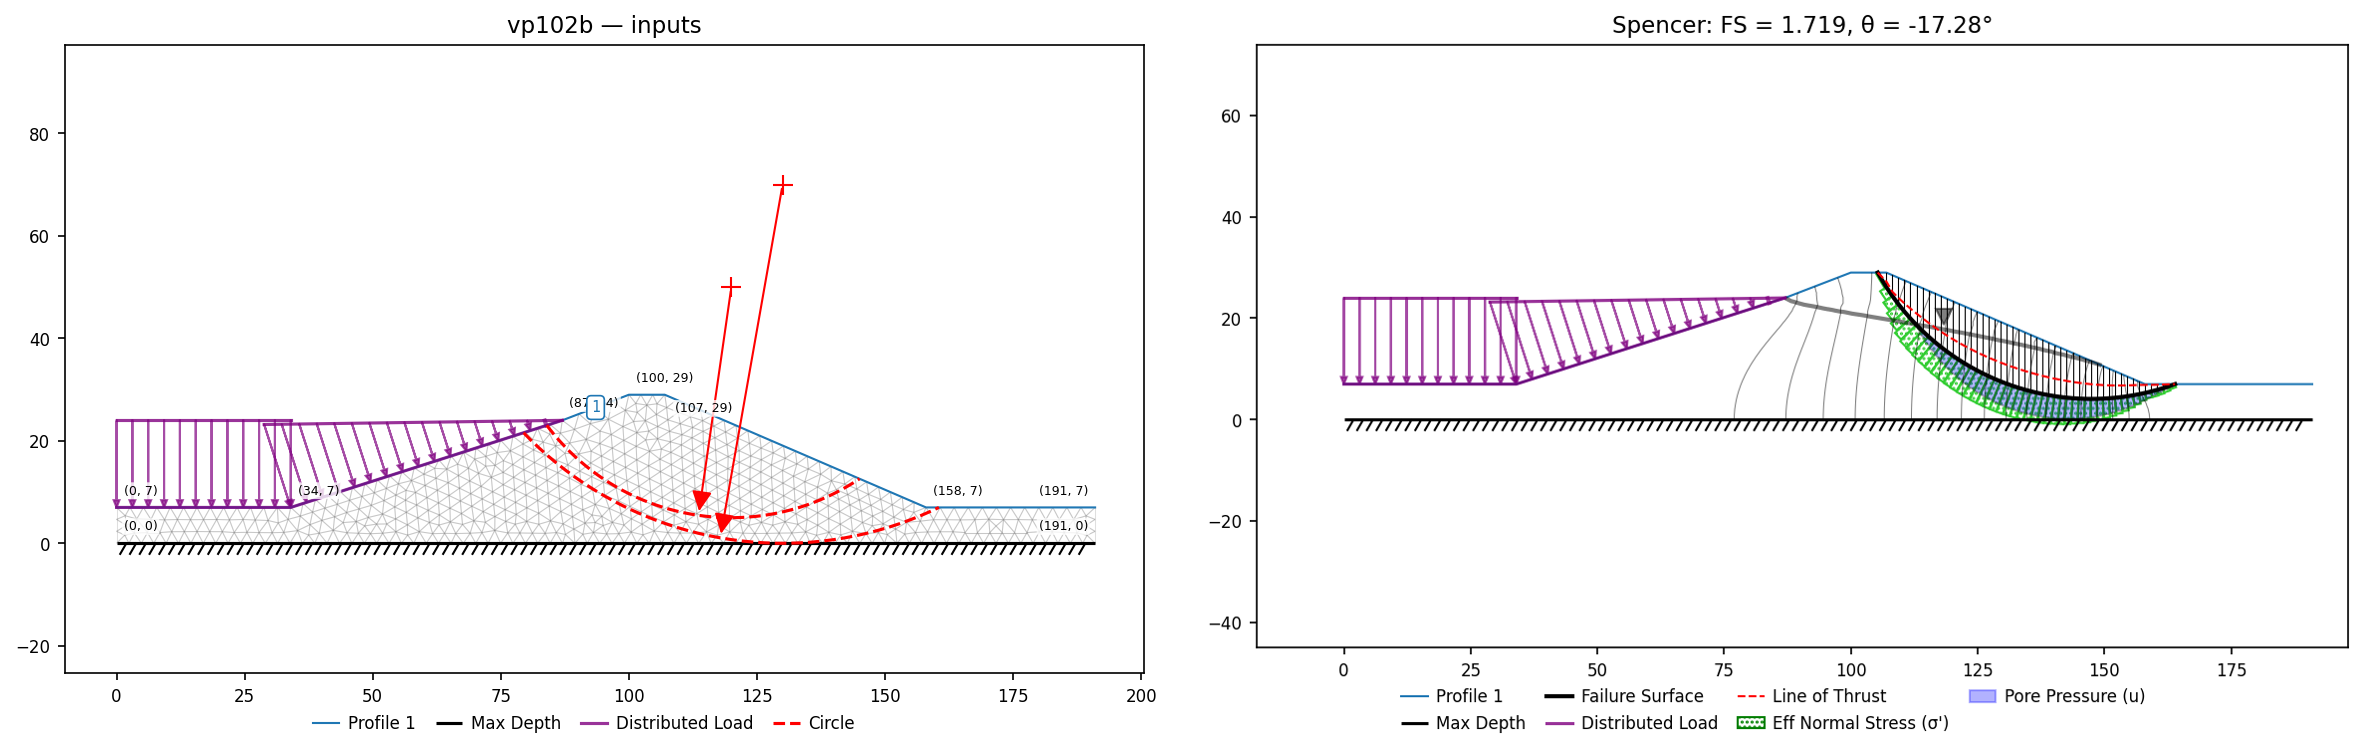
VP106: Support, Ito & Matsui pile
Input files: vp106a.xlsx (no pile) · vp106b / c / d / e (D1/D = 2, 3, 4, 6)
Cai & Ugai (2000)'s pile-reinforced slope: a 10-m, 1V:1.5H dry cohesive-frictional slope (γ = 20, c′ = 10, φ′ = 20) with a row of 0.8-m steel-tube piles at mid-slope, embedded to bedrock, at center-to-center spacings of 2–6 diameters. The pile's stabilizing force is the Ito & Matsui (1975) theoretical limit pressure, which XSLOPE computes automatically from the pile diameter and spacing (the per-pile force is divided by the spacing to give the per-meter-width value). The reaction is applied in the passive sense — added to the resisting moment and divided by the factor of safety — which is how Slide applies it.
| Case | XSLOPE (Bishop search) | Slide | Cai & Ugai |
|---|---|---|---|
| No pile | 1.143 | 1.14 | 1.13 |
| D1/D = 2 | 1.540 | 1.54 | 1.54 |
| D1/D = 3 | 1.451 | 1.43 | 1.37 |
| D1/D = 4 | 1.341 | 1.33 | 1.31 |
| D1/D = 6 | 1.260 | 1.25 | 1.25 |
At the closest spacing (D1/D = 2) all three programs agree exactly: the pile force is large enough that the critical surface avoids the pile entirely. At D1/D = 3 the published values themselves spread — Slide sits 4.4% above the paper, a search-method difference the manual acknowledges — and XSLOPE lands 1.5% above Slide; every other case agrees with Slide within 0.8%.
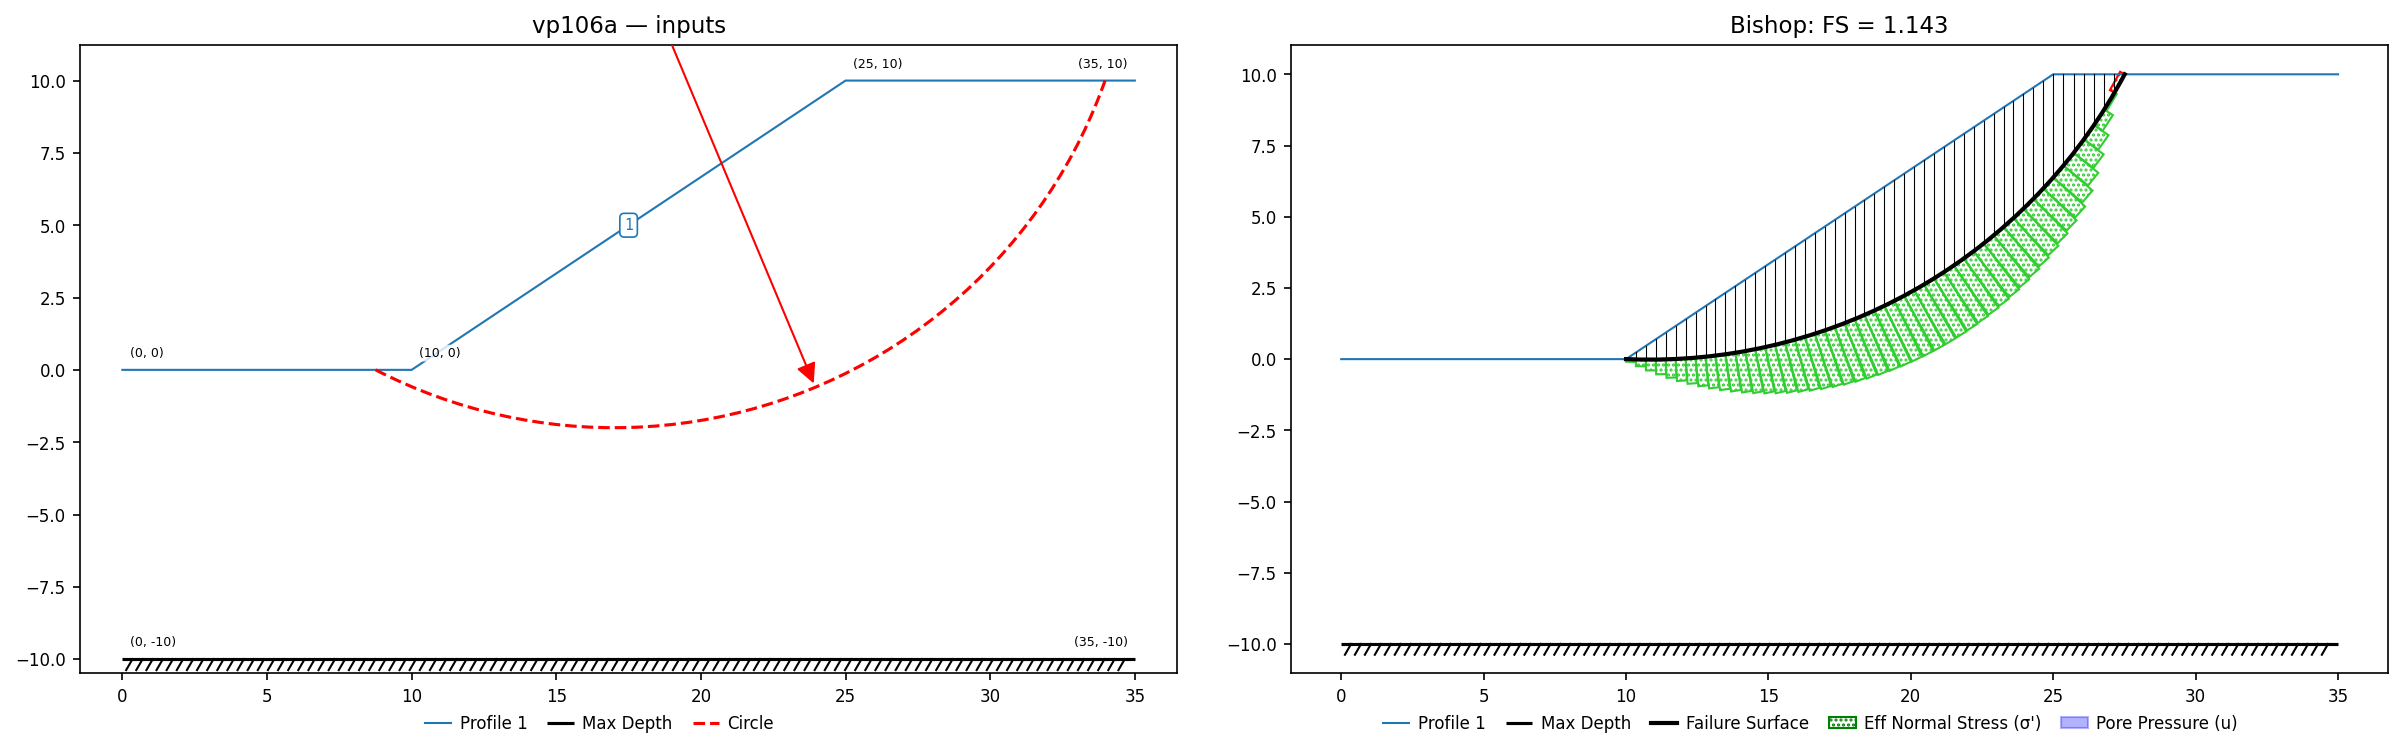
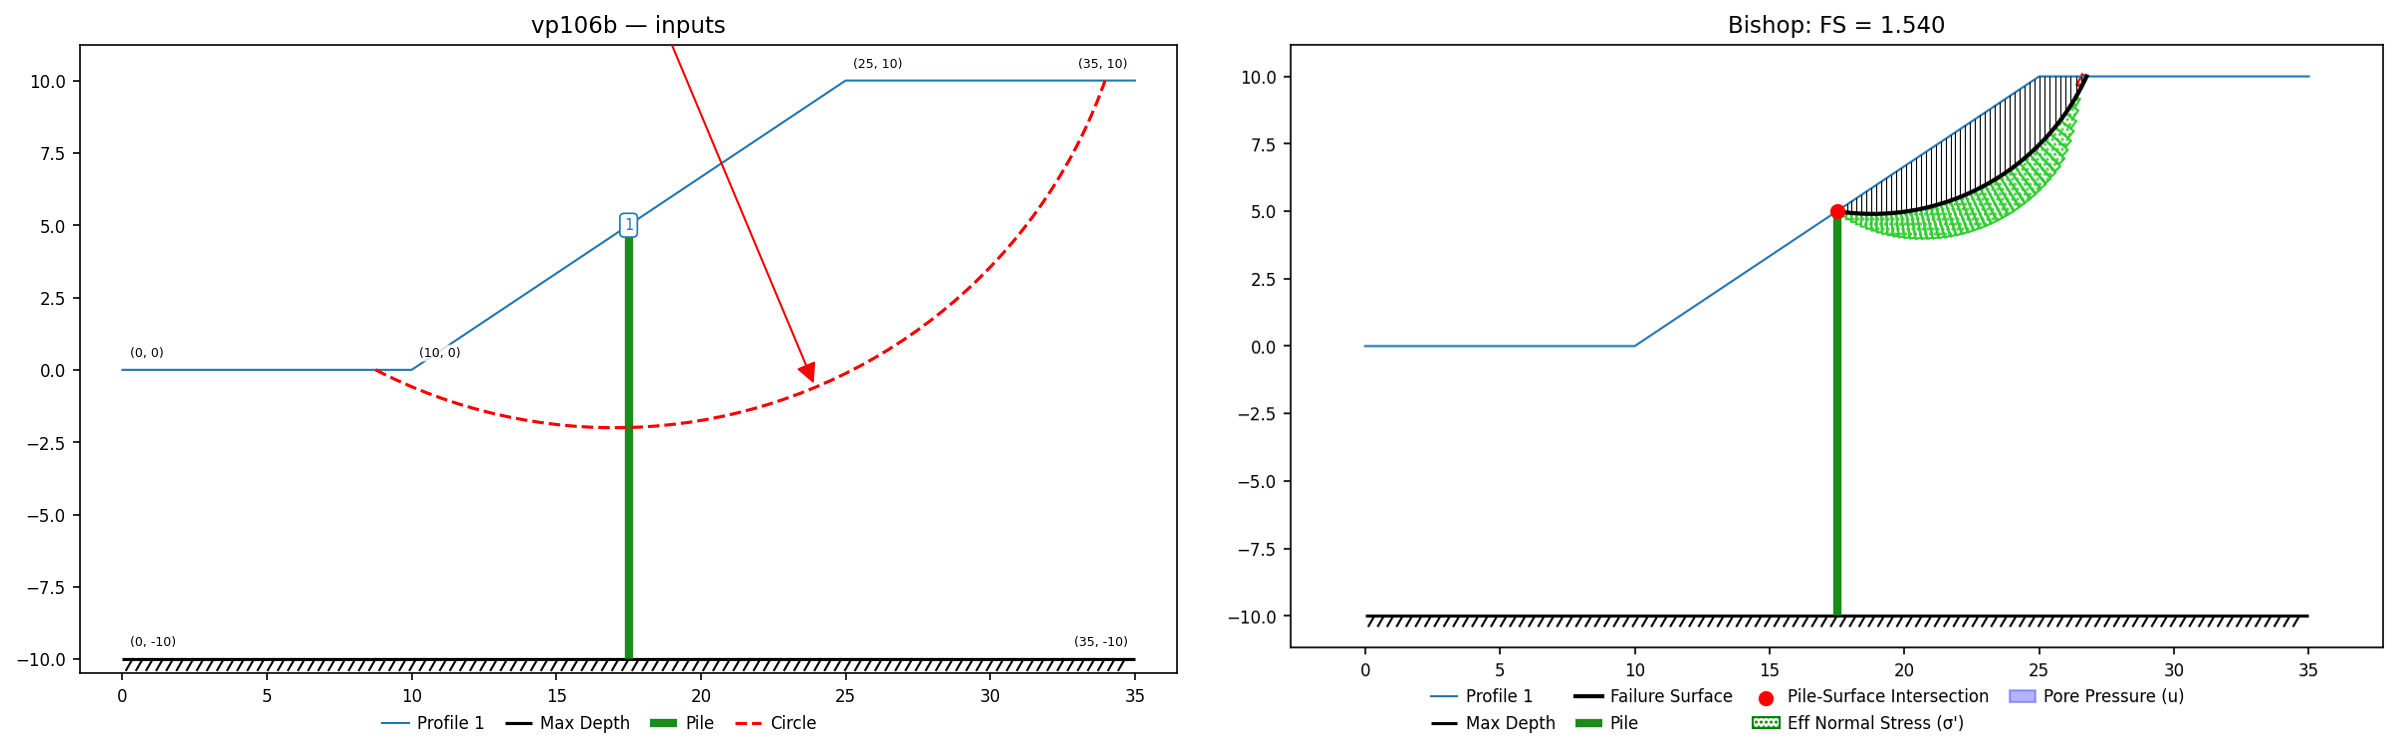
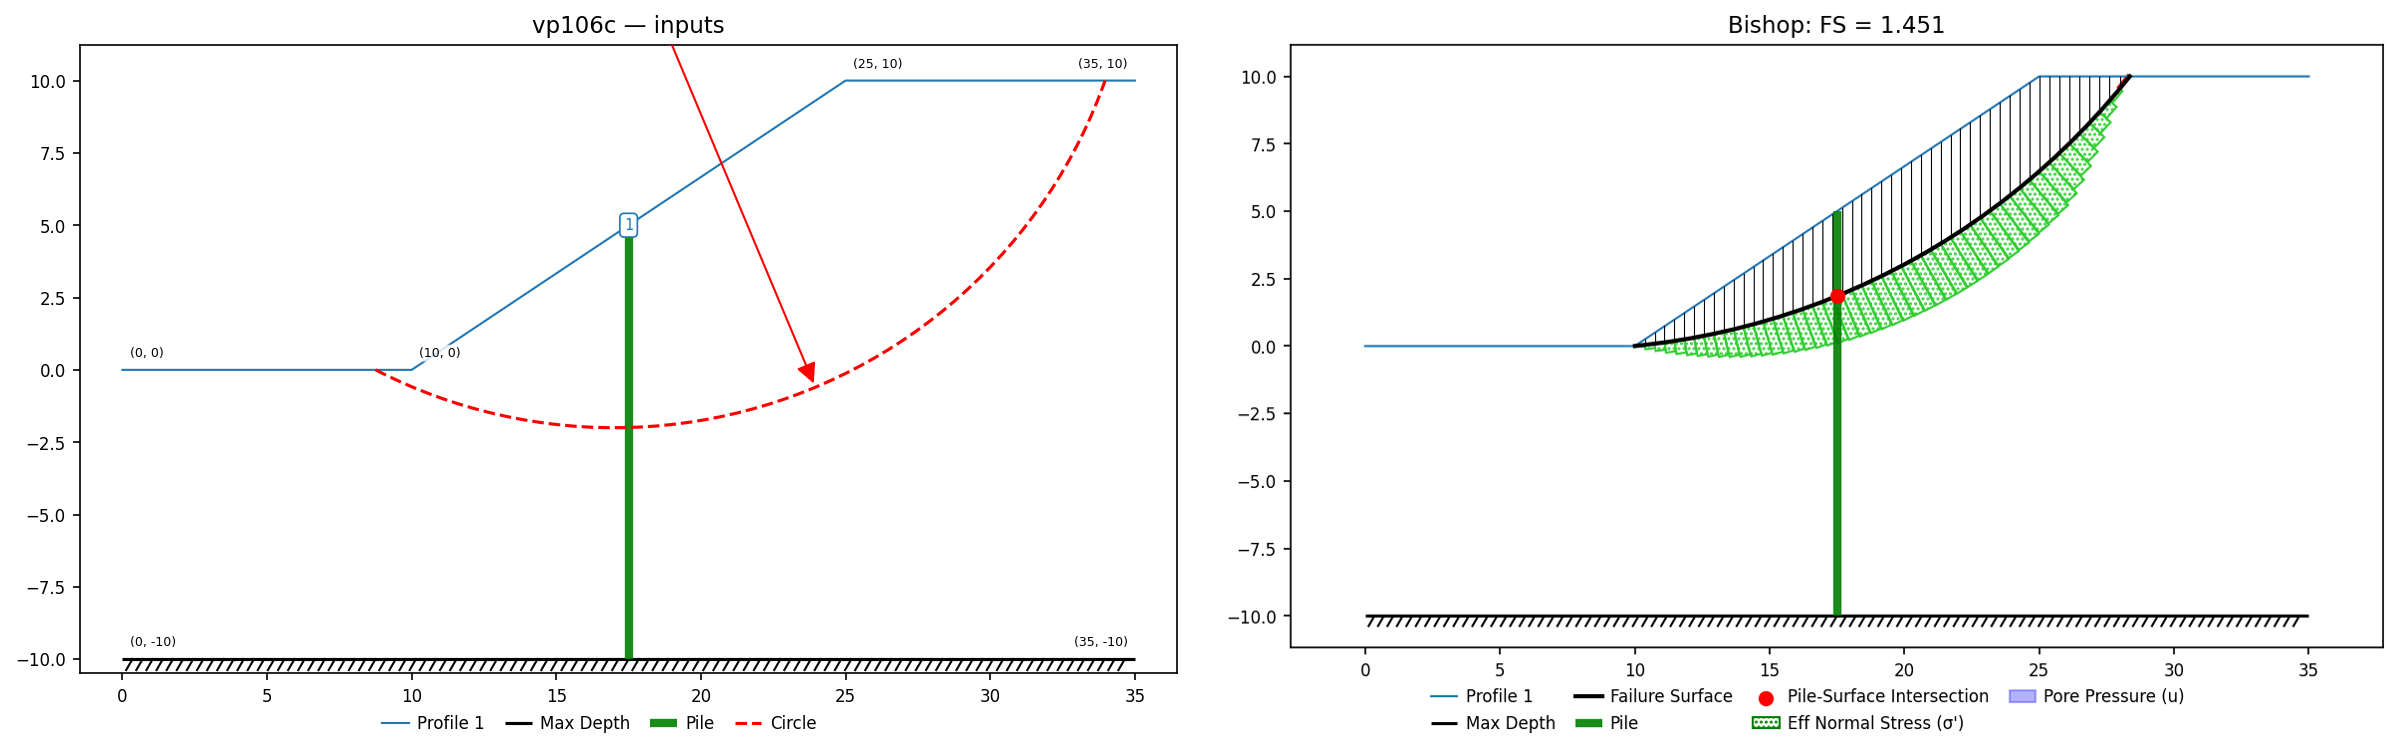
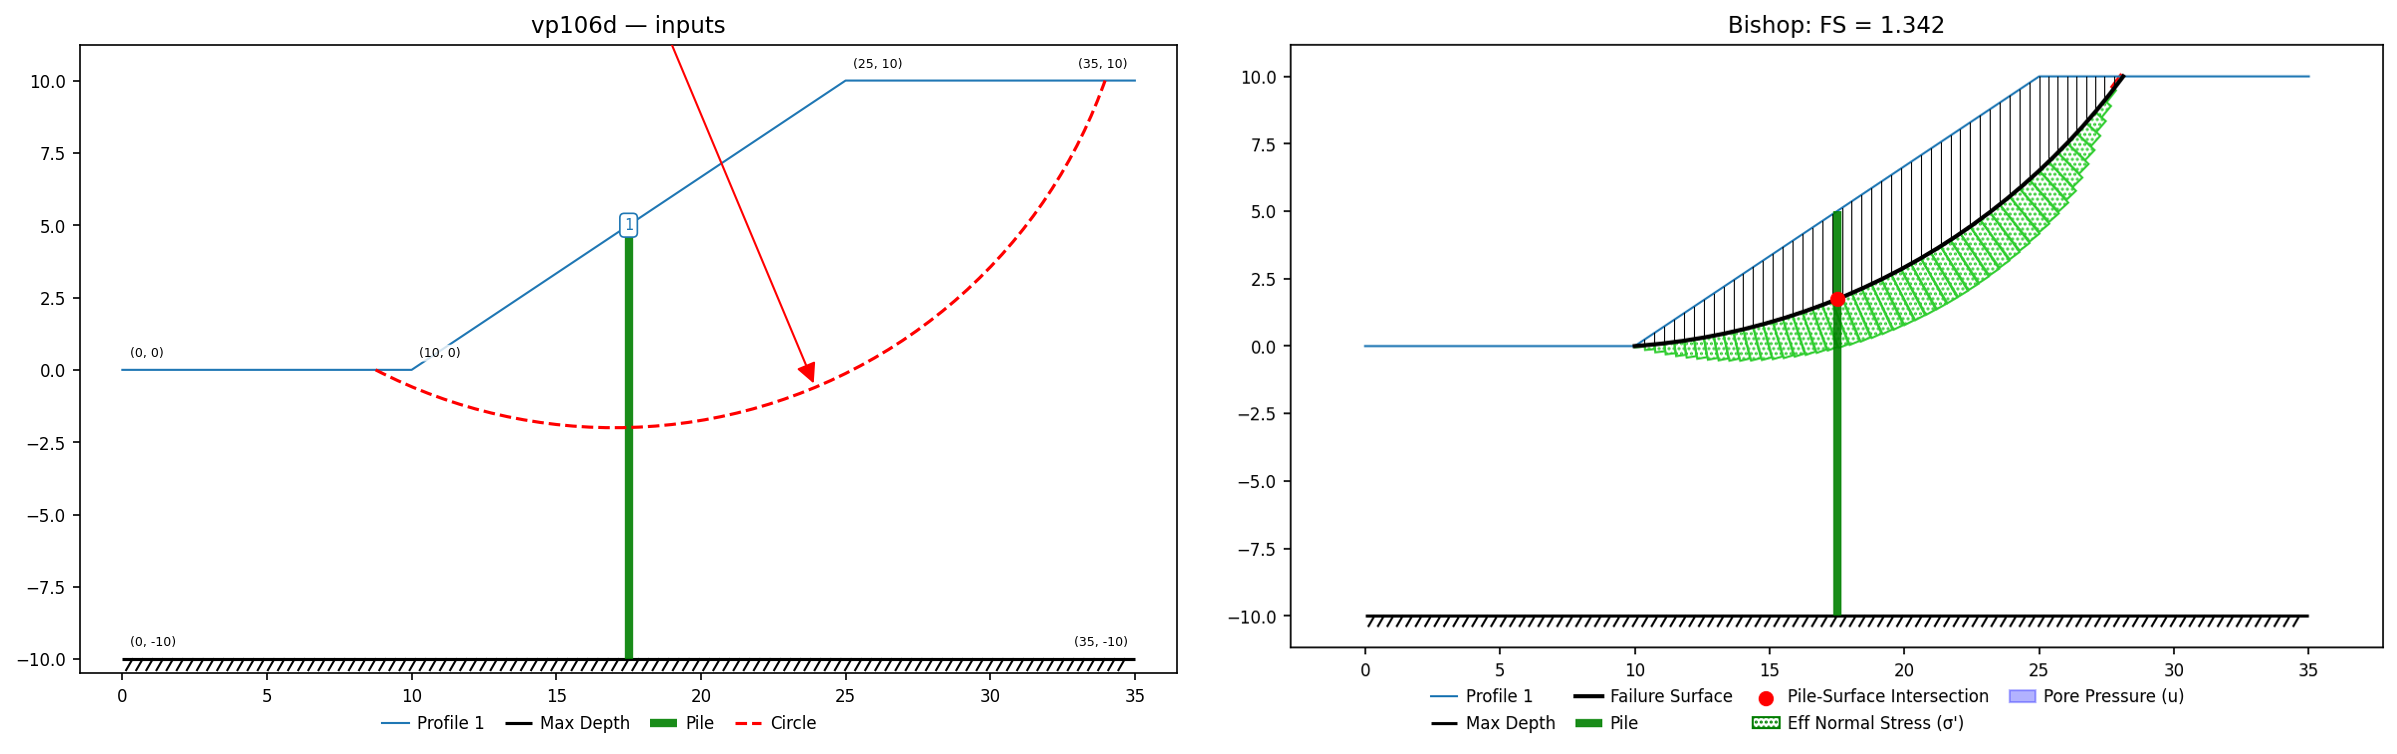
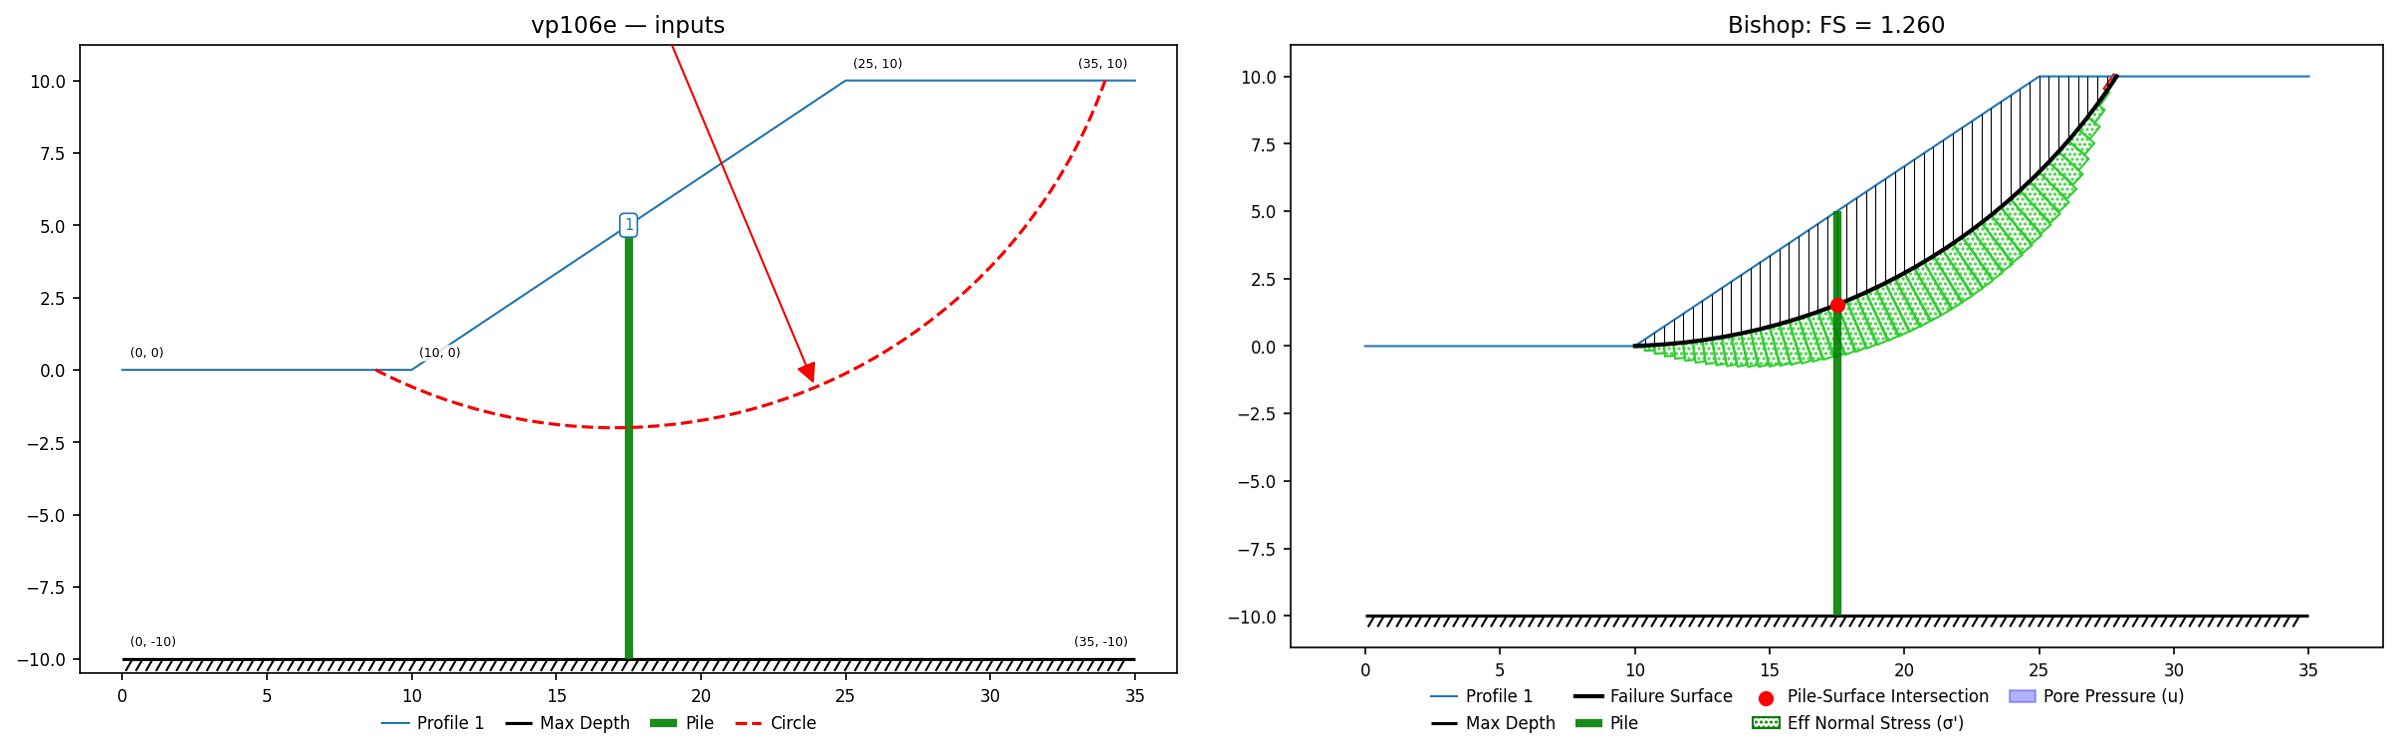
VP107: Retaining walls, gabion walls, supports
Input files: vp107a.xlsx (equivalent cohesion) · vp107b.xlsx (mesh method)
Cao et al. (2016)'s case study of a Vancouver gabion-wall failure: a 6 m battered wall of 1 m gabions (courses 4–3–3–2–2–1 wide) retaining a 30° backfill with a 12 kN/m² crest surcharge and a water table rising into the retained slope. Slide models the steel mesh two ways — an equivalent gabion cohesion (c = 100 kPa, from Grodecki 2017) or explicit geosynthetic supports at every course interface (T = 71 kN/m, tangent, active, anchored both ends) — and reports overall (external) stability only. Both variants are evaluated on Slide's drawn critical circle, which passes about a metre beneath the wall base.
| Variant | XSLOPE Bishop | Slide Bishop | XSLOPE Spencer | Slide Spencer |
|---|---|---|---|---|
| Equivalent cohesion | 1.382 | 1.373 | 1.398 | 1.386 |
| Mesh (geosynthetic supports) | 1.382 | 1.378 | 1.398 | 1.392 |
XSLOPE's unconstrained grid search finds the same deep basin at 1.366, within 0.5% of Slide's limit-filtered search. The governing surface passes under the wall, so it never crosses the mesh supports and the two representations coincide exactly on it — the manual's own conclusion. (The mesh-variant file exercises the geosynthetic input path; reinforcement mechanics are locked by VP87–VP94.) Slide's non-circular Cuckoo search reports unfiltered minima of 1.032/1.034 for small surfaces at the wall face, below the second limit set the manual applies to exclude them; those are not locked.
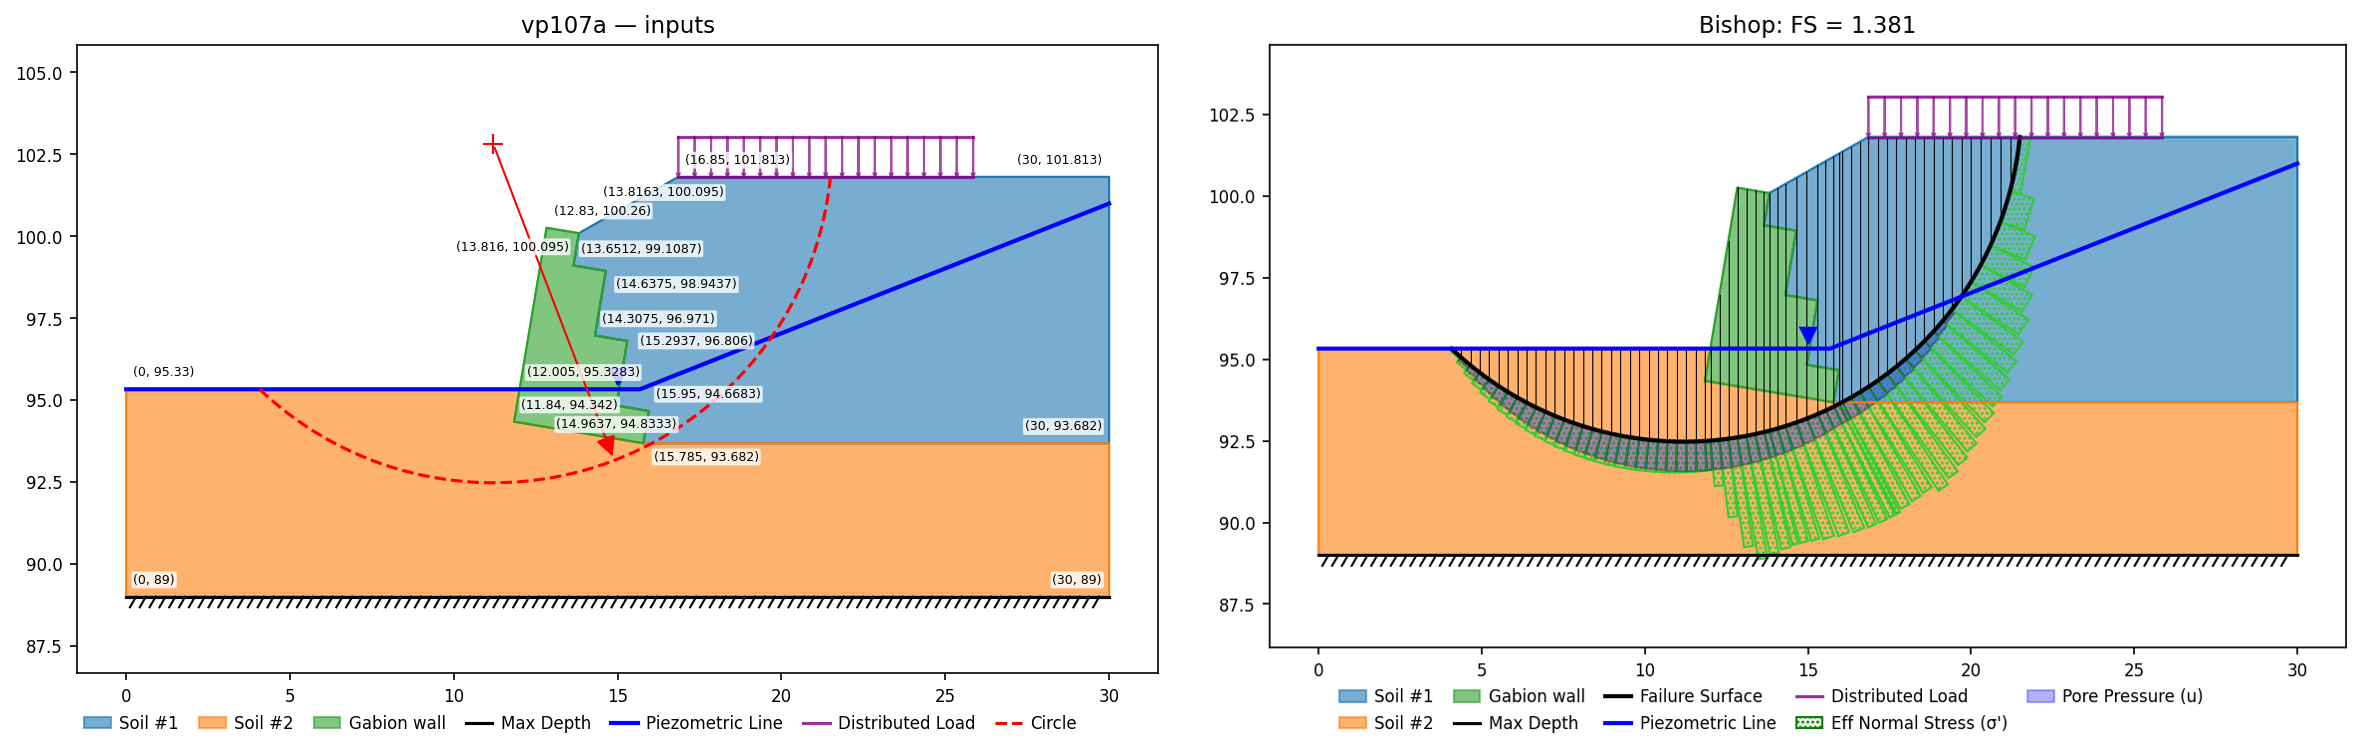
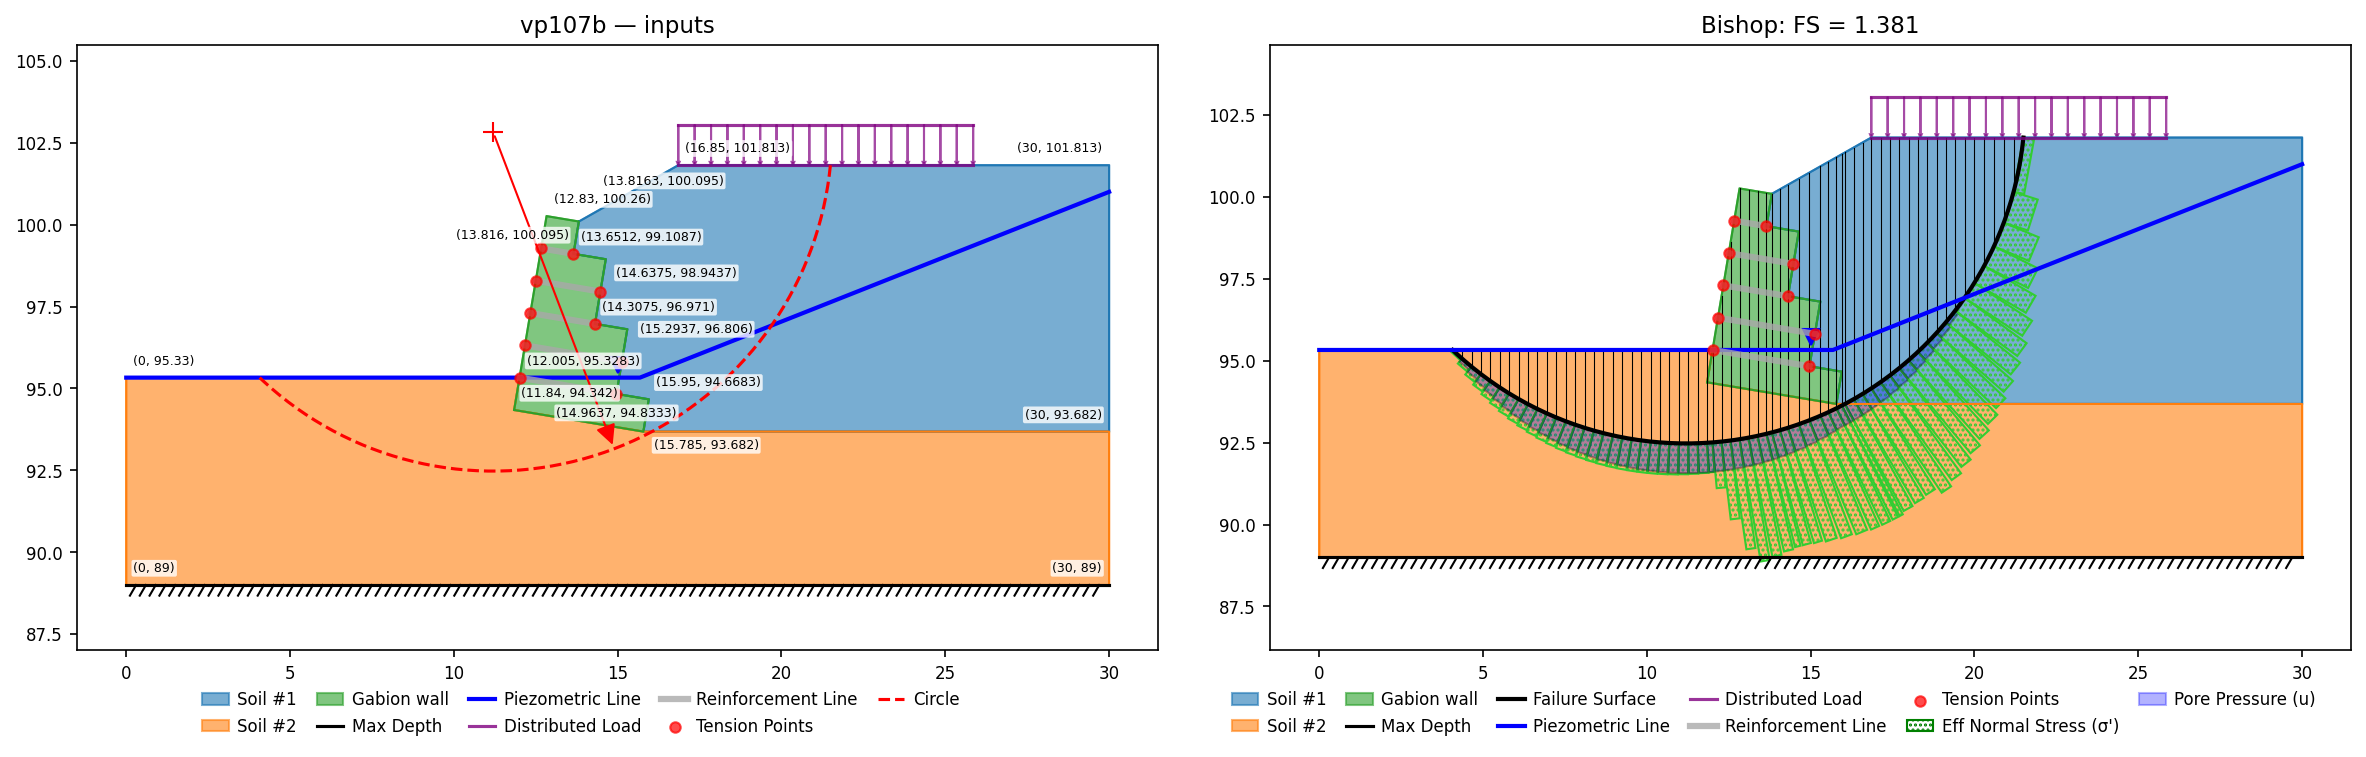
VP108: Stepped gabion wall, steps facing outwards
Input files: vp108a.xlsx (equivalent cohesion) · vp108b.xlsx (mesh method)
A 4 m gabion wall of 1 m cubes (courses 4–3–2–1, staircase exposed on the outward face, back face straight and partly embedded) on a sloping soil-1 over soil-2 profile, dry. As in VP107, Slide represents the steel mesh either as an equivalent gabion cohesion (c = 59.7 kPa, Grodecki 2017 with f_t = 100 kN/m) or as explicit geosynthetic supports (T = 100 kN/m) at the course interfaces. Both variants are evaluated on Slide's drawn critical circles, which enter the crest behind the wall and pass just beneath its base. The labeled points (16.453, 5.178) and (18.573, 5.89) pin where the soil-1/soil-2 interface meets the wall base and re-emerges one course up the back face — the bottom course's back is embedded in soil 2.
| Variant | XSLOPE Bishop | Slide Bishop | XSLOPE Spencer | Slide Spencer |
|---|---|---|---|---|
| Equivalent cohesion | 1.790 | 1.787 | 1.797 | 1.791 |
| Mesh (geosynthetic supports) | 1.830 | 1.835 | 1.835 | 1.839 |
XSLOPE's unconstrained grid search finds 1.761 in the same basin, 1.5% below Slide's limit-filtered grid search. The governing circles do not cross the mesh supports (the two variants differ only through their slightly different critical circles), so the mesh file's tag guards the geosynthetic input path rather than reinforcement mechanics — VP87–VP94 lock those. Slide's unfiltered Cuckoo minima (1.512/1.522, small wall-face surfaces) are excluded by the manual's own limit set.
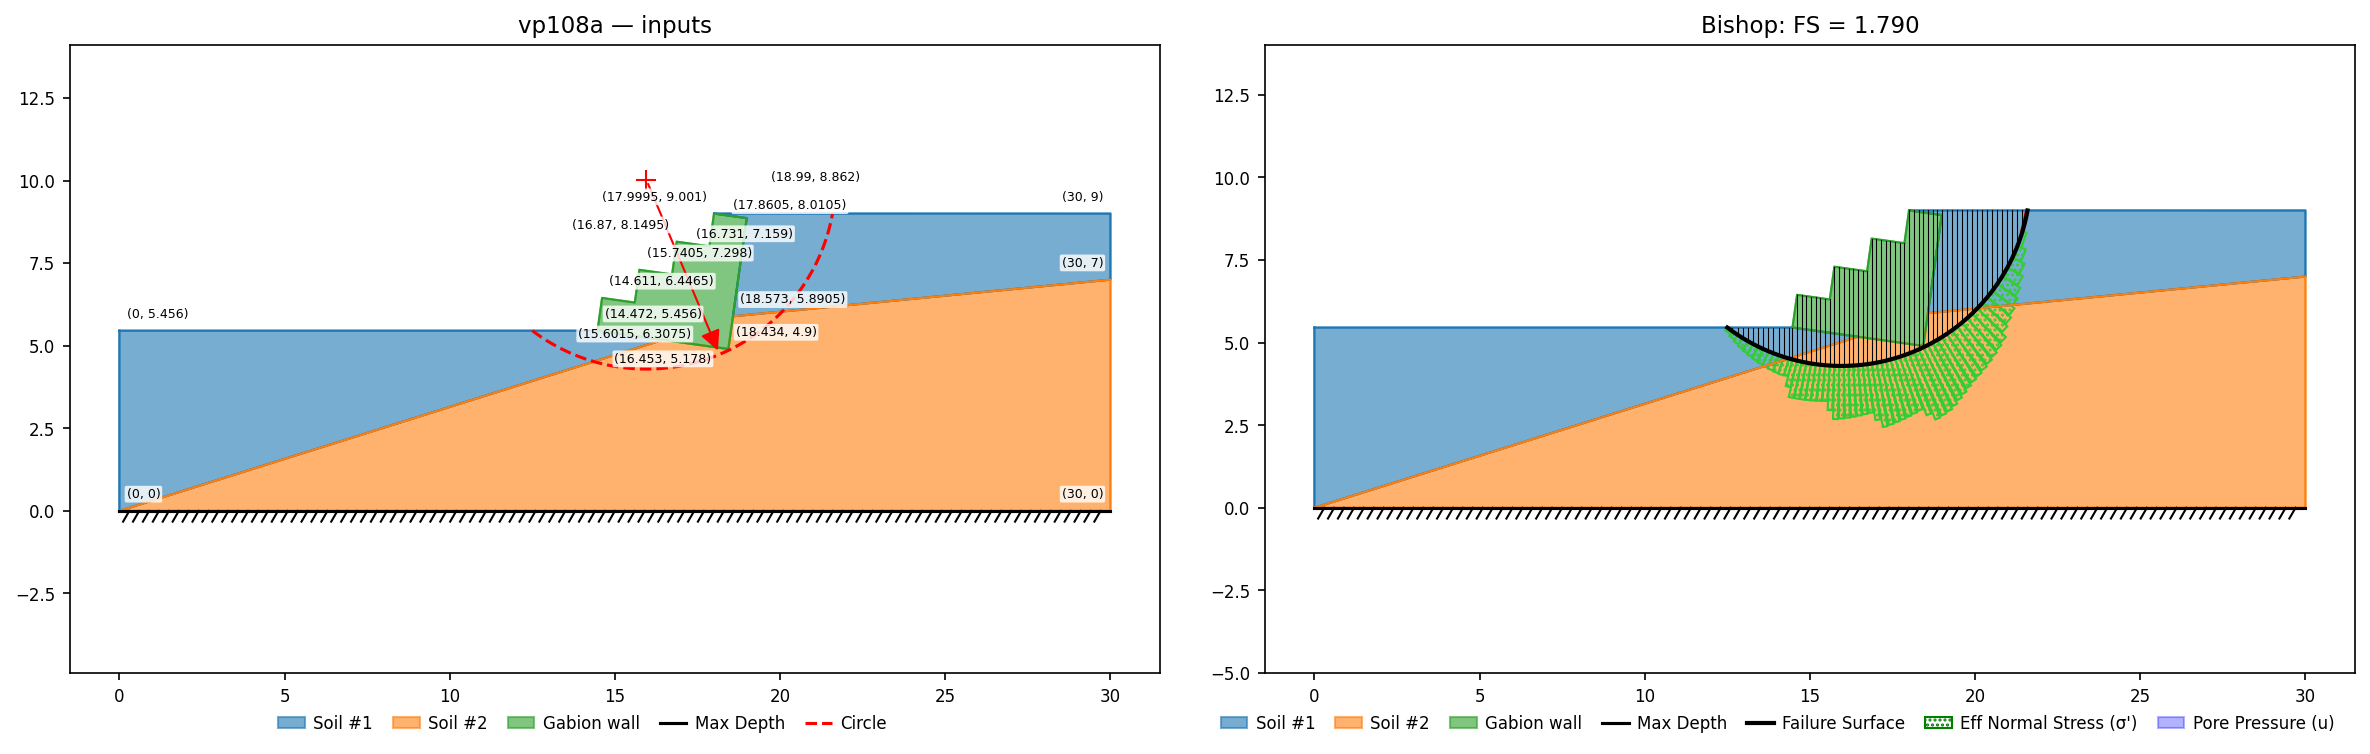
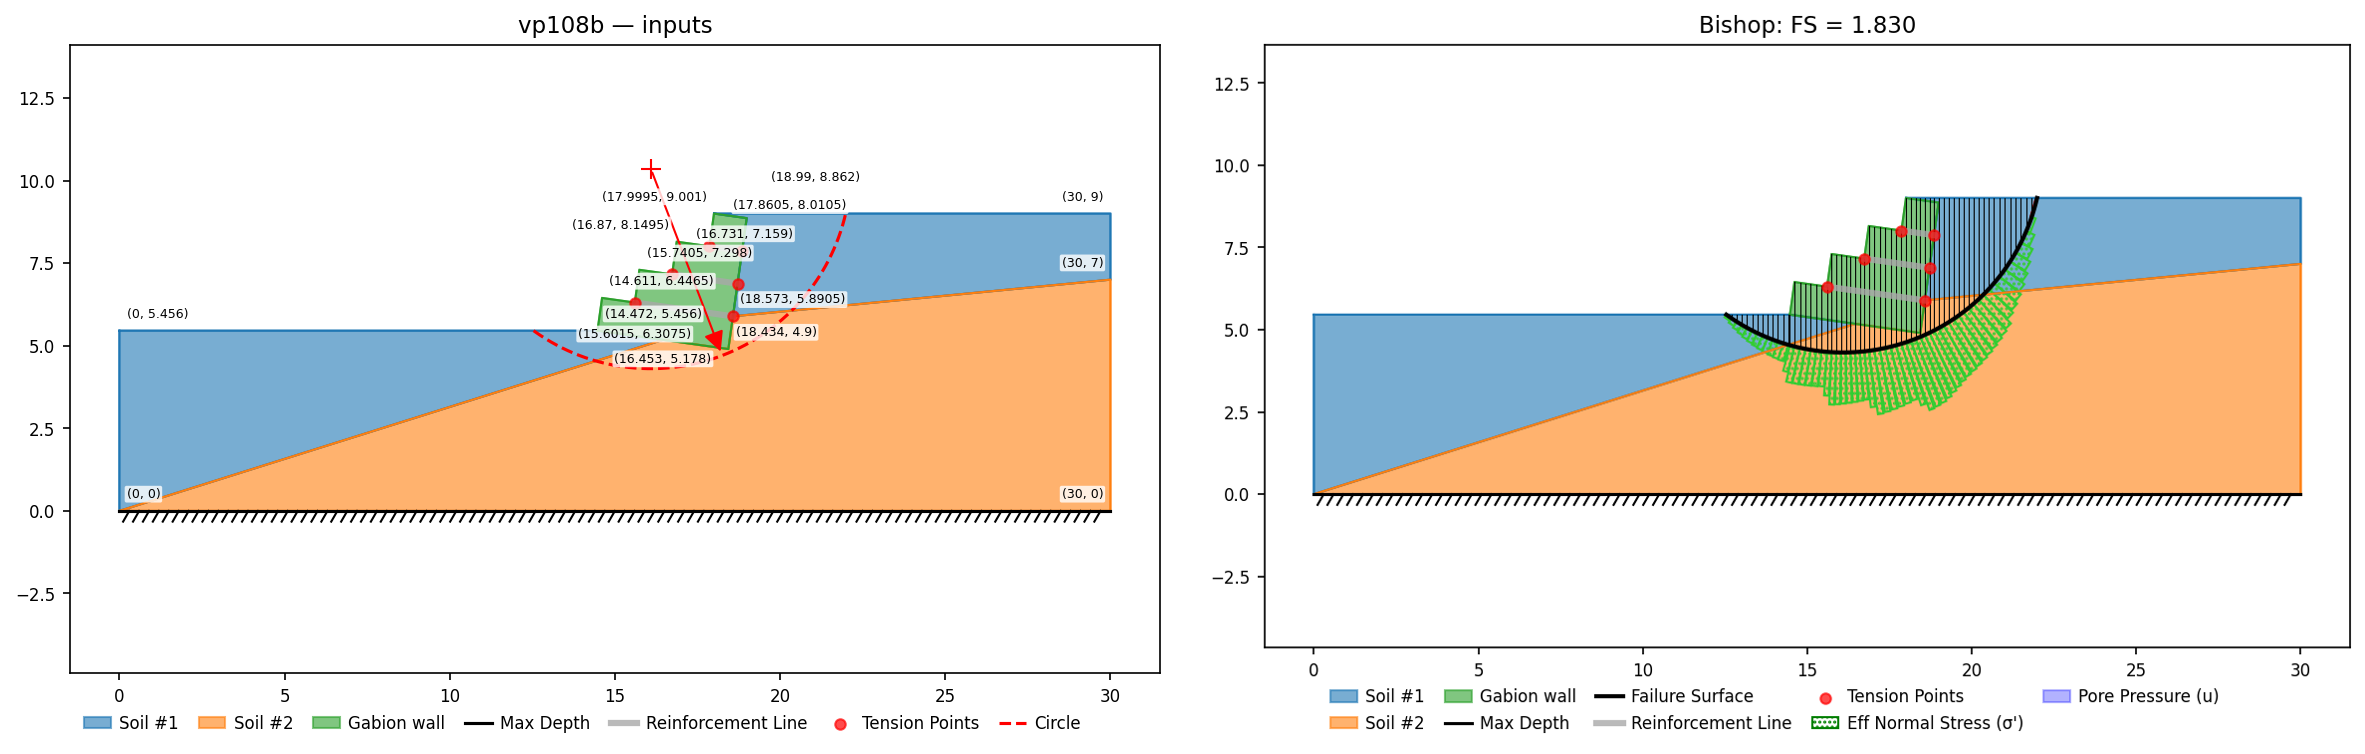
VP109: Gabion wall with weak joint layers
Input files: vp109.xlsx
The VP108 wall with thin weak layers between the gabion courses representing potential joint or shear failure through the wall: friction 90% of the gabion fill (φ = 37.8°) and cohesion from the 20.4 kN/m joint tensile strength across the 1 m gabion width (c = 20.4 kPa), modeled here as 6 cm bands carved from the wall at the three course interfaces. Slide runs a block search along the layers with endpoint limits that exclude small wall-hugging surfaces.
| XSLOPE (Fig 108.3 circle) | Slide (block search along joints) | |
|---|---|---|
| Bishop | 1.790 | 1.799 |
| Spencer | 1.797 | 1.803 |
The joint layers do not govern overall stability: Slide's constrained block search lands within 0.7% of the plain VP108 deep circle, which passes beneath wall and bands alike, and XSLOPE's unconstrained circular search on the weak-layer model agrees at 1.761. Slide's figure also reports an unfiltered block minimum of 1.516 for a small surface at the wall face, excluded by its limit set and not locked here.
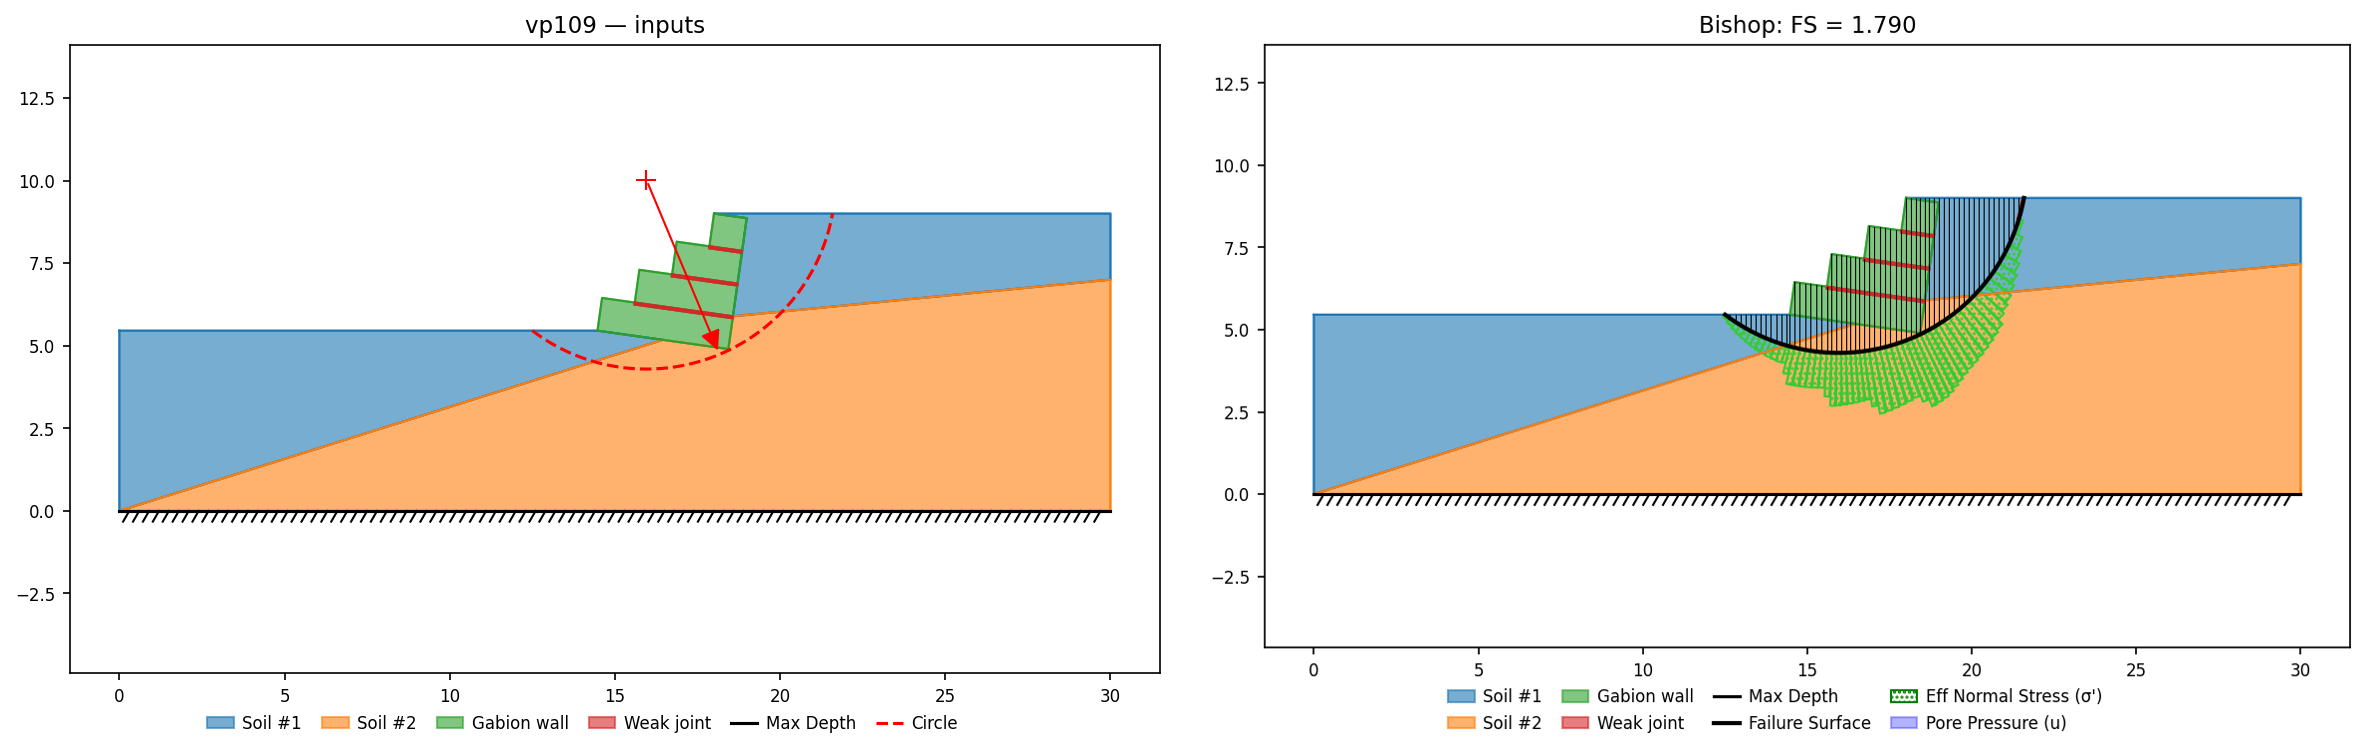
VP111: Helical anchor — capacity note (no lock)
Slide's problem 111 verifies its helical-anchor capacity envelope, not a slope analysis: for an anchor with three 0.2-m helices (1-m spacing, 0.1-m shaft), shaft tensile capacity 85 kN, head capacity 80 kN, in soil with c′ = 15 kPa, φ′ = 35°, γ = 20 kN/m³, the manual tabulates the available force as a function of where a slip surface crosses the anchor — the minimum of three failure modes (plate pullout behind the surface, stripping ahead of it, shaft tension), each from the Perko (2009) plate-bearing formulas. Stripping governs (80 kN) for crossings in the first ~3 m, plate pullout beyond (73.53 kN/m at the 3.5-m crossing for 1-m out-of-plane spacing), tapering to zero at the tip. There is no slope and no factor of safety, so there is nothing for XSLOPE to verify against.
Analyzing helically anchored slopes in XSLOPE: compute the governing capacity at the expected slip-surface crossing — from the supplier's rating, an installation-torque correlation, or the Perko formulas as above — divide by the out-of-plane spacing, and enter the result as the tension capacity of a standard anchor/reinforcement line at the anchor's geometry. This is the same value Slide's internal model would apply; only the plate-bearing bookkeeping is external. The manual's Table 111.1 serves as the acceptance test if an internal helical capacity model is ever added.